Descriptive Statistics
1/48
There's no tags or description
Looks like no tags are added yet.
Name | Mastery | Learn | Test | Matching | Spaced |
|---|
No study sessions yet.
49 Terms
Qualatative Data
data in the form of words, characteristics. etc. (ex> fav color, birthday month)
Quantitative Data
data in the form of numerical values (ex>height, weight)
Discrete Quantitative Data
Limited values that we can count
Continous Quantitative Data
Values over an interval (normal curve)
univariate data
1 variable
bivariate data
studies the relationship between 2 variables
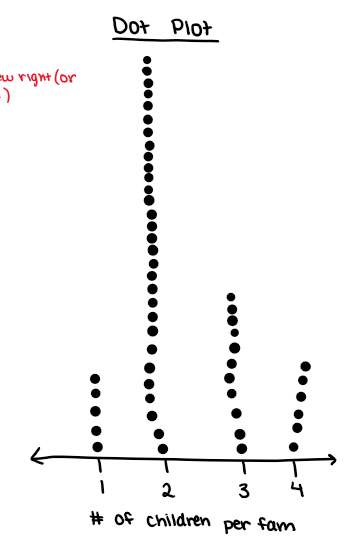
dot plot
quantitative
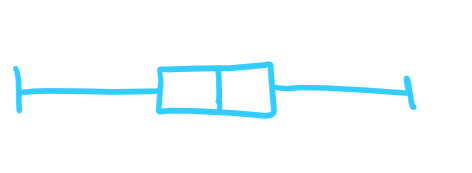
boxplot
quantitative
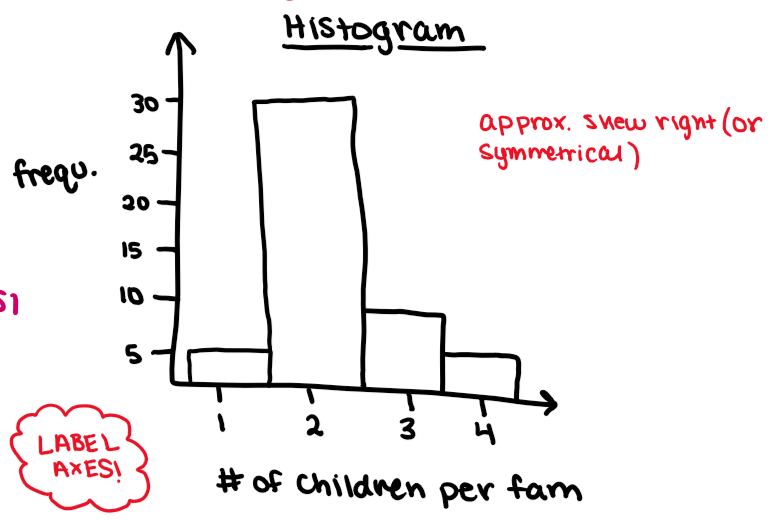
histogram
quantitative, bars touch, measures the variable against the frequency
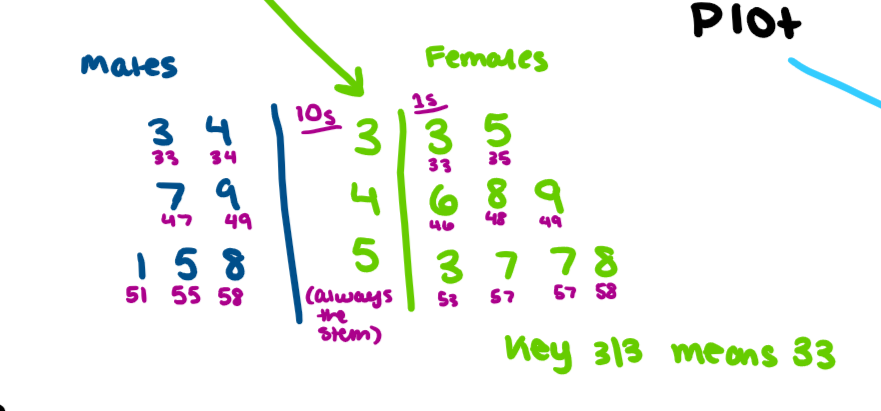
stem and leaf plot
quantitative, needs a key
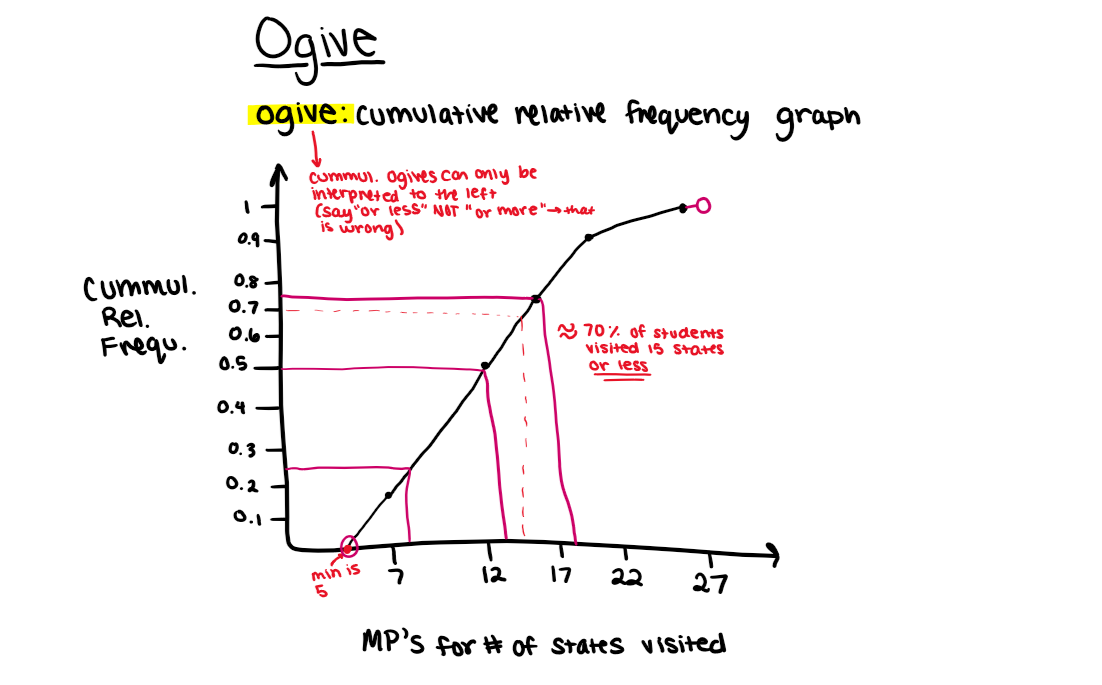
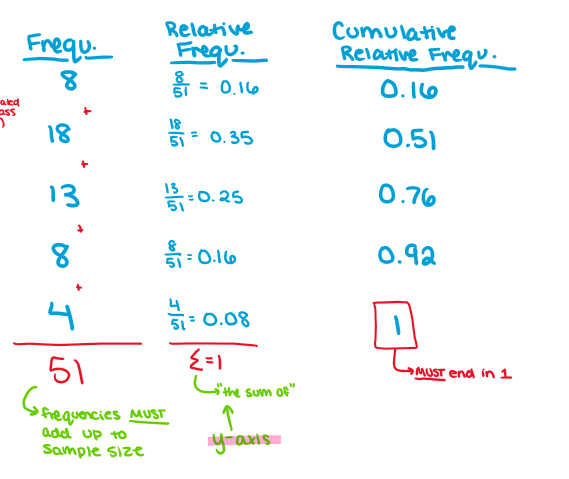
Cummulative Frequency Plot (ogive)
quantitative, remember when interpretating - it is to the left (say “or less”), 0% = min, 25% = Q1, 50% = med, 75% = Q3, 100% = max, y-axis adds up to 1 (or 100%)
qualitative graphical displays
pie chart, bar chart
distribution definition
a set of data that uses the frequency that each outcome occurs among all possibilities (all of the possible outcomes of your data)
measures of central tendency
where center of distribution of data lies
mean
median
mode (The mode is strictly for qualitative data!! You HAVE to use mean or median for quantitative data !!)
measures of spread
amount of variation in distribution
range
IQR
standard deviation
calculator key
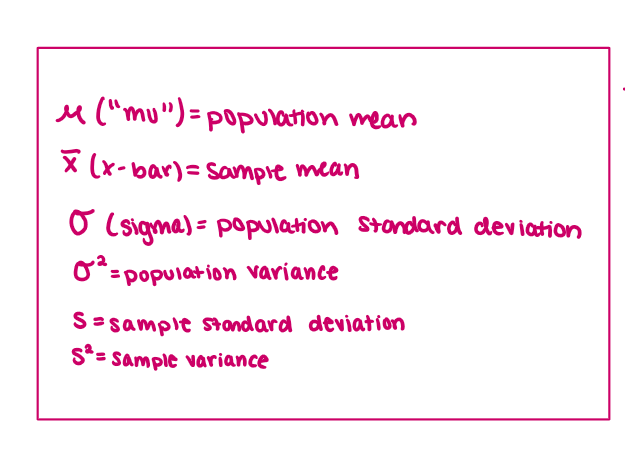
n = sample size
shapes of distribution
skew right
skew left
unimodal
bimodal
symmetric
uniform
multi-modal
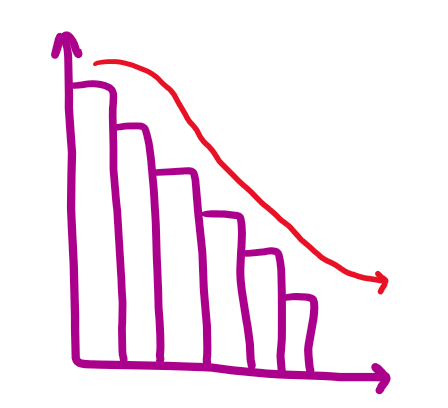
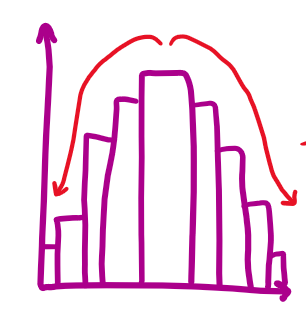
skew right
mean>median>mode
tail is to the right
few data points to the right pull the mean up
unimodal (one peak, one mode)
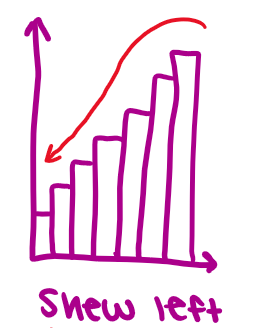
skew left
mean<median<mode
tail is to the left
few data points to the left pull the mean down
unimodal (one peak, one mode)
symmetric
bell shape
unimodal (one peak, one mode)
mean = median = mode
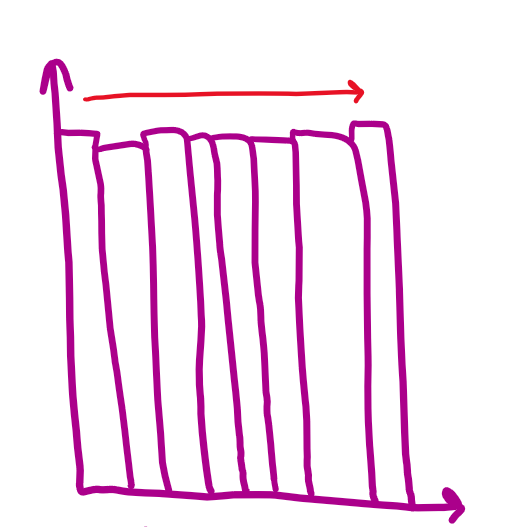
uniform
about same heights
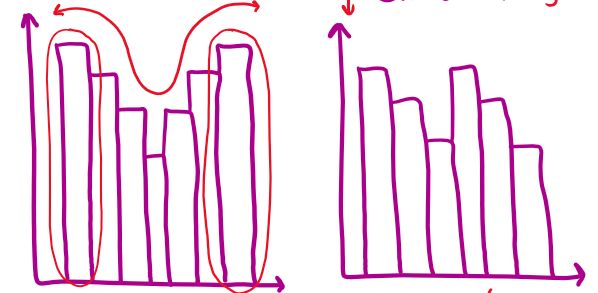
bimodal
symmetric vs. nonsymmetric
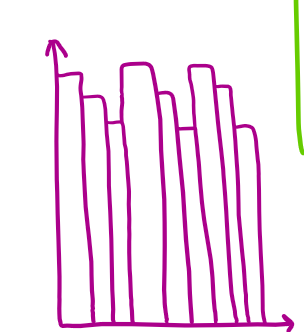
multi-modal
description: with skewed data use…
median
median doesn’t get affected by outliers/skewedness (unlike the mean)
IQR
boxplot
description: with symmetric data use…
mean
standard deviation
histogram
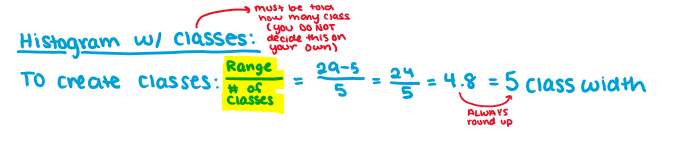
how to make classes on histogram
(not needed)
5 number summary
min, Q1, med, Q3, max
how to find median point
(n+1)/2
…then count to that point and that is your median (when listed in order)
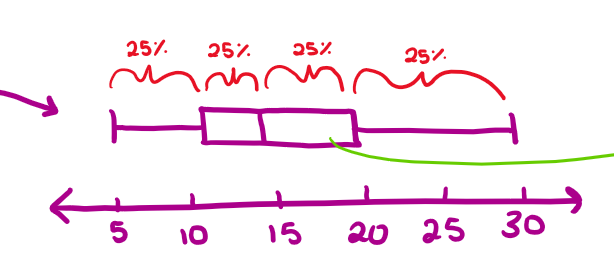
when making a boxplot…
create number line to space everything out evenly
intervals are spaced out in 25%’s (this shows the spread, not the number of points)
when it is longer, it just means the points are more spread apart from each other (variability)
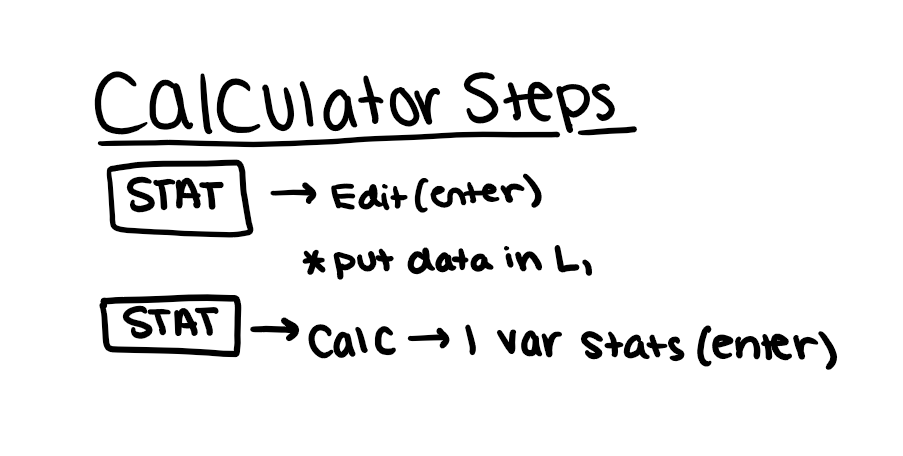
calculator steps
standard deviation
the average distance each value lies from the mean
The more points you have in the middle, the smaller the standard deviation. The less points you have in the middle, the larger the standard deviation.
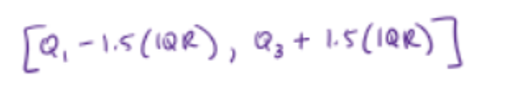
calculating outliers
outliers fall OUTSIDE of this interval
can write it as the “usual interval of points”
rules when describing data
center
spread
shape
unusual features (gaps, outliers, clusters)
MUST BE IN CONTEXT
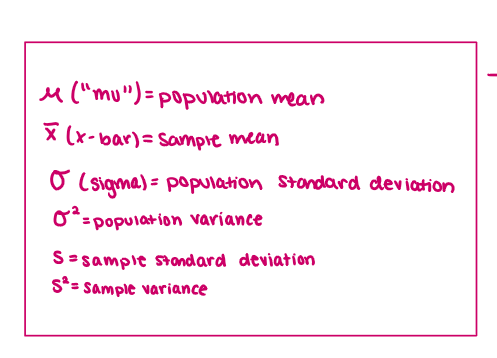
symbols
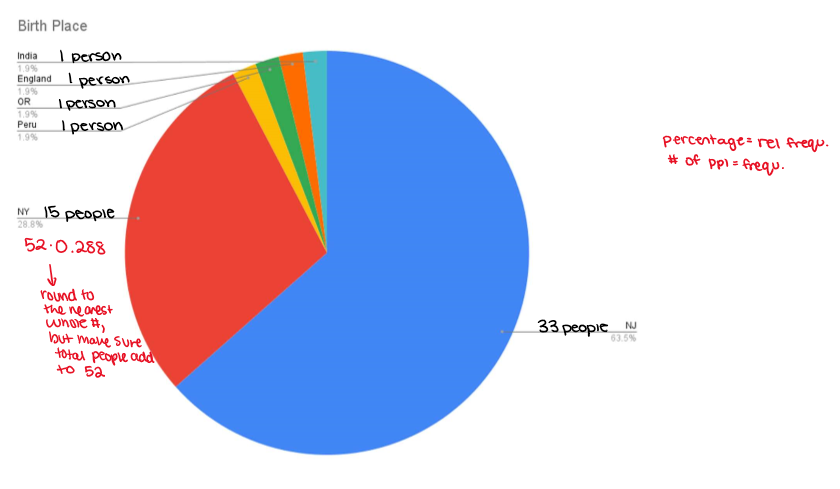
pie chart question
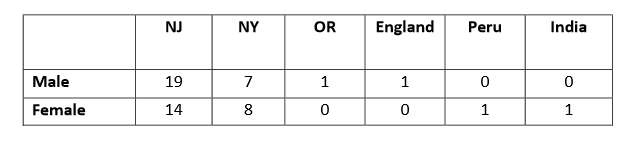
contingency table
2 way table
segmented bar graph
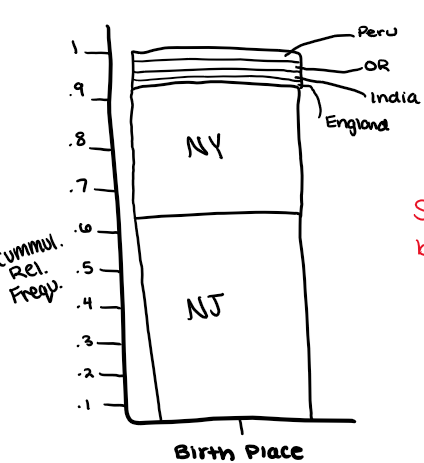
relative frequency vs cumulative relative frequency
relative frequency: how frequent this number occurs
cumulative relative frequency: the frequencies but added together as the data moves up
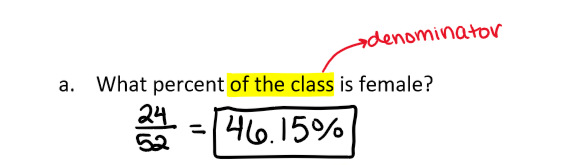
when talking percents
whenever there is “of the __” - that is the denominator
comparitive statements
“greater than, higher, larger, less than, lower, smaller, equal, the same”
Normal Distribution - properties
symmetric about the mean
curve approaches the horizontal axis, but never touches or crosses it
total area under the curve is always equal to ONE
area under the curve = probability
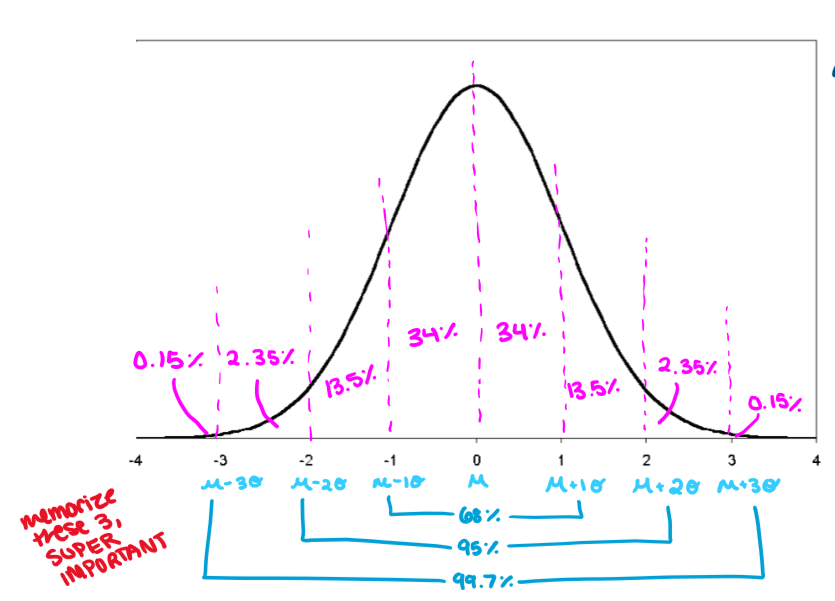
The Empirical Rule can be applied for ANY normal distribution
it is considered UNUSUAL to be more than 2 SD from the mean in either direction
Normal Distribution - graph
68% of data lies within 1 SD of the mean
95% of data lies within 2 SD of the mean
99.7% of data lies within 3 SD of mean
when describing normal distributions, ALWAYS write “approximately” and always state the direction (above/below) you are describing
percentile
that # and to the left (below)
The rth percentile is a value such that r% of the observations in the
data set fall at or below that value
Comparing 2 data sets
Back to back stem and leaf
Parallel box plots
Side by side histograms
Write comparative statements between distributions
Include context and suggestions!
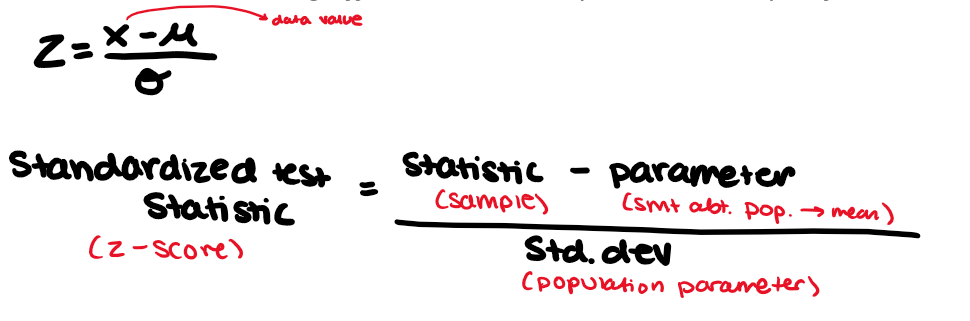
z-score
A z-score tells you exactly how many SD a data value is above or below the mean.
z-score is positive when data is above the mean
z-score is negative when data is below the mean
can only use z-score with normal distribution
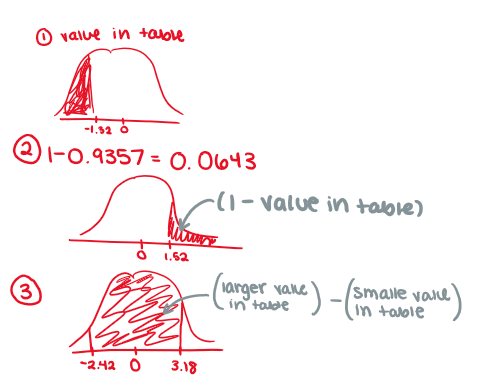
calculating probability with z-score
draw a graph to visually see it
to the left: refer to formula sheet
to the right: refer to the formula shete and subtract that from 1
between: larger value in table - smaller value in table
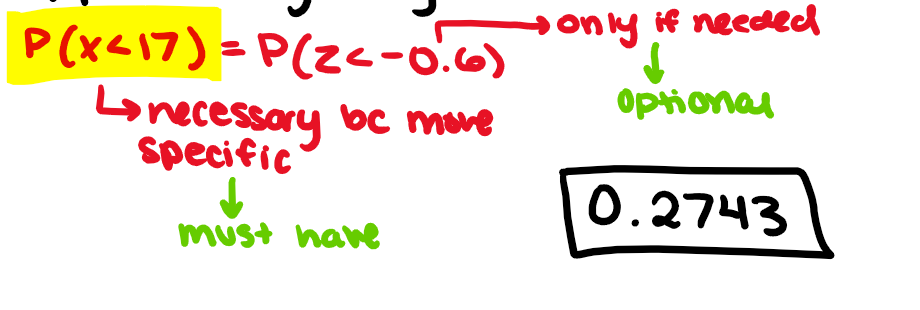
steps when handling problem w/ z-score
write the info (or do a diagram)
find z-score (round to 2 decimal places)
find probability using table (must have you P statement)
answer in context
quartiles
Q1 = median of 1st half of data
Q3 = median of 2nd half of data
How does a shift and multiplier affect the mean (measure of center) or SD (measure of spread)?
Measures of spread are ONLY affected by multipliers
Measures of center and individual values are affected by BOTH shifts and multipliers