AP ENVIRONMENTAL: POPULATIONS, UNIT 4
1/68
Earn XP
Name | Mastery | Learn | Test | Matching | Spaced | Call with Kai |
|---|
No analytics yet
Send a link to your students to track their progress
69 Terms
R strategists have ____ maturation, have ____ offspring, are _____ in size, have ____ care for young, and have a ____ lifespan.
Rapid, many, smaller, little, shorter
Two examples of R strategists are
Mice & fish
K strategists have ____ maturation, have ____ offspring, are _____ in size, have ____ care for young, and have a ____ lifespan.
Slow, few, larger, more, long
Two examples of k strategists are
Lion & elephant
What are some factors that influence a population?
Births, deaths, and resources
What is population size?
The total number of organisms in a given area
What is population density?
The total number of organisms per unit area.
What is population dispersion?
The arrangement of organsims in an area
The three types of population dispersion are
Clumped/group, uniform/equal, & random
Why are most populations arranged in clumped?
Resource availability, caring for young, protection, mating, group work
What factors affect population growth?
Birth, death, immigration, emmigration
What is the formula to calculate growth rates? (Formula #1)
(Birth + immigration) - (death + emmigration)
What is the formula for natural growth? (Formula #2)
Birth - death
What is the formula to calculate crude birth/death rates? (Formula #3)
[(The number of Births/deaths)/total population] x 1000
What are crude birth/death rates?
The number of birth/deaths per 1000 people in one year.
The rule of 70 formula estimates the number of years it takes for
A certain variable to double
What is the formula for the rule of 70? (Formula #4)
T=70/r
The variable “t” in the formula of rule of 70 is
Doubling time
The variable “r” in the rule of 70 formula is
Annual growth rate [note; never convert percentage into a number. 7.31% becomes 7.31)
Fertility rates are
The number of children a woman will have in her lifetime
Total fertility rate is
The average number of children born to a woman in reproductive years/in her lifetimr
Replacement level fertility rate is
The average number of children a couple must have to replace themselves
Populations cannot grow indefinitely due to
Environmental resistance
Biotic potential is
Population growth with no limits
Biotic potential results in ____ growth.
Exponential
Carrying capacity (k) is
The maximum amount of species in a ecosystem that can be supported by the environment
Carrying capacity is determined by ____ and ____
Biotic potential & environmental resistance
Intrinisc growth & logistic growth graphs both deal with
Population growth over time
When a population meets environmental resistance, it results in a ____ population
Stabilizing/fluctuating
Intrinsic growth graphs represent ____ niches. The ____ shaped curve shows the rate at which a population would grow with ______ _____
Fundamental, J-shaped, unlimited resources/no environmental resistance
Logistic growth graphs are ___ shaped and represent the rate at which ______
S-shaped, population growth decreases as it reaches the carrying capacity

What conditions would cause line #1 to have this pattern?
Climate change/seasons
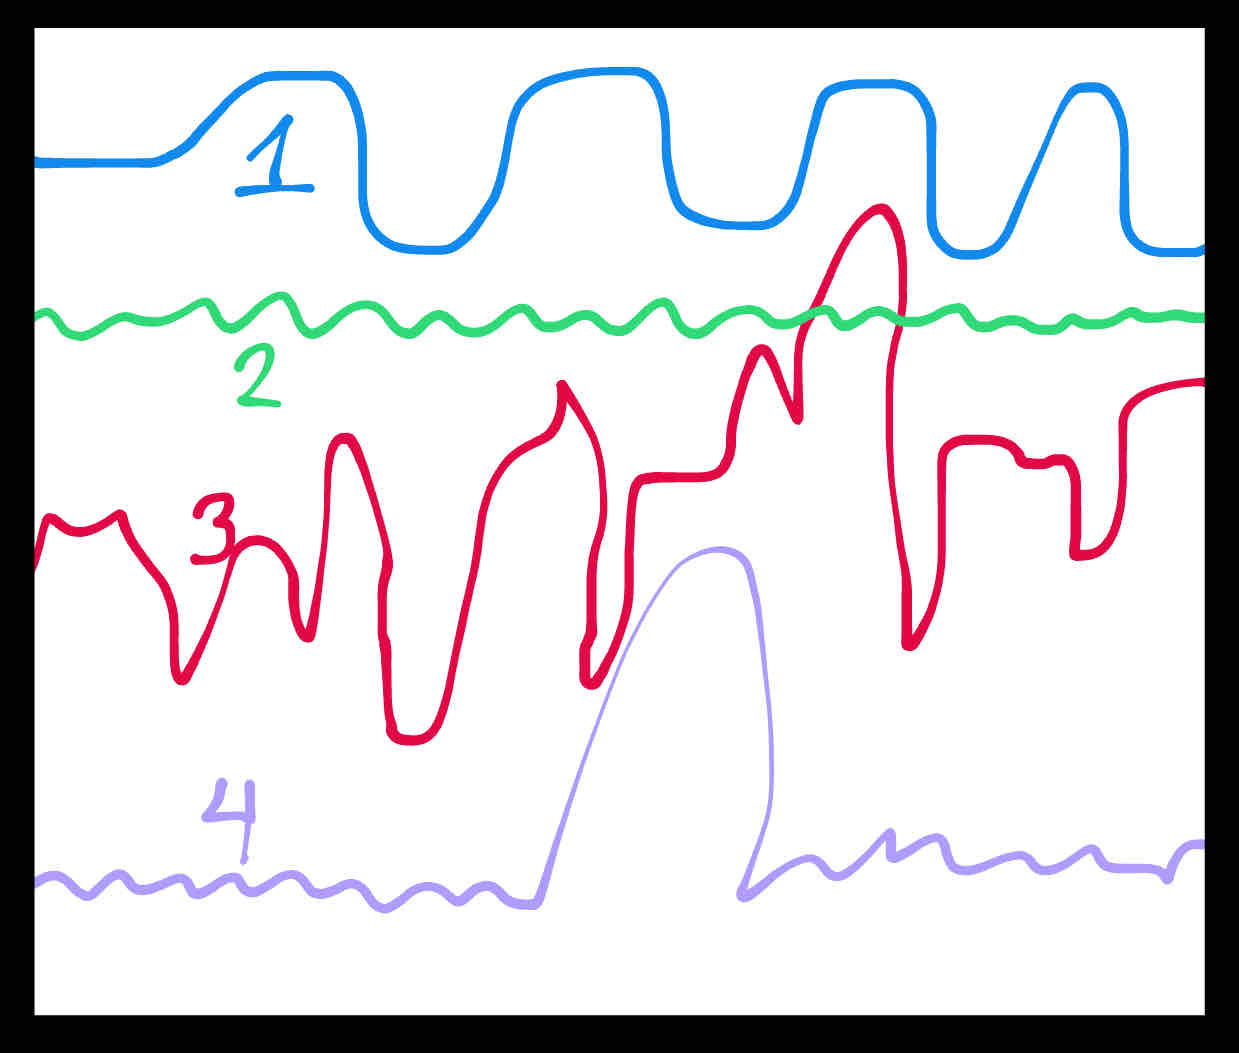
What conditions would cause the protrusion in line 4?
Immigration or a baby boom

Would the carrying capacity of line 3 be at the highest point of the line? Why or why not?
No. The carrying capacity would not be at the highest point in line 3 because it’s not relatively stable at that level.
Density-dependent limiting factors of a population are
Resources, predation/competition, & disease
Density-independent limiting factors of a population are
Natural disasters, clearing of habitats, pesticides, weather, war, & temperature
Developing countries (LDC), with lower income and weak social support systems, have ____ economies & ____ population growth.
Agriculture, rapid
Developed countries (MDC) have higher incomes and strong social support systems, which leads to a(n) ______ economy and ____ population growth.
Industrial, slower
The world population is growing exponentially. The three most populated countries are
China, India, & USA
Some plausible reasons for population growth are
Expanding habitats, beginning an agricultural society, food availability, & germ theory (discovery of medicine)
Birth rates are currently decreasing due to
Urbanization, women studying and working, birth control, the cost of raising children, & religious/cultural beliefs (note: religious/cultural beliefs can go either way)
Birth rates can increase because of
Children in the workplace, pension opportunities, & religious/cultural beliefs (sometimes)
How are death rates AND birth rates decreasing?
People are living longer lives & because of the amount of people, there is usually a replacement.
Factors that influence death rates are
An increase in life expectancy (because of medical advances), decrease in infant death rates, increased food supply/improved nutrition & improved hygiene
Type 1 of the survivorship curve shows
A high probability of surviving adulthood up to a certain age
Type 2 of the survivorship curve shows
The chance of survival/death is independent of age
Type 3 of the survivorship curve shows
A high probability of death in early stages but those that survive live very long
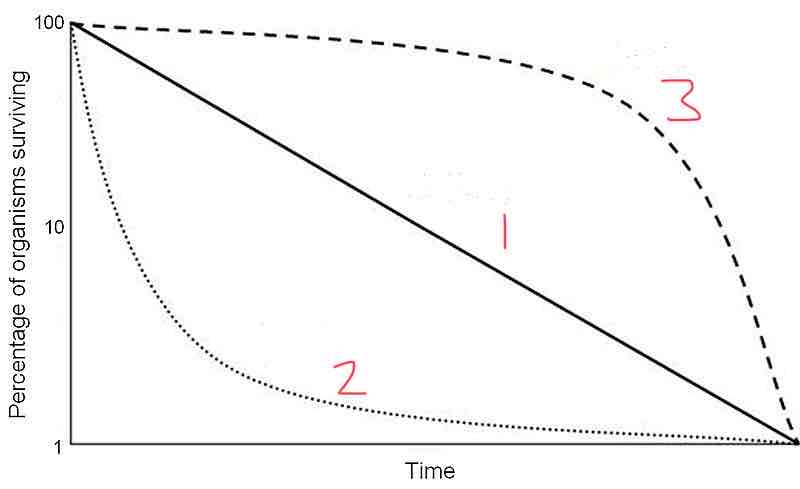
Line 1 in this graph could be a species like
Birds

What type of survivorship curve is represented by line 3?
Type 1

What type of survivorship curve is represented by line 2?
Type 2
Factors that affect migration are
Economy, war, environmental refugeeing, political freedoms, & religious freedoms
Age structure diagrams show the distribution of ages in a specific population at a certain time. How are they usually split?
0-14 is pre-reproductive, 15-44 is reproductive, 45-85+ is post reproductive
An age structure diagram showing rapid growth is best represented by
Developing countries with people with short lifespans
Between rapid and slow growth, there is an increase in
Life expectancy
The 4 most popular types of age structure diagrams are
Rapid, slow, stable, & declining
Demographic transition models usually have 4 or 6 phases. These models examine _______ & _____ rates to calculate and hypothesize _________
Birth & death rates, population growth changes
Stage 1 of the demographic transition model is pre-industrial. Population growth is _____. The birth rate (BR) is ____ and death rate is _____. Explain why for both cases.
Population growth is net zero/low in growth. Birth rates are high due to no birth control and high infant morality and death rates are high due to the lack of medicine/resources
Stage 2 of the demographic transition model is transitional. The population growth is _____. The birth rate (BR) is ____ and death rate is _____. Explain why if there was a change from the prior stage.
Population growth is exponential. Birth rates remain high. Death rates drop because life expectancy increased, we settled, resources are easier to access, and better hygiene
Stage 3 of the demographic transition model is industrial. The population growth is _____. The birth rate (BR) is ____ and death rate is _____. Explain why if there was a change from the prior stage.
Population growth stays exponential. Death rates continue to drop (continous increase of resources, medicine, & hygiene). Birth rates rapidly decrease because women go to work
Stage 4 of the demographic transition model is post-industrial (it can also be whatever is after stage 3). The population growth is _____. The birth rate (BR) is ____ and death rate is _____. Explain why if there was a change from the prior stage.
Population growth is still increasing but starts to stabilize. The birth and death rates are both steady and low.
If birth & death rates are low, why is the population still growing?
There are still enough people in pre-reproductive/reproductive years alive.
We can slow population growth through… (5 ways)
Family planning, empowering women (w/ education & jobs), free access to contraceptives/abortions, late marriages & encouraging families to not have more than one child
In 1974, there was 12,500 births in Miami with a population of 70,000. What is the crude birth rate? (Round to nearest whole number)
179
In 2016, the world population growth is about 2.9% per year. How long would it take for this world’s population to double & by what year would this doubling occur? (Round to the nearest whole number)
24 years, 2040
If the doubling time for the world’s population is 23 years, what will be the growth rate over this time period? (Round to nearest hundreth)
3.04%
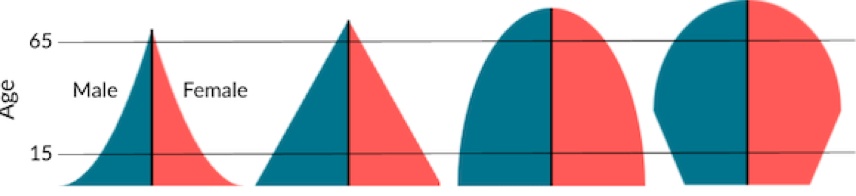
Which graph shows rapid growth?
#1

Which graph shows slow growth?
#2

Which graph shows stable growth?
#3

Which graph shows declining growth?
#4