Lecture 10: Biodiversity and Biogeography
1/72
There's no tags or description
Looks like no tags are added yet.
Name | Mastery | Learn | Test | Matching | Spaced |
|---|
No study sessions yet.
73 Terms
UN definition of Biodiversity
Total number of species on Earth (global species richness)
Evolutionary diversity represented by these species
Diverse communities and ecosystems these species build
How does the equilibrium theory of island biogeography apply to island-like habitats such as mountains?
Island-like habitats (e.g., mountains) function like ecological “islands” because they are isolated patches of suitable habitat surrounded by unsuitable areas.
Species richness on these habitats is determined by the same balance of immigration (species arriving from other patches) and extinction (species lost within the patch).
Closer, larger, or more connected mountain habitats have higher immigration and lower extinction rates, while smaller or more isolated ones support fewer species—mirroring the classic island biogeography model.
About 2 million species have been described in the scientific literature. But there are biases
We know there are 1000000 species of insects but they are more studied because
They are easier to sample and there are lots of them as a result scientists are very confident we have identified 50% of insects that exist
Fungi are unstudied and we have barely described 5% of fungi
Bacteria that harms us is well studied, but bacteria that for example just exists in the soil and is not virus, is not as studied
The Challenges of Estimating Global Species Richness
A historical reliance on physical and morphological characteristics
Biases exist with respect to which species / ecosystem are studied.
Many species are hard to find and researchers are limited by logistic, time, and funding constraints.
Many species are going extinct before they are described.
A historical reliance on physical and morphological characteristics
Linneus was the first to do this in the 17th century
Darwin came later and spoke on evolution
But both these scientists knew nothing about DNA or they lacked the tools to examine it
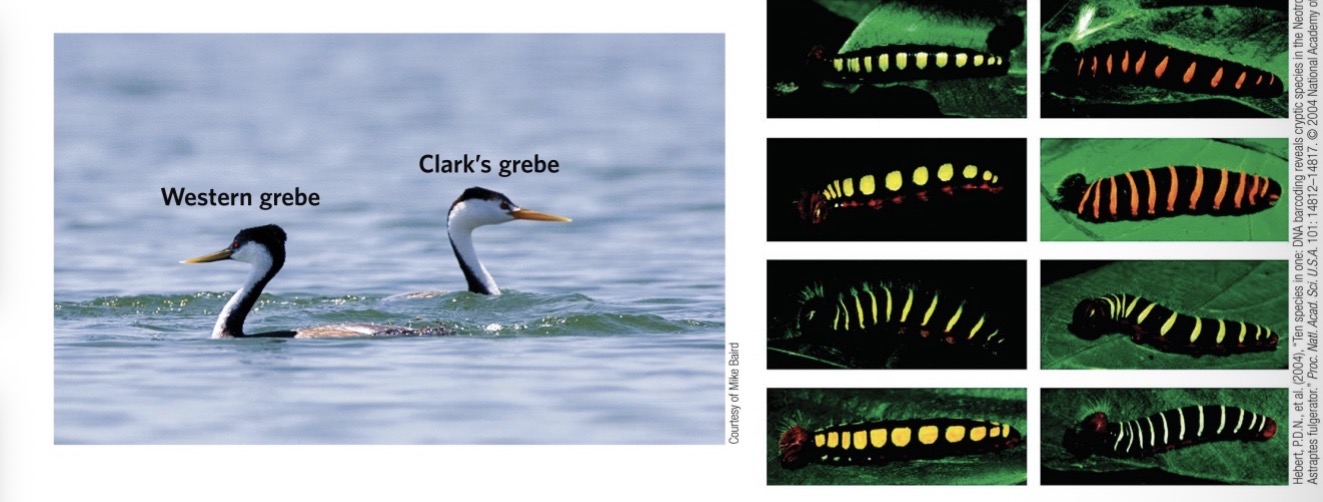
This often led to morphs of a single species being described as separate species.
“These things look really different so they are different species “
Ex. These 2 birds do not interbreed, but they look to be part of the same species when in reality they are not
Biases exist with respect to which species are studied.
Every scientists gets to decide what is interesting to them
This impacts what gets studied and what doesn't get studied
Biases exist with respect to which ecosystems are studied.
Deep sea requires expensive equipment and certain skills that maybe not everyone has.
Rainforest is more convenient to study because you can just walk around and observe with no equipment needed to start
Many species are hard to find and researchers are limited by logistic, time, and funding constraints
In a big forest, there are so many things hiding that will not catch our attention → not studied as well as big noticeable or flashy species
Many species are going extinct before they are described.
Usually because of human activity
Hunted to extinction
Loss of habitat because of deforestation
Reminds us of mass extinction when meteor hit earth, changed the climate, so dinosaurs went extinct
We are in the middle of 6th mass extinction in recent history of this planet. Due to anthropogenic influences, a recent study found that 48% of species have a declining population and only 3% have increasing populations. 33% of species currently classified as non-threatened are declining
Determining Species Richness & Community Composition
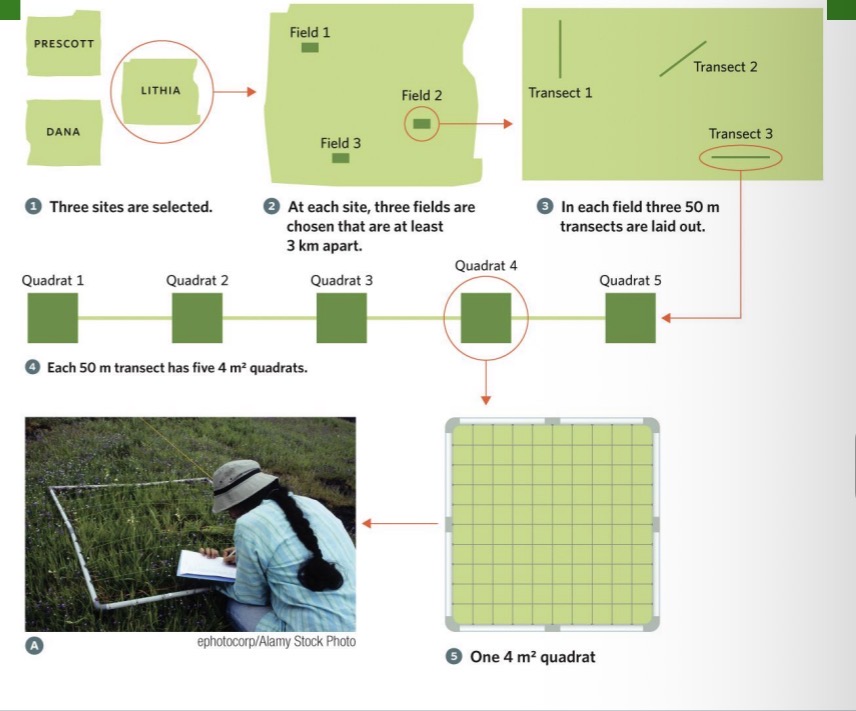
Determining which species are present in a community can be challenging; recording all species in a community is typically impossible
Sampling techniques for determining community composition are similar to those discussed in Lecture 4 for populations, such as sampling plots, line transects, and camera traps.
Species-Abundance Relationships
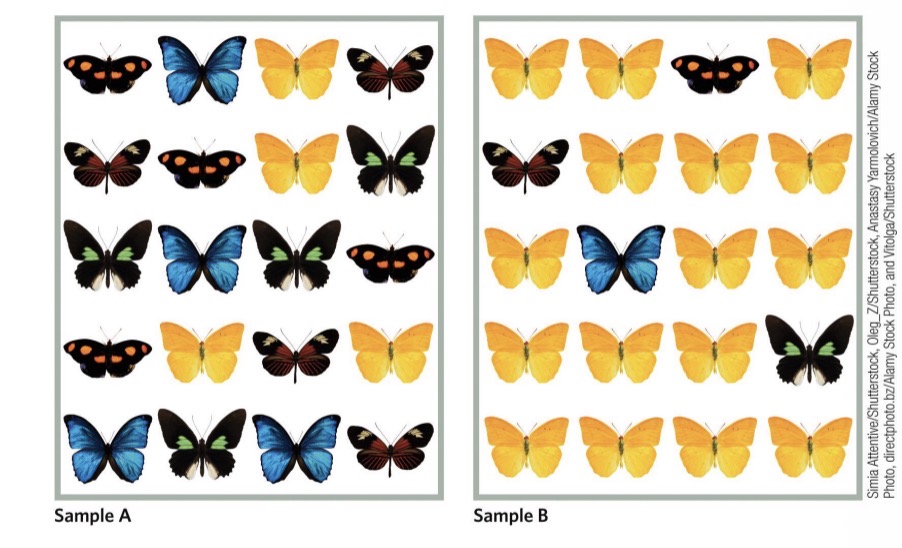
Sample A: equal chance that I will encounter all of the species in a short period of time
Species B: might not encounter the blue butterfly because there are so many yellow and not as many of the other species
So how do we say this community consists of all 5 species in both samples, if in B it is unlikely that I sample everyone
Rarity imposes challenges for sampling, as rare species are rarely sampled and may, thus, be missed when documenting community composition
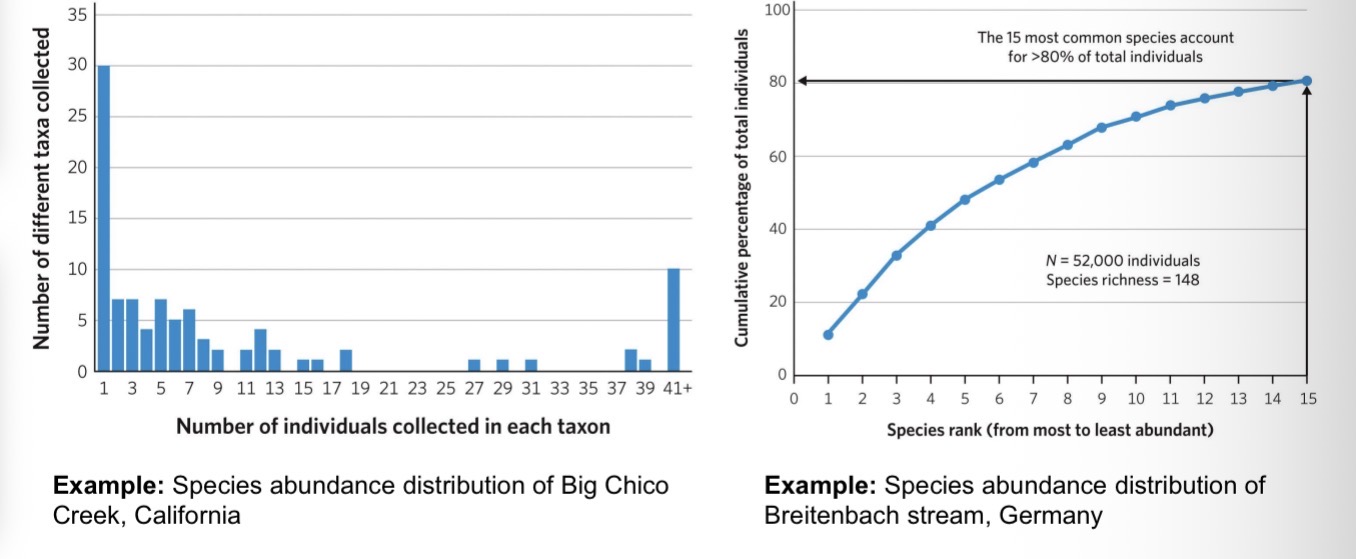
In most communities,
a few species account for most individuals; most species can be considered rare.
The struggle is with the rare species: I will find a common butterfly, but will I also find a rare one
Rarity imposes substantial challenges on sampling
Efforts are limited by time, logistic, and financial constraints, so researchers need to determine how much sampling effort to expend in a given area.
Given that we cannot sample every individual in a community, and given that we do not know the true state of a community, how do we know when our sampling efforts have captured a community’s species richness and composition adequately
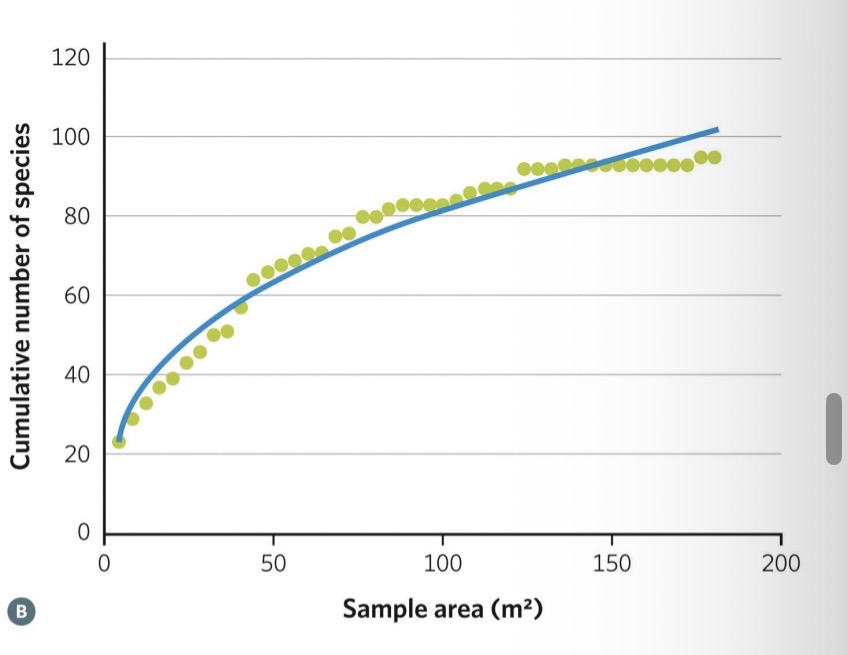
Species accumulation curves
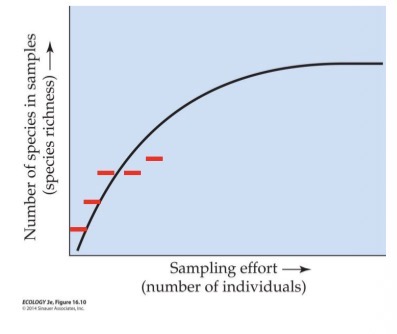
Species accumulation curves
describe how the number of species that were identified increases with the number of individuals sampled.
They are initially steep but then level off once most species have been identified (the more you sample, the less likely it is that you see something new).
Levelling off of the species accumulation curve can indicate adequate representation of the community in the samples.→ confidence you have sampled everything, nothing new left to find
Species-Area Relationships
Similarly to how we are unable to sample every individual in a community, we are also unable to sample every area of an ecosystem.
Hierarchical sampling designs
collecting data at multiple spatial scales at randomly chosen locations allows understanding how community composition might vary across different areas.
Species-area relationships suggest that the number of species that are found will
increase with the area that is sampled: steeply first, and then more slowly as the probability increases that sampled species have already been observed in previous areas
Species-area relationships can typically be described using a power function
S = cA^z
or equivalently, its log-log transformation log S = log c + z log A
where
A = area
S = number of species in the area
c = avg. number of species per unit area
z = slope of log-log transformed species- area relationship (informing on how quickly new species are accumulated when new areas are added)
Log-log transformation of power function causes
Linear relationships between the log of the area and the log of the species
This linear relationships allow you to estimate slope (z) and intercept (c)
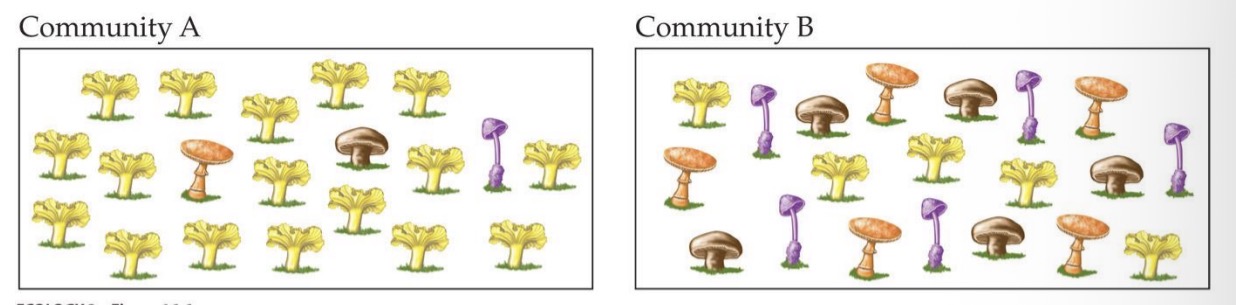
Which of these communities would you consider to be more diverse?
Both are equally diverse because both have 4 species
species richness is four in both communities, but community B is considered more diverse because of a higher species evenness.
Two communities may have the same species richness (the number of species in a community), but differ in their composition.
Enter species evenness
Species evenness
describes how evenly individuals are spread among species by considering the relative abundances of each species compared to one another.
species richness
the number of species in a community
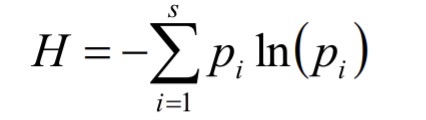
The Shannon-Wiener Diversity Index (ON THE EXAM, DO AN EXAMPLE FROM TEXTBOOK)
is a commonly used summary metric for species diversity.
It incorporates both species richness and species evenness.
S = number of species in the community
pi = proportion of individuals that belong to the ith species
Properties of the Shannon-Wiener Diversity index:
For a community that contains exactly one species, H=0.
For a fixed species richness (S), increasing evenness increases H.
For a fixed evenness (e.g., pi = 1/S for all species i), increasing species richness (S) increases H.
A higher H indicates a higher diversity, accounting for both richness and evenness.
A higher H indicates a higher diversity, but it does not inform on whether this is because of high richness or evenness.
The Shannon-Wiener Diversity Index can indicate which
communities are more diverse than others (higher H).
Rank abundance curves
which plot the proportional abundance of each species (pi) relative to the others in rank order
can be used to understand whether differences in diversity are due to differences in species richness, evenness, or both.(useful because we can’t just tell from the Shannon-Wiener Diversity Index Value)
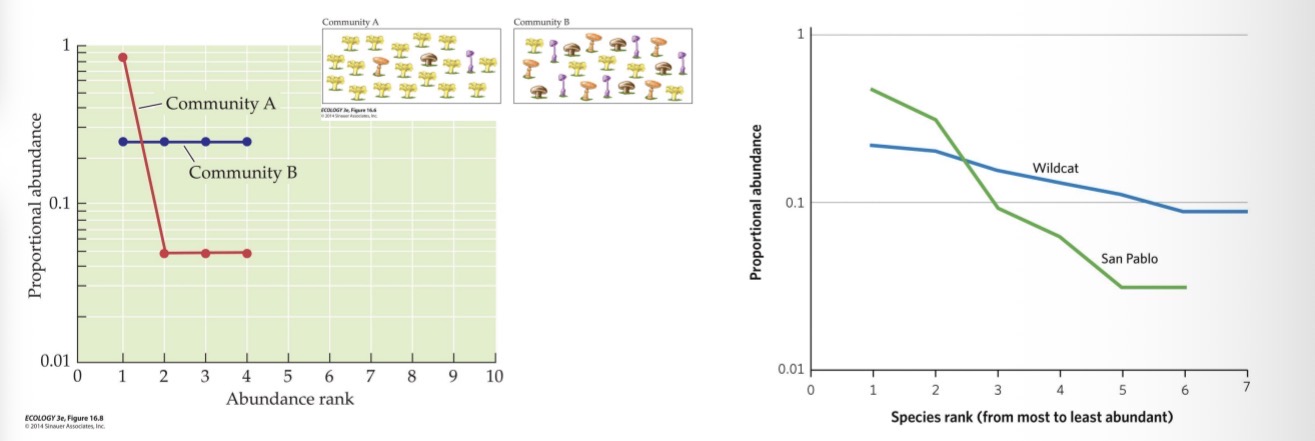
The length of a rank abundance curve indicates
species richness
steepness of a rank abundance curve indicates
evenness
Shallower slope on rank abundance curve means species is
More even
Longer line on abundance curve means
There are more species (increased species richness)
Summary metrics, such as the Shannon-Wiener Diversity Index, can be useful for summarizing and comparing key characteristics of communities.
However, two communities could have identical species richness and evenness but completely different species compositions and functions
It matters which species are present in a community; simply tallying up species richness / evenness might miss key details
Seven Forms of Rarity

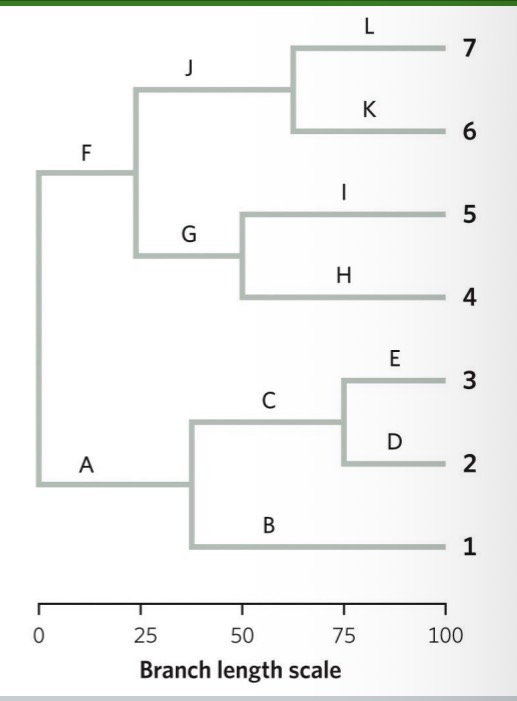
Phylogenetic trees
graphically depict the evolutionary relationships among a set of species.
The length of branches on phylogenetic trees typically represent
the time since evolutionary divergence from the previous node
Loosing something with longer evolutionary history is more significant than newer species with shorter branches
Phylogenetic diversity (PD)
can be measured by adding up all branch lengths within a phylogeny to create a single number that can be compared across locations and through time.
A set of species that are evolutionarily very different from one another will have a higher or lower PD score that a set of closely related species
Higher
Evaluating experimental data on the thermal sensitivity of the development of helminths (parasitic worms) for 87 species revealed
that thermal sensitivities were systematically influenced by phylogenetic relationships: related species tended to have similar thermal sensitivities, indicating that some helminth taxa are inherently more affected by rising temperatures than others
Using phylogeny allows us to make conclusions
Instead of saying “species x is temp sensitive” we can say “species x and all its relatives are temp sensitive” regardless of whether or not we have studied them
Human-linked prehistoric extinctions
resulted in a loss of two billion years of evolutionary history among mammals; an additional loss of another 500 million years of evolutionary history is expected through recent extinctions.
Example: Past and expected future losses of phylogenetic diversity in mammals through extinctions
Functional traits
are characteristics of species that describe their ecological roles in a community.
Example: Functional traits of plants are often defined based on their morphology (e.g., woodiness, leaf characteristics, height) and on how they contribute to forest canopy structure
Functional diversity dendrograms
graphically depict the relationships among a set of species in terms of their functional traits.
Adding up the length of all branches produces a metric that can be regarded as an estimate of a community’s functional diversity (FD), as measured through functional richness (the number of traits present in a community) and functional evenness (the proportion of individuals in each functional group
Ex. Loosing all of A, B, C, D, E is worse than if I lost D, H, and K, because there are still other species that exist with those functions
Species richness and other metrics may vary across habitats within an ecosystem, with
heterogeneous habitats holding more species than homogeneous habitats.
Species richness across different habitats can be described using
α-, β-, and γ-diversity
γ-diversity:
species richness across a region made up of smaller localities
Across the entire region
It is the total number of species found across all habitats combined.
α-diversity:
the average number of species found within small, local-scale habitats in a region
Within a habitat
It is the average number of species in a single local site.
β-diversity:
a measure of heterogeneity of community composition among localities. β-diversity can be defined in many ways; one of the most common definitions is β = γ / α
Two Ways to Get High γ-Diversity
High α-diversity (many species within each habitat)
Habitats are similar to each other but each contains lots of species.
β-diversity is low because there is little turnover between habitats.
High β-diversity (big differences between habitats)
Habitats contain different sets of species.
Even if α is low, high species turnover produces a high γ.
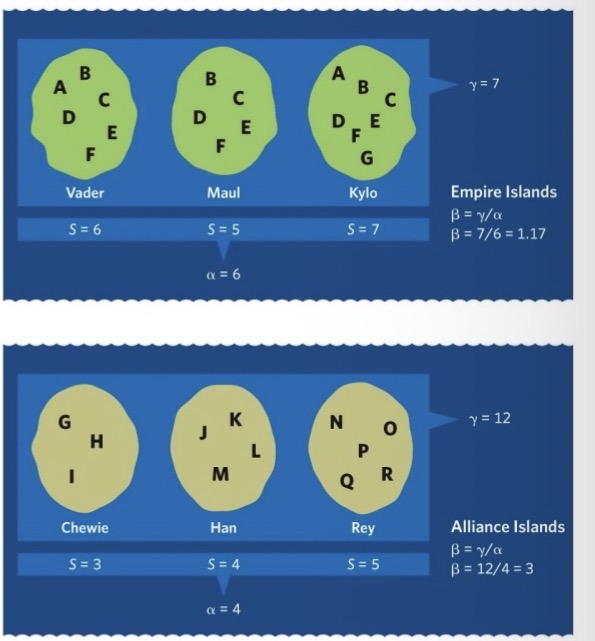
Example 1 (Top Image: Empire Islands)
γ = 7 species total
Habitats are very similar (lots of overlap).
α = 6, meaning habitats have many species each.
β = γ / α = 7 / 6 = 1.17 → low turnover
High γ comes mostly from high α, not β.
Example 2 (Bottom Image: Alliance Islands)
γ = 12 species total
No overlap between habitats (each has unique species).
α = 4 (few species per habitat).
β = γ / α = 12 / 4 = 3 → high turnover
High γ comes from high β-diversity, not α.
Think – Pair – Share: Biodiversity Loss : why do i care about loosing species
biodiversity maintains ecosystem stability and human well-being. Species support essential services like pollination, nutrient cycling, water purification, and food production. Losing species reduces ecosystem resilience, threatens economies and human health, and results in irreversible loss of evolutionary history
What hold the largest biodiversity among terrestrial biomes
Tropical rainforests
What hold the largest biodiversity among aquatic zones
tropical coral reefs
Trends in phylogenetic diversity tend to be similar to those in species richness.
More species near equator, and less species as you go further from equator
Differences between the two (e.g., areas with comparatively low species richness but high phylogenetic diversity) can indicate
hotspots of evolutionary diversity (e.g., due to long and unique evolutionary histories).
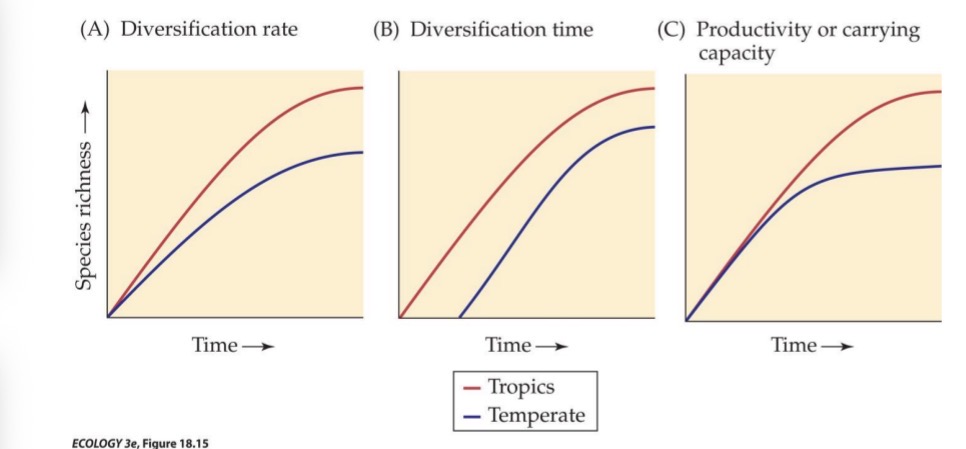
Many hypotheses have been proposed for explaining the observed latitudinal gradients in diversity, including differences between lower and higher latitudes in
(A) diversification rate
(B) diversification time
(C) primary productivity.
Diversification Rate
Hypothesis 1: Species diversity is largest in the tropics because the tropics have a higher species diversification rate than higher-latitude areas: large, thermally stable areas result in larger population sizes and larger population ranges, which decreases each species’ extinction risk and increases the rates of speciation

Diversification time
Hypothesis 2: Species diversity is larger in the tropics than in higher-latitude areas because the tropics have been climatically stable for longer periods of time, thus giving species more time to evolve.
In fact, it has been hypothesized that many species that are found elsewhere also originated in the tropics and then dispersed from there.
Last ice age in Canada was 10 000 yrs ago, but Brazil never had an ice age. So while Canada was covered in ice, Brazil was continuing in a thriving ecosystem where more variety of species could exist

Primary productivity
Hypothesis 3: Species diversity is larger in terrestrial tropical systems than in temperate ones, because terrestrial productivity is generally highest in the tropics: high productivity promotes higher carrying capacities and thus larger population sizes and decreased extinctions risks
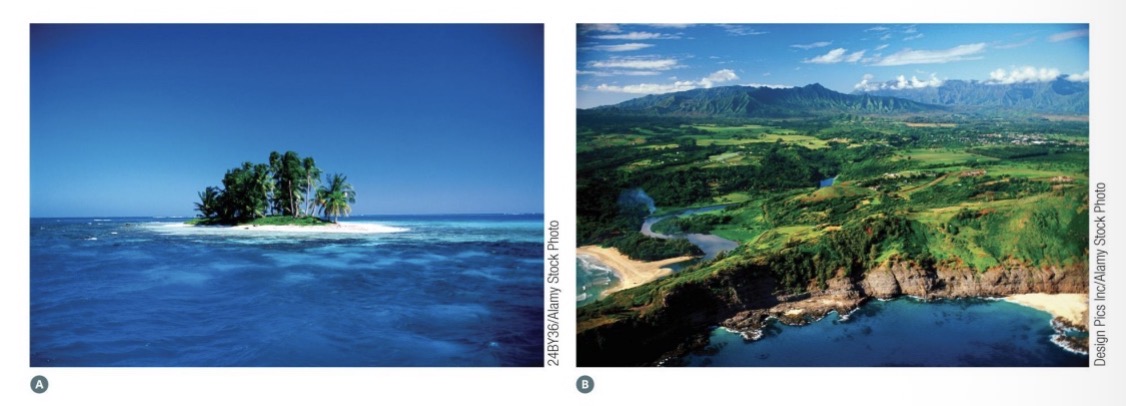
On which of these islands would you expect to find more species
B because islands that are close to mainland and large will have more species
How does the size of an island correlates with the number of species it harbors.
Positively
Larger the island = more species you would find
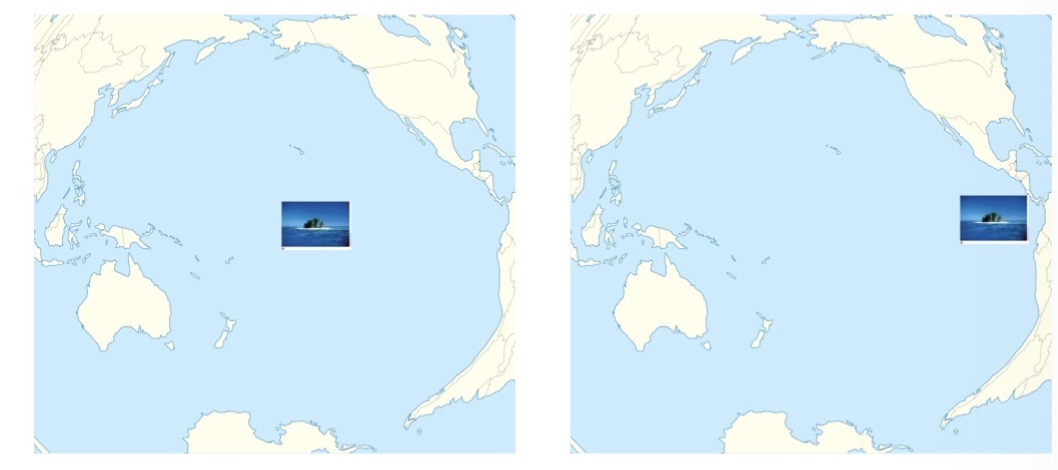
On which of these islands would you expect to find more species?
Right hand one because it is closer to the mainland
The closer an island is to the mainland, the higher the colonization rate, because species can disperse there more easily than to distant islands.
How does the distance between an island and the mainland correlates with the island’s species richness
negatively
Farther an island is from mainland = less species
The Equilibrium Theory of Island Biogeography
suggests that the number of species on an island depends on how immigration rates and extinction rates balance against one another.
No new species is created through evolutions of a species
Rates of immigration:
The theory assumes that ecological timescales are much faster than evolutionary timescales, so that the rate of new species arrivals on an island is primarily driven by immigration from somewhere else, rather than by speciation on the island.
Species richness increases when a new species that is not present on the island arrives; the rate of increase at which new species arrive slows when the island’s species richness is high, as many arrivals are already present on the island
The remoteness of an island influences immigration rates: higher immigration rates for islands that are closer to a source of species, such as the mainland
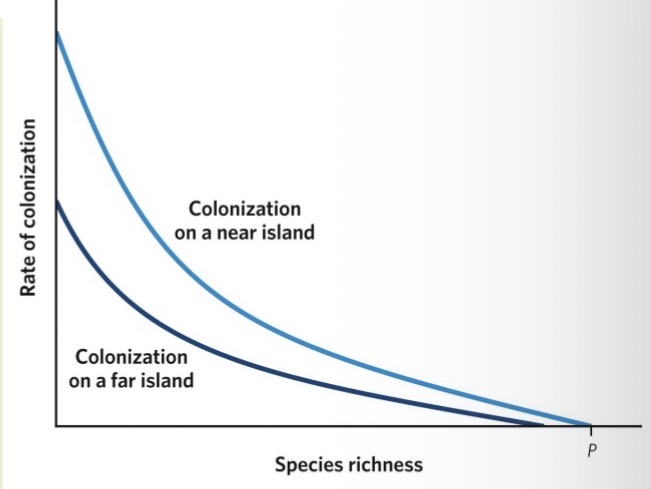
Rate of immigration is larger for
Islands with few species
Empty island because it doesn't matter who comes to the island, that species is new to island
Rate of immigration smaller for
Island with already many species
already colonized islands because rate of increase at which new species arrive slows when the island’s species richness is high, as many arrivals are already present on the island
Rates of extinction:
Higher species richness results in higher extinction rates because (a) more species can go extinct when more species are present; and (b) higher species richness leads to increased competition for limited resources, leading to smaller population sizes and higher extinction probabilities for each species.
Island size influences extinction rates: higher extinction rates for smaller islands because increased resource limitation leads to smaller population sizes and higher extinction probabilities for each species.
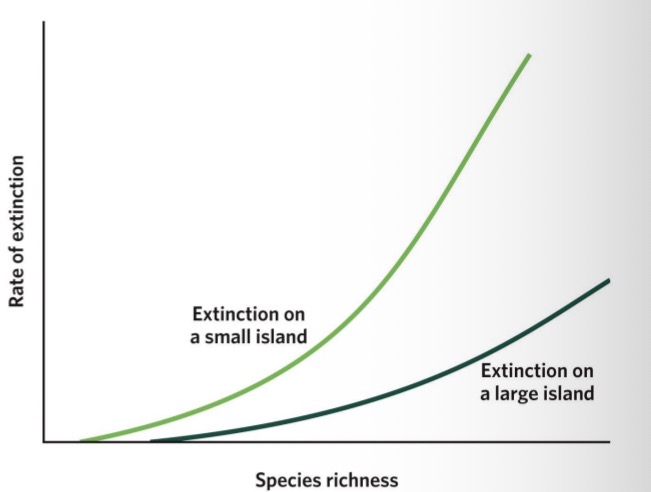
Extinction rate increases
The more species you have
Putting the 2 graphs together
The equilibrium number of species on an island occurs where immigration and extinction rates balance exactly.
Look at combinations (for example, colonization on near island that is large), look where two curves intersect = that gives me largest number of species
Small island on far : smaller species richness
The model predicts that species richness will be highest on large islands near to the mainland, and smallest on small islands far from the mainland
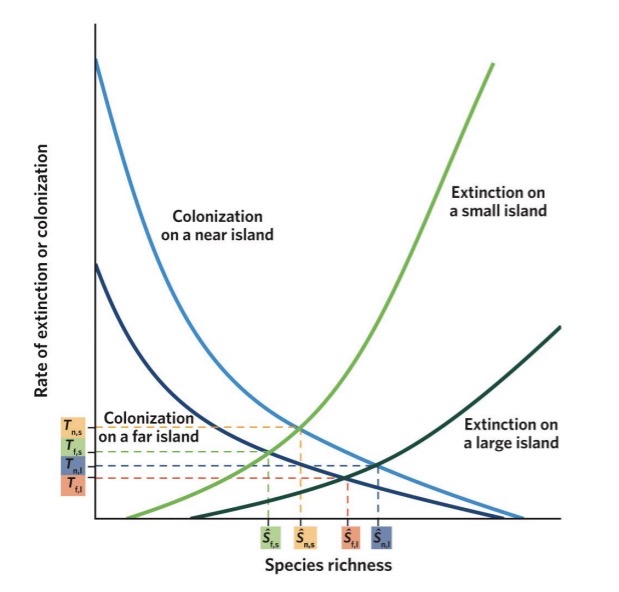
species richness will be highest on
large islands near to the mainland
species richness will be smallest on
small islands far from the mainland
Turnover rates are predicted to be largest on
small islands near the mainland
Turnover rates are predicted to be smallest on
large islands far from the mainland
Turnover rates
the rates at which newly colonizing species replace newly extinct species