Stat 250 Final Exam
1/46
There's no tags or description
Looks like no tags are added yet.
Name | Mastery | Learn | Test | Matching | Spaced | Call with Kai |
|---|
No analytics yet
Send a link to your students to track their progress
47 Terms
Case
smallest unit on which data are measured/recorded
Variable
characteristic that is measured or recorded and can vary
The _______ variable explains, predicts, or influences the _____ variable
Explanatory, response
___________ sampling is required for generalization, _____________ is required for association to imply causation
random sampling; randomization of treatments
Categorical data: 2 Types
Names, labels, categories we call "levels"
Nominal: no ordering
Ordinal: some ordering
Sampling bias is bias due to
the methods employed to obtain the sample
Bias = a systematic favoring of certain outcomes
i.e. the sample is NOT representative
Observational Study
uncontrolled; researcher does not control either variable, just collects and records data; can have confounding variables; can infer association but not causation- association does not imply causation
Confounding Variable
can be a problem; varies between cases and is related to both the explanatory and response variables
Experimental Study
controlled; researcher controls the value/level of the explanatory variable and measures the response; if randomization is used, confounding is not a problem; CAN infer causation when an association is found
If data was selected In random units, you _______ generalize to population
CAN
If there was a random assignment of treatments, causality _______ can be concluded
CAN
If there was NOT a random assignment of treatments, only _____ not _____ can be concluded
association; not causation
Charts to use when summarizing s categorical variable
Visualizations:
Bar chart, pie chart, table
Statistics:
counts, proportion/risk, odds
Charts to use when summarizing two categorical variables
Visualizations:
side-by-side bar charts, stacked bar charts, two-way table
Statistics:
difference in proportions, conditional proportions, relative risk, odds ratio
Charts to use when summarizing a quantitative variable
Visualizations:
dot plot, histogram, box plot
Statistics:
mean, median, mode (center), standard deviation, variance (spread), range, IQR (spread), percentile/quartile
5 number summary: min, Q1, median, Q3, max
When skewed LEFT, the mean is...
to the LEFT of the median
When skewed RIGHT, the mean is...
to the RIGHT of the median
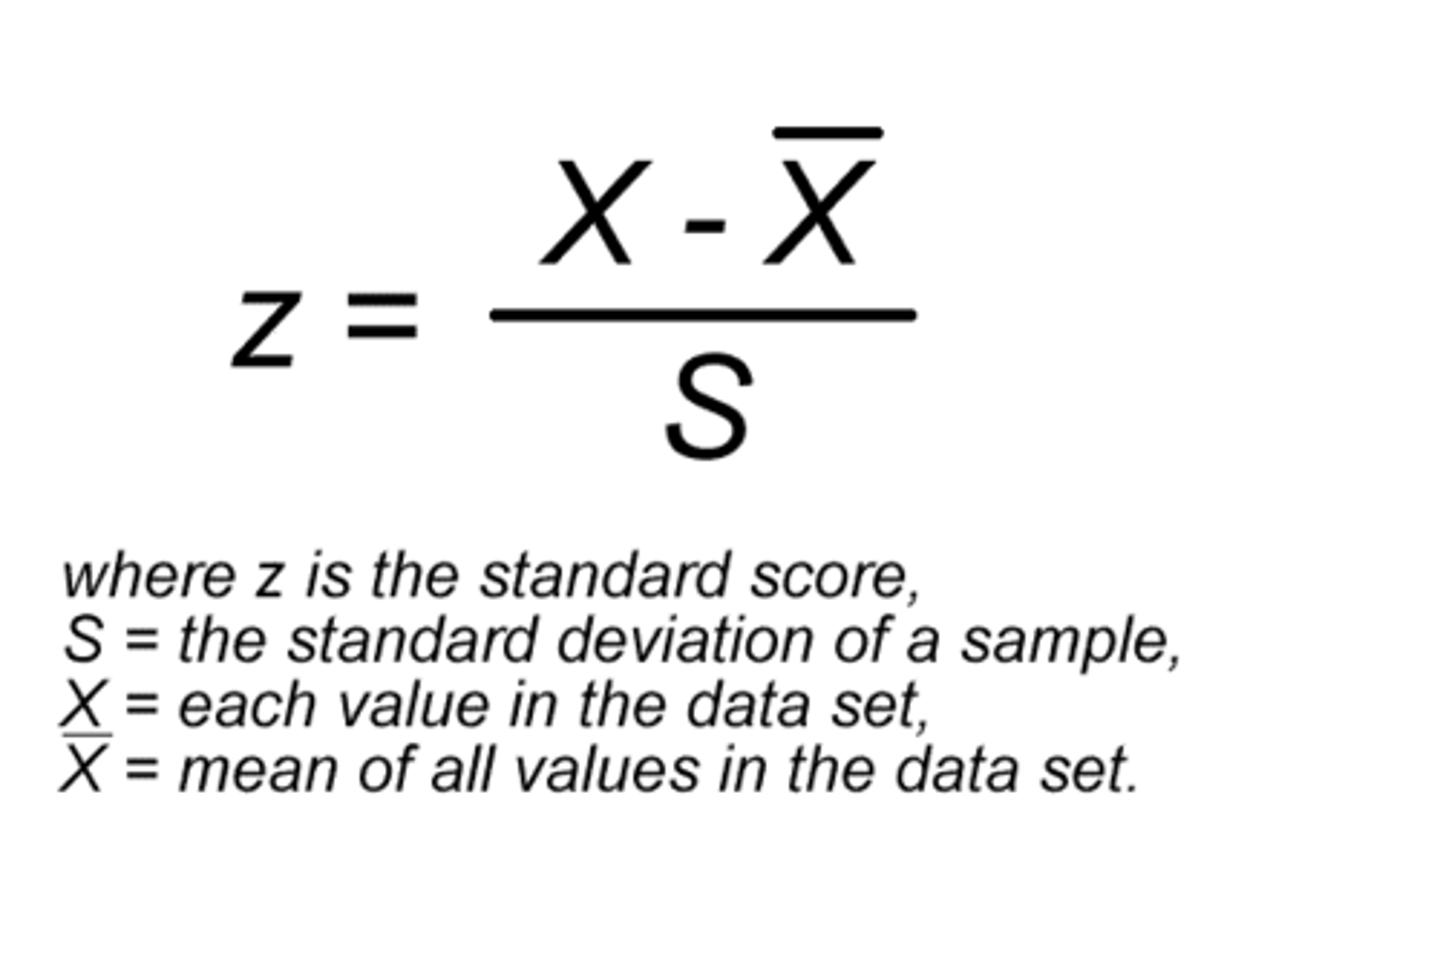
Z-scores are a measure of
distance from the mean in terms of "standard deviations"; puts values on standardized scale for comparison; meaningful for bell-shaped distributions
Z-score equation
Empirical Rule
95% of the data lies within 2 SD of the mean: +/- 2(SD)
Summarizing a quantitative response, categorical explanatory
Visualizations:
side-by-side box plots, side-by-side dot plots, side-by-side histograms
Statistics:
difference in means
Summarizing two quantitative variables
Visualizations:
scatterplot
Statistics:
correlation
regression/slope
Interpreting a scatterplot/correlation
Direction: positive or negative
Form: linear or nonlinear
Strength: no relationship, weak, moderate, or strong
Outliers?
Point estimation
estimate the value of a parameter using a single value - the sample statistic
Interval estimation
take into account uncertainty by creating an interval estimate in which we expect the parameter to lie
Hypothesis testing
determine whether the evidence supports a theory or hypothesis about a parameter
Statistic vs Parameter
we want to make inferences about a __________ using a __________
population parameter; sample statistic
Paired data vs Independent (2 groups)
Paired data = observations/cases from groups can be matched or paired together meaningfully; EX: do teenagers consume more sugar on average than their parents? (samples of teenager-parent pairs)
Independent sample = observations in the two groups are unrelated to one another and are not matched in any meaningful way
EX: does a teenager consume more sugar on average than an adult? (two independent samples of teenagers and adults)
Sampling Distribution
the distribution of a sample statistic
Standard error
standard deviation of the sampling distribution
Bootstrapping
sample with replacement from the original sample, using the same sample size
Resampling method
Calculate the statistic for each one, create a dot plot to estimate the sample distribution, and then use the same procedure as before: find the standard error by calculating the standard deviation of the sampling distribution, then plug that into the Cl formula.
Interval estimate: SE method
An interval provides plausible range of values for the parameter: for a 95% Cl
Point estimate +/- Margin of error (2 x bootstrap SE)
Point estimate
approximates the population parameter
Margin of Error
reflects the precision/uncertainty of the point estimate and determines the width of the interval (larger sample size (n) = narrower Cl)
When you increase sample size...
Precision?
Variation?
SD?
Increases precision, less uncertainty in population parameter
Less variation between sample statistics/bootstrap statistics
Smaller Standard error and narrower Cl
Confidence interval: percentile method
for a p% confidence interval, keep the middle p% of bootstrap statistics
We are [x] confident that the [x] [x] is between [x] and [x]
we are [confidence level] confident that the [true population parameter] [in context] is between [lower limit] and [upper limit]
Writing hypotheses:
Ho is the NULL HYPOTHESIS
no effect or difference = always contains an equality sign (=)
Writing hypotheses:
Ha is the ALTERNATIVE HYPOTHESIS
the claim for which we seek significant evidence = contains an inequality sign (>,<, not equal to) based open the claim
Hypotheses are always about _______, not sample statistics
population parameters
P-value
the probability of obtaining a sample statistic as extreme (or more extreme than the observed sample statistic, assuming Ho is true
if the p-value is < a (significance level)
unlikely sample to obtain
suggests that Ho is NOT true
REJECT Ho
statistically significant
evidence DOES support your claim (Ha)
if the p-value >/= a (significance level)
reasonably likely sample to obtain
suggests Ho may be true
do NOT reject Ho
NOT statistically significant
evidence does NOT support your claim (Ha)
Bootstrapping vs. Randomization: main difference
the main difference is a randomization distribution assumes Ho is true, while a bootstrap does not
Type 1 error
false positive`
Type 2 error
false negative