Operations MGMT Final Quizzes 11 16 13
1/29
There's no tags or description
Looks like no tags are added yet.
Name | Mastery | Learn | Test | Matching | Spaced |
|---|
No study sessions yet.
30 Terms
The standard normal distribution has a mean of one and a standard deviation of zero.
True
False
False
________ is a measure of the dispersion of random variable values about the expected value or mean.
Standard deviation
Sample mean
Population mean
Expected value
Standard Deviation
The area under the normal curve represents the probability, and the total area under the curve sums to:
A) 0
B) 0.5
C) 1
D) 2
1
The ________ and variance are derived from a subset of the population data and are used to make inferences about the population.
A) population variance
B) population standard deviation
C) population mean
D) sample mean
Sample mean
Under the normal curve, the area between z = 1 and z = -2 includes approximately ________ of the values.
A) 98%
B) 95%
C) 85%
D) 82%
82%
For the normal distribution, the mean plus and minus 1.96 standard deviations will include what percent of the observations?
A) 84%
B) 90%
C) 95%
D) 97%
95%
The weight of a jar of jelly is normally distributed with a mean of 16 oz and a standard deviation of 0.02 oz. What is the probability that a jar of jelly contains less than 16 oz?
A) .1915
B) .3085
C) .5000
D) .7257
.5
For some values of Z, the probability that a standard normal variable is below Z is 0.3783. The value of Z is:
A) -0.81
B) -0.31
C) 0.82
D) 1.55
-0.31
When we use the chi-square test for normality, the observed frequency for each group should be at least 5.
True
False
False
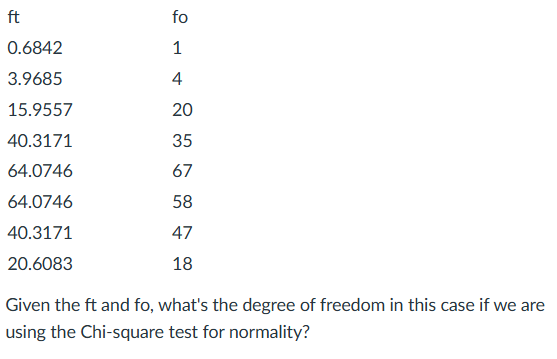
3
Carrying costs include storage costs, interest, and depreciation.
True
False
True
Ordering costs include transportation, shipping, and inspection.
True
False
True
Shortage costs include loss of customer goodwill.
True
False
True
If order quantity is increased, annual holding cost ________, annual order cost ________, and change in annual total cost ________.
decreases, increases, is positive
decreases, increases, cannot be determined
increases, decreases, is negative
increases, decreases, cannot be determined
increases, decreases, cannot be determined

The diagram above represents which type of inventory model?
Economic Order Quantity (EOQ)
EOQ with Noninstantaneous Receipt
Fixed Period Model
EOQ model with shortages
EOQ with Noninstantaneous Receipt

The slope of the line labeled "B" in the diagram is
rate of inventory demand.
production rate.
shipping rate.
production rate minus rate of inventory demand.
production rate minus rate of inventory demand.

The slope of the line labeled "A" in the diagram is
order rate.
rate of inventory demand.
production rate.
production rate minus rate of inventory demand.
production rate.
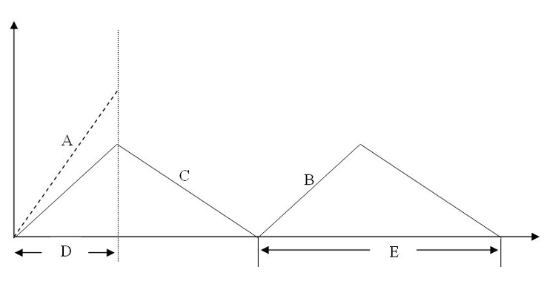
The slope of the line labeled "C" in the diagram is
order rate.
rate of inventory demand.
production rate.
shipping rate.
rate of inventory demand

The interval labeled "E" in the diagram is
production cycle.
production run length.
shipping lead time.
inventory fill rate.
production cycle.
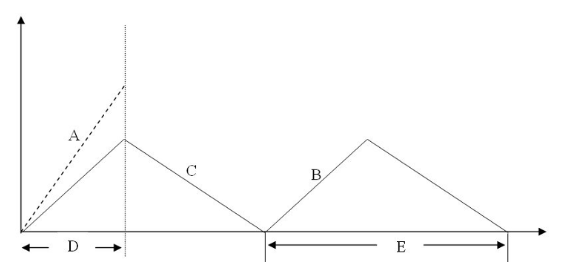
The interval labeled "D" in the diagram is
production cycle.
order receipt period.
shipping lead time.
inventory fill rate.
order receipt period.
The calling population is the source of customers.
True
False
True
The service rate is the average time it takes to serve a customer.
True
False
False
The basic single-server queuing model assumes an infinite calling population.
True
False
True
All single-server queuing models require the utilization factor to be less than 1.
True
False
True
In the basic single-server waiting line system, we assume the arrival rate follows a/an ______ distribution, and assume the service time follows a/an _______ distribution.
Normal, Normal
Poisson, Exponential
Poisson, Constant
Normal, Constant
Poisson, Exponential
If it takes 5 minutes to serve a customer at a fast food restaurant the service rate is ________customers/hour.
12
The arrival rate is the
time between arrivals to the service facility.
rate items arrive at the server after being in the queue.
rate of arrivals to the service facility.
time a customer spends in line.
rate of arrivals to the service facility.
Queuing discipline refers to
the reason waiting occurs in underloaded systems.
the order in which customers are processed.
the willingness of customers to wait in line.
how constant the interarrival times are.
the order in which customers are processed.
Constant service times occur with
machinery.
well-trained employees.
service processes.
assembly processes.
machinery.
A single-server queuing system has an average time between arrivals of 20 minutes and a service time of 10 minutes each. Assuming Poisson arrivals and exponential service times, the utilization factor is approximate:
0.25
0.33
0.50
2.0
0.5