Lecture 14: biosensors and liver function
1/33
There's no tags or description
Looks like no tags are added yet.
Name | Mastery | Learn | Test | Matching | Spaced | Call with Kai |
|---|
No analytics yet
Send a link to your students to track their progress
34 Terms
Liver Disease in Europe
29 million people in Europe have chronic liver disease
Cirrhosis = 170,000 deaths/year
1.8% of all deaths
Large variation across Europe
more prevalent in males
alcohol is a main cause of liver cirrhosis
liver disease is increasing
Liver disease causes premature death
•Liver disease is the 3rd biggest cause of premature (≤65 years) death in the UK
•Results in 62,000 years of working life lost each year
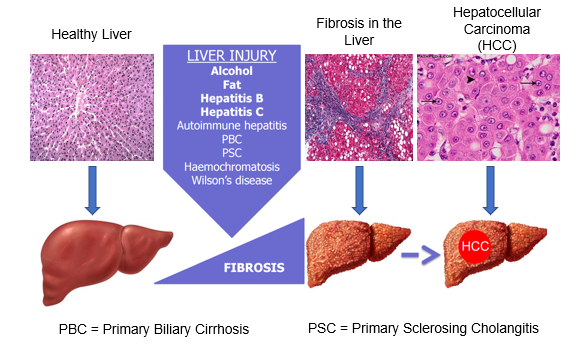
Natural history of chronic liver disease
Histology: large nuclei = metabolically active
Fibrosis is a commonality of liver injury
Fibrotic tissue is non functional and contracts to prevent blood supply to hepatocytes
HCC = hepatocellular carcinoma: primary tumour in liver
Progression of Cirrhosis
Compensated Cirrhosis:
The liver is severely scarred
but enough healthy cells in your liver to perform its functions adequately
Ascites: fluid build up in abdomen
Decompensated Cirrhosis:
liver is not capable of performing all of its normal functions, resulting in several complications
eg: fluid retention, varicies (blood vessels sag) and mental confusion from ammonium ions (encephalopathy)
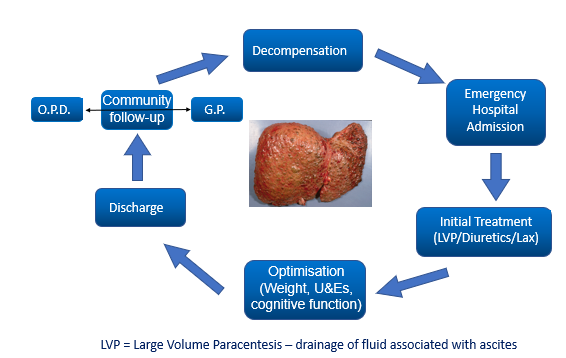
Decompensated cirrhosis can be unpredictable….
patient enter decompensation
emergency hospital admission
initial treatment (LVP/diuretics/Lax)
optimisation (weight/ U&Es/ cognitive function
Discharge
Community follow up (OPD or GP)

d-LIVER: Why? A clinical perspective
To use technology to move management of end-stage liver disease (ESLD) patients out of the clinic and into the home or near-home setting
To improve quality and length of life by dynamic management of complications (daily, not monthly)
To improve the quality of life for patients and carers by avoiding burdensome clinic visits
To reduce the cost of management by earlier cheaper intervention
NHS paying for taxis for patients
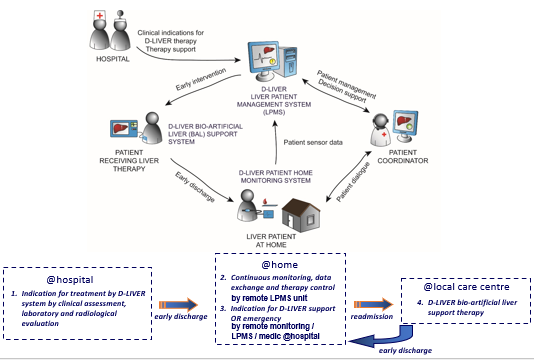
d-LIVER at home
monitor patient at home
chest monitor: heart rate, breathing rates
small box: biochemistry for liver function
data monitored by patient coordinator
Work Package 1:
clinical application senarios and validation
who benefits from this technique
The Challenge of Liver Disease
20,000 deaths per year in the UK
Only one of the 5 “big” killers increasing in impact
“Perfect storm” of obesity-related liver disease, alcohol and viral hepatitis
Impaired quality of life from encephalopathy/itch
must moniter bile salts
There is no primary therapy for liver failure
Current therapy transplant or support to recovery
500 transplants in the UK, 20,000 deaths per year
Acute on chronic liver disease is not an indication
No effective artificial bridge to transplant
The Concept of Bridging to Recovery
Liver has the capacity to recover and re-generate
take stressors away
bioreactor to carry out funtion of liver
Patient needs to survive long enough to benefit!
Loss of liver function is compounded by liver necrosis, leading to hypoperfusion, tissue necrosis and a death spiral
The concept is for early supportive therapy with d-LIVER system to break the spiral
Hasn’t This Been Tried Before?
yes but previous approaches were in acute liver failure late in the death spiral
Dliver aims to intervine before death spiral begins
Too great a hurdle to cross and failure inevitable
Current concept is early light touch intervention
D-LIVER Delivered by 4 scenarios
Chronic liver failure: – compensated liver become decompensated, treat "acute on chronic liver" failure, reduce intermittent encephalopathy, enable long-term therapy in the home environment and reduce the need for transplantation
Chronic cholestatic itch: – intermittent long-term therapy to reduce cholestatic itch, measure of bile salt lives, to extend the time before transplantation is inevitable, to improve quality of life
Bridging therapy before liver transplantation: – help liver regenerate itself, therapy for high-risk patients to reduce duration and incidence of hospitalisation and thus waiting-list mortality
Acute liver failure: – e.g. "small for size" syndrome to support liver function when resected liver proves insufficient, only one smaller functional liver unit is transplanted, so still can’t cope with metabolic demand
Work Package 8
progenitor cells for bioartificial liver
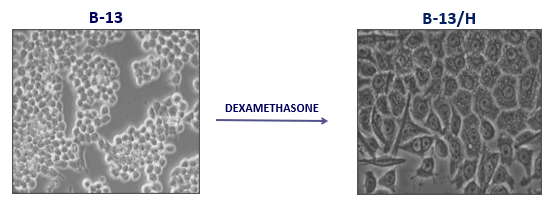
B-13 pancreatic cell
B-13 cell is the ideal cell type for a cell-based artificial liver support system.
B-13 – readily genetically manipulable and expandable rat progenitor cell.
Dexamethasone transforms them into functional hepatocytes (B-13/H) in vitro (unlike embryonic stem cells).
Effect of Dexamethasone
Gene expression
Inhibits pancreatic amylase expression, induces expression of the hepatocyte marker transferrin, and induces expression of markers typical of ductal cells
Phenotype
B-13/H cells express a variety of liver-enriched and liver-specific genes, many at levels similar to hepatocytes in vivo
Maintenance
B-13/H phenotype is maintained for at least several weeks in vitro
why not use stem cells?
their transformation is linear, difficult to make them stay at desired differentiation stage
How can you test B-13 for hepatocyte activity?
western blot of protein expression
increase conc of dexamethasone = increase in protein expression
monitor nitrocatechol production
longer incubation with DEX= increase in conc
3D Perfused Bioreactor
core = capillaries
outside of capillaries are B13 liver cells
blood from patient passes into bioreactor> cells remove waste
reduces metabolic load on liver, so liver can regenerate
work package 4:
blood biochemistry cartrige
parameters to measure in blood chemistry
amperometric (current) sensor: bilirubin (cholestatic itch)
impedimetric (resistance) sensor: albumin
potentiometric (ionic conc.) sensor: creatine, sodium, potassium
optical sensor: blood clotting time
microfluidic cartridge design
fingerprick of blood
clotting assay
blood is processed to serum
pump pressurises whole system, forces round to sensor cartriges
microfluidic cartridge requirements
Key Requirements
Low sample volume (20µl)
Integrating 6 sensors
Cheap and simple design
Sequential flow through
Microfluidic workflow
Additional Features
Serum extraction
Serum dilution
Advantages of microfluidics
Low fluid volume consumption
Faster analysis and response times due to short diffusion distances
System is compact
Parallelisation allows high-throughput analysis
Lower fabrication costs
Challenges of microfluidics
Detection principles may not always scale down
electrode SA
The absolute geometric accuracies and precision in microfabrication are high
work package 3
sensors development
Objective of WP3
The development and characterisation of physical and biochemical sensors for monitoring:
patient at home
bio-artificial liver support unit
4 physiological parameters:
Heart rate
Skin body temperature
Activity/Posture (alert if fallen over)
Blood pressure
6 biochemical parameters:
Electrolytes (sodium and potassium)
Small molecules (albumin, creatinine and bile acids)
Clotting time
Physiological sensors = worn by the patient = wearable sensors
Biochemical sensors= incorporated in microfluidic cartridge (WP4) and in the bio-artificial liver support unit (WP5)
Software and signal processing requirements = WP6
why do we need a d-LIVER Wearable Device
Develop a device for continuous, ambulatory measurements of vital signs for early detection of patient exacerbations.
Main usage scenarios: Intermittent measurements during shorter time sequences (days, weeks, months), such as assessing medical intervention effects.
Establish a baseline at the start of a new treatment programme
Lifestyle change, outcome assessment and patient motivational tool (lifestyle changes such as exercise, substance abuse, diet, etc.).
Assessment of the effect of medication adjustments.
Monitoring requested by medical personnel for patient status assessment.
Target measurement parameters
• Heart rate
• Heart rate variability
• Skin temperature
• Activity level
• Step Counter
• Upper body posture
• Pulse transit time
Blood Pressure Derived from Pulse Transit Time
Pulse Transit Time (PTT) = The time is taken from the heart valve’ until the blood pressure wave reaches the periphery.
PTT depends on blood pressure: higher pressure = shorter PTT.
Sensors used:
Electro Cardiography (ECG): detects heartbeat start impulse
Impedance Cardiography (ICG): detects opening of the aortic valves
Photo Plethysmo Graphy (PPG): detects peripheral pressure wave
Communication Configuration
data sent to Liver Paitient Management System (LPMS)
clinician given data in bar graphs, easy to interpret
can set alarms to paramaters
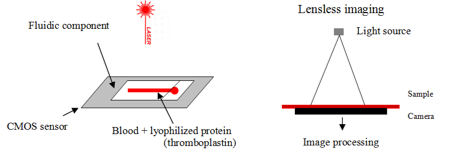
Blood clotting analysis
Complementary metal-oxide semiconductor (CMOS) sensor where the fluidic component is put
The sample fills the channel by capillarity
capillary contains clotting agent: thromboplastin, to initiate clotting cascade
A laser source illuminates the blood sample and RBC diffuse light.
A moving diffraction picture is formed on the CMOS sensor called speckle diffraction.
When the blood clots, the movement stops
clottiing only occurs if all the factors produced by the liver are present
Clotting is then detected.

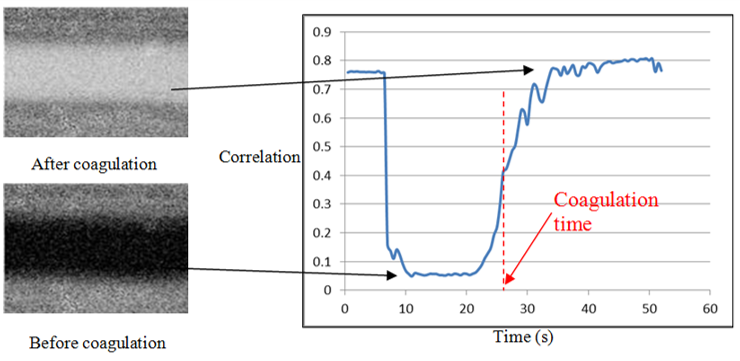
Blood clotting data analysis
A picture generates a correlation factor that is 0 where the cells are moving (before coagulation) and 1 when the cells stop (after coagulation).
Pictures movements changes are illustrated by a colour change.
Sample goes from black to white when coagulation occurs.
Clotting time is detected by the sudden changes in the slope value of the correlation factor curve
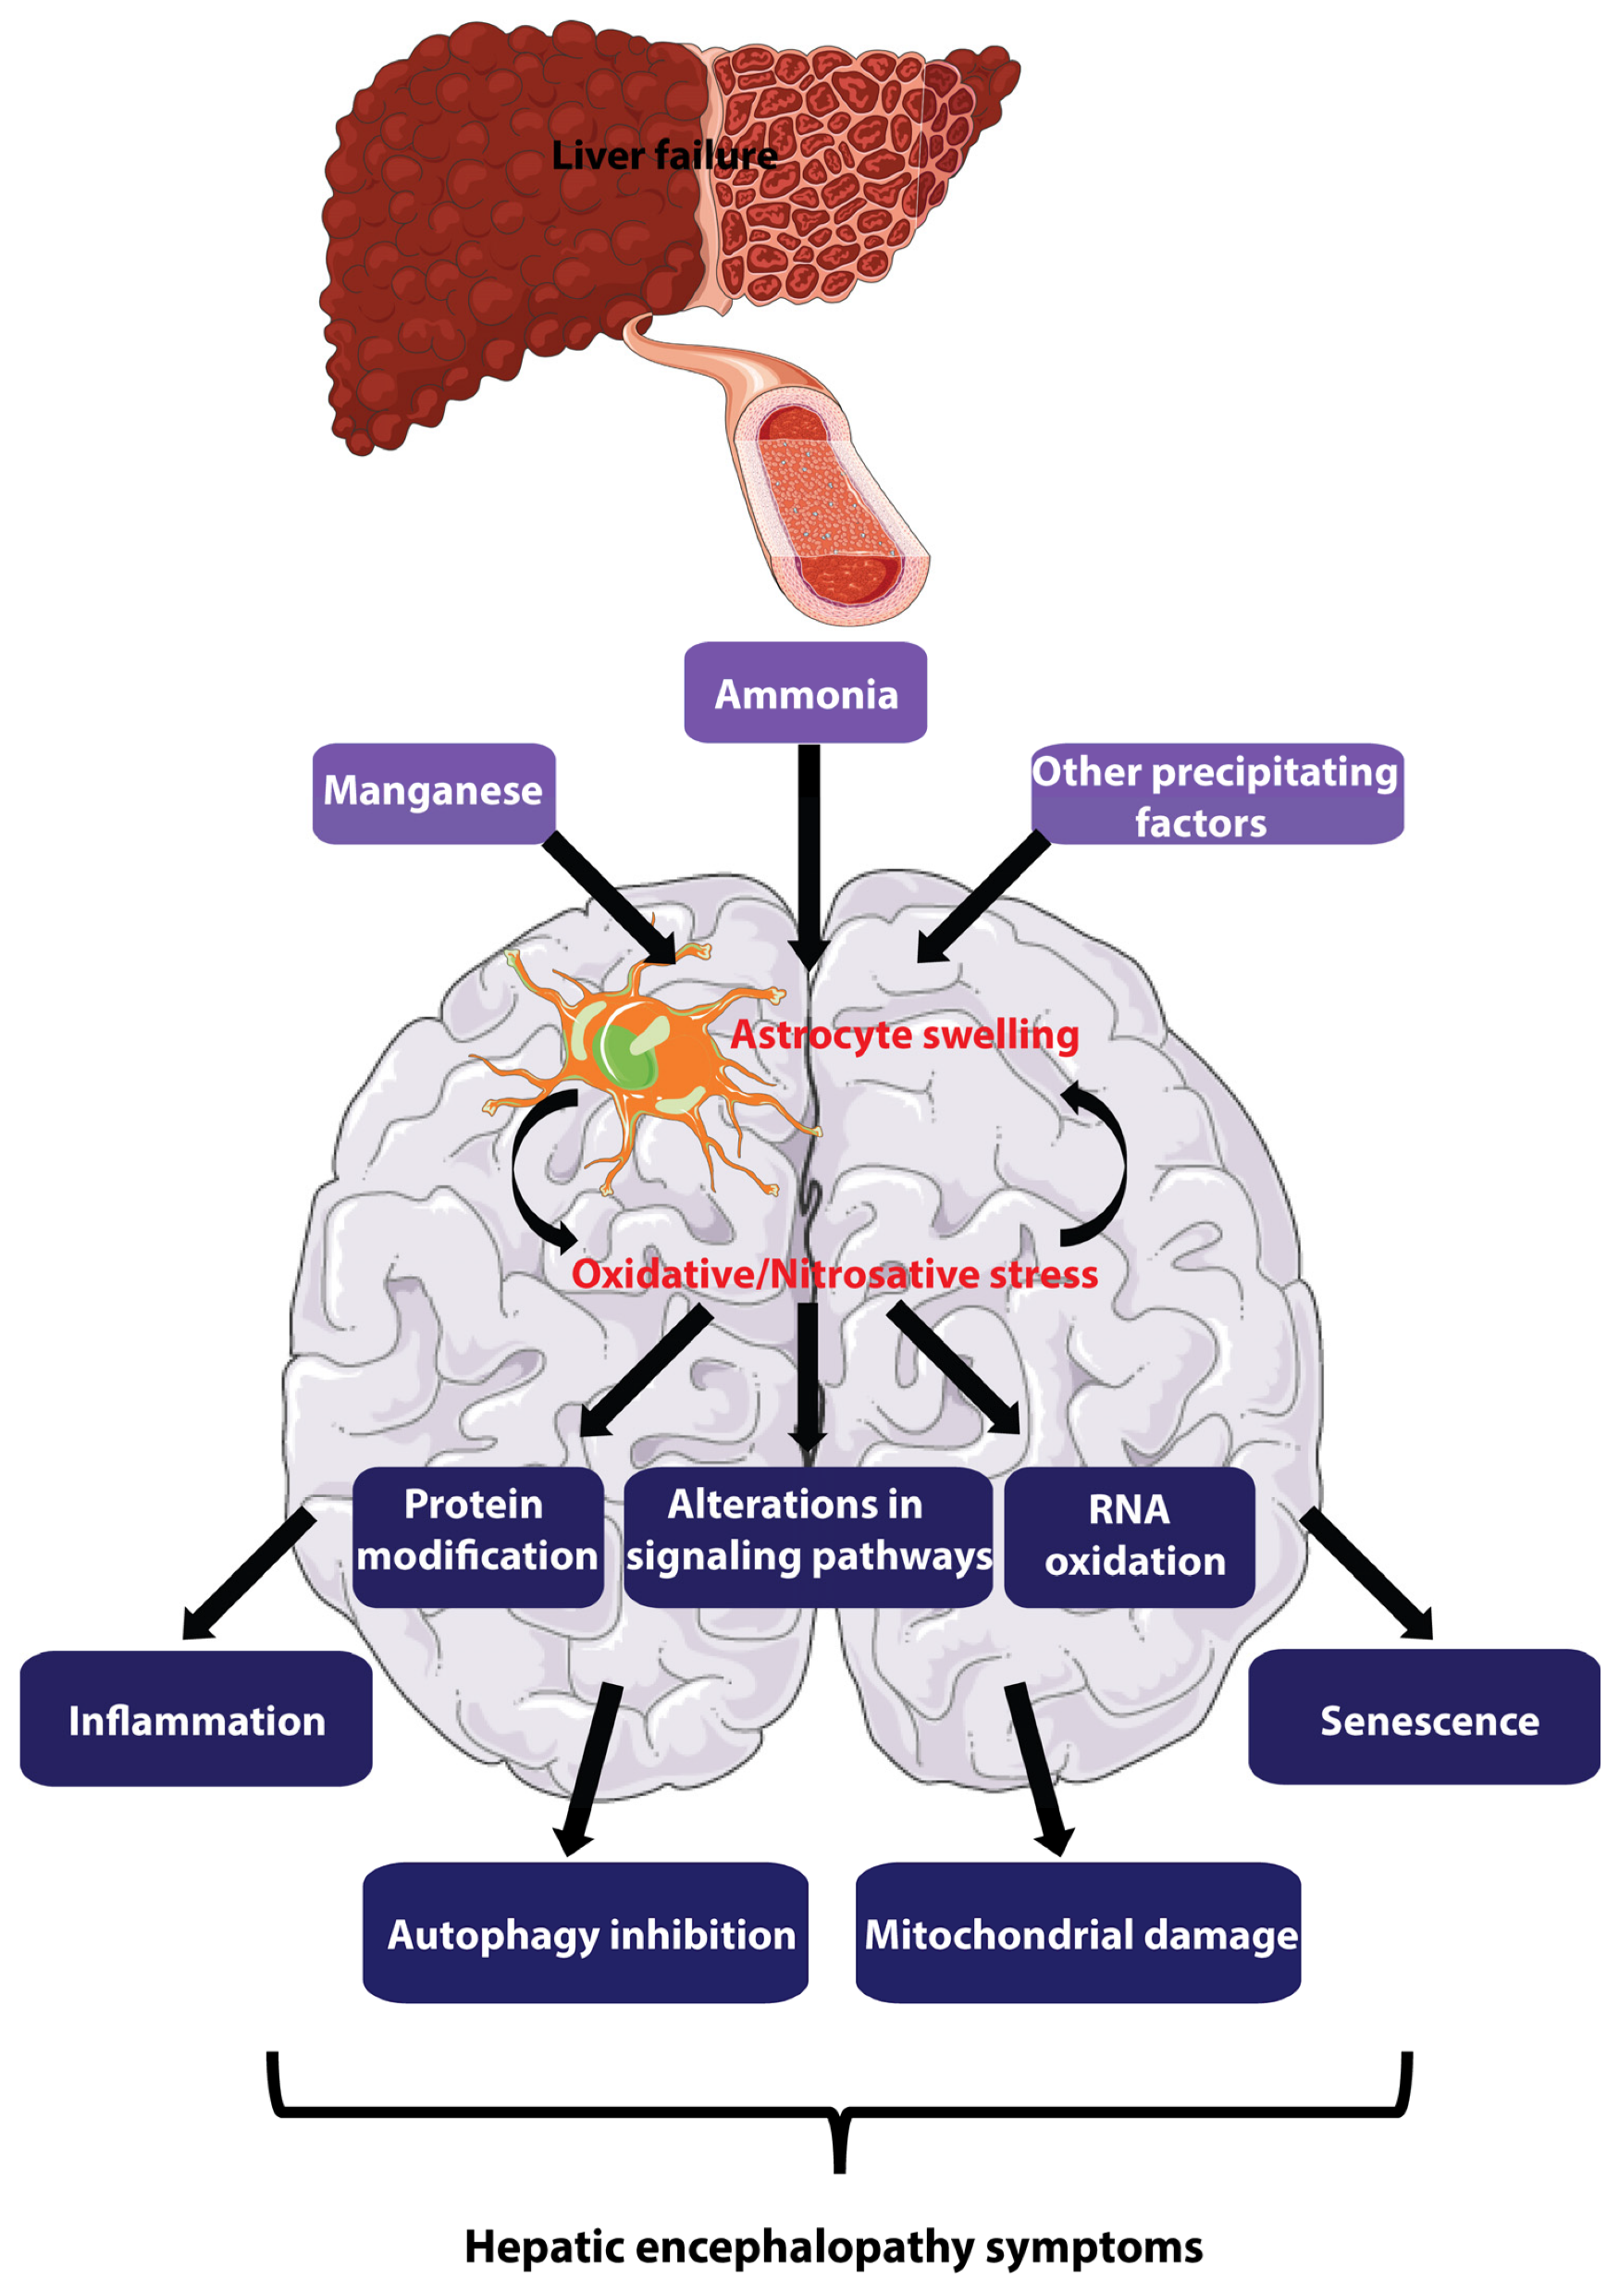
Hepatic Encephalopathy (HE)
A neurological disorder caused by liver dysfunction, esp liver disease or liver failure.
liver is unable to adequately filter toxins (ammonia) from bloodstream.
toxins then accumulate and affect brain function, leading to a range of mental and physical symptoms.
Electrolyte and ammonia monitoring
The printed circuit board (PCB) is composed of 3 working electrodes (for Na+, K+ and NH4+) and one common reference electrode
Specific PVC chambers are assembled on the PCB
A membrane is then added to the top of the chamber.
Each membrane is specific for an ion.
The specificity is due to an ionophore embedded in the membrane.