week 9 - Nonparametric Tests for Two Means, Testing Regression Slopes, and the Normal Approximation to the Binomial Distribution
1/35
There's no tags or description
Looks like no tags are added yet.
Name | Mastery | Learn | Test | Matching | Spaced | Call with Kai |
|---|
No study sessions yet.
36 Terms
what is the difference between a parametric and a non-parametric test?
parametric - based on density distributions ie normal or t
non-parametric - do not have a formula or density function and use robust statistics
“distribution-free” tests
why do non-parametric tests compare medians rather than mean?
medians are robust statistics
what type of data is the wilcoxon signed ranks test applicable to? is the response variable discrete or continuous?
paired data
continuous but can be ordinal
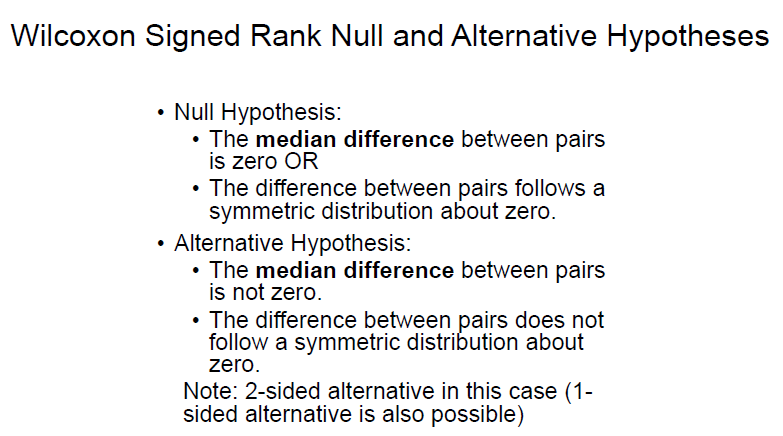
what are the null and alternative hypotheses for wilcoxon signed rank tests?
ie - 0 is the center of the dist
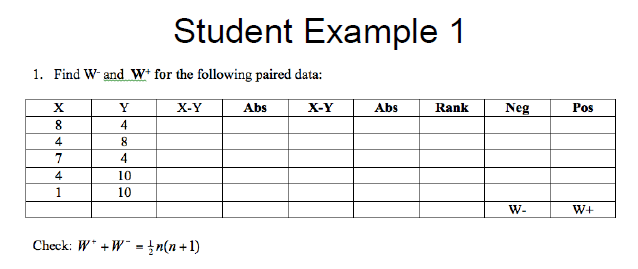
what are the steps in conducting a wilcoxon signed rank test?
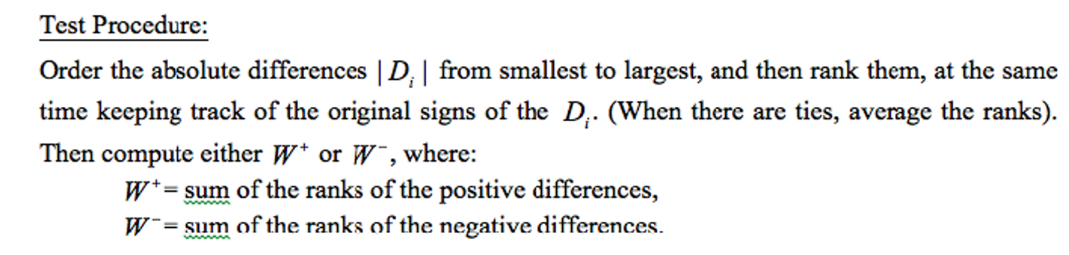
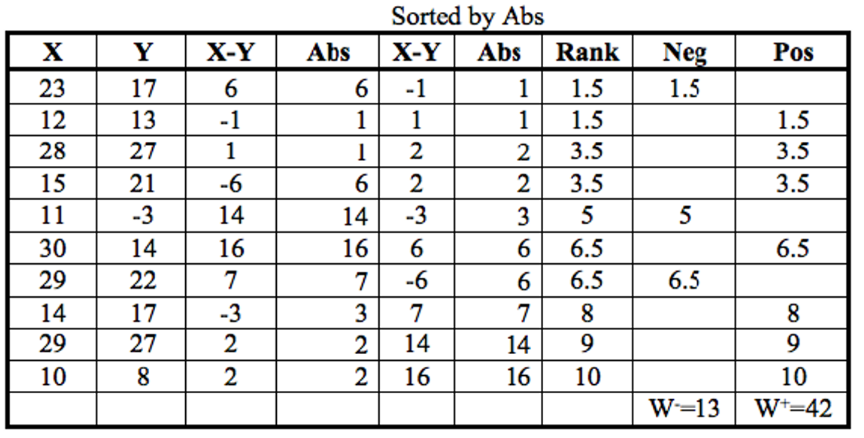
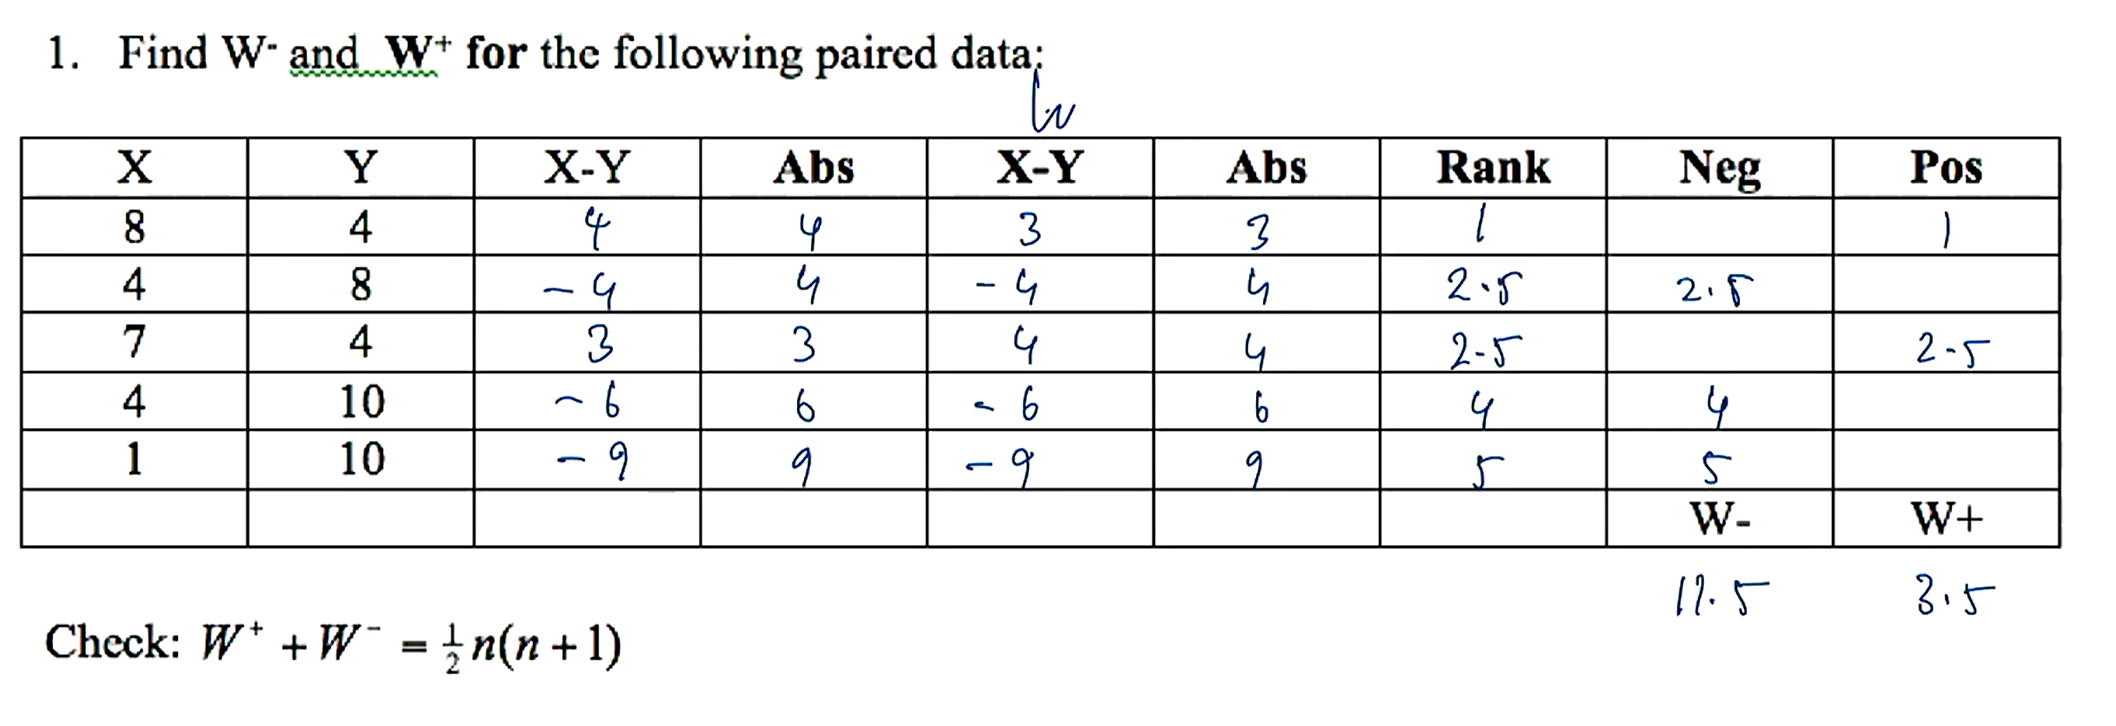
explain the table (columns) used to generate W- and W+
X-Y - find difference
abs - abs value of difference
X-Y - order the absolute value BUT include the sign
abs - abs value of X-Y
rank - incl averages
neg
pos
how do you average ranks?
if there are 2x number 1 and 1 is the smallest number, each number 1 is the average between rank 1 and 2, thus 1.5
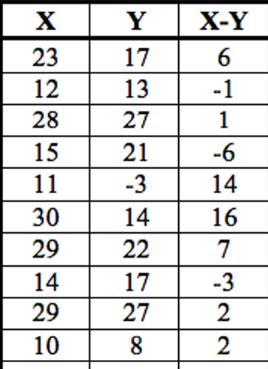
calculate W+ and W- for this data
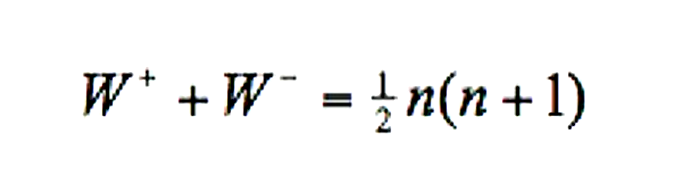
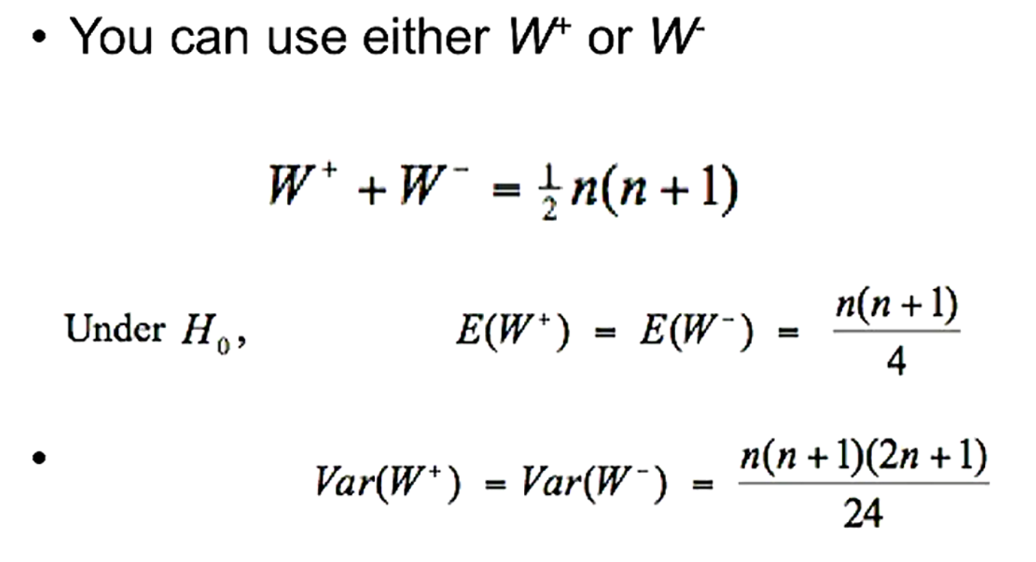
how can you check your W+ and W- ranked sums?
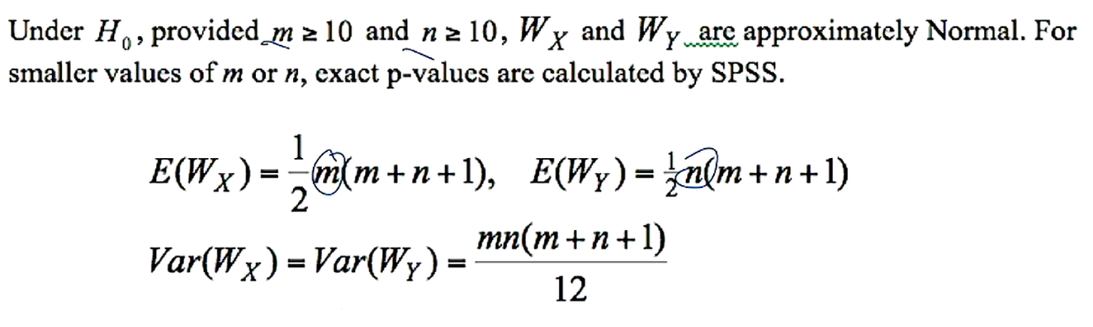
how do you calculate the expectation and variance of ranked sums? what are the conditions for this?
condition - n must be AT LEAST 10
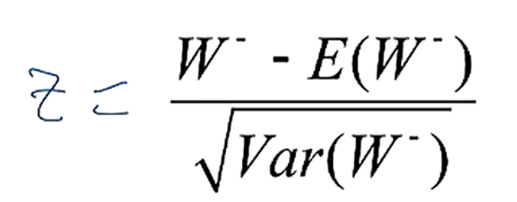
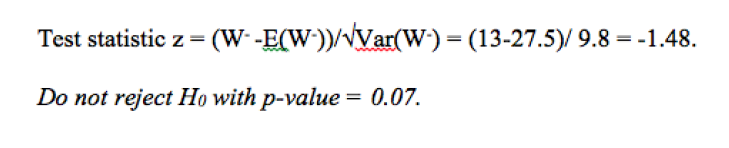
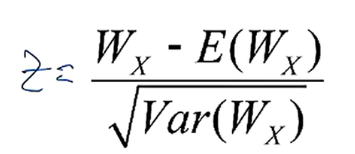
how do you calculate the Z statistic for wilcoxon signed rank tests?
where sqrt of var = SD
what is the p-value for a W- value of 13 and n=10?
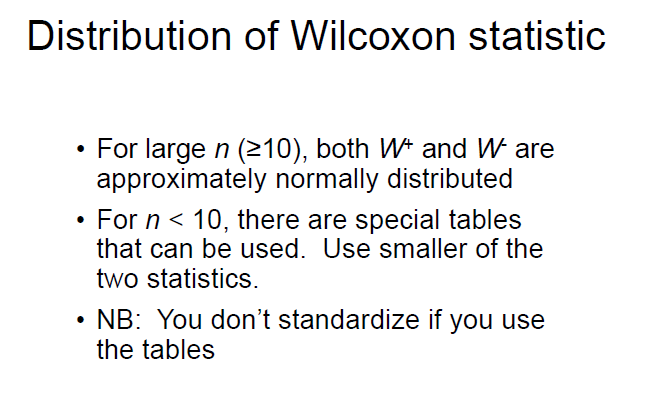
what are the distributions for wilcoxon statistics when n>10 and when n<10?
thus, we can use a Z procedure if n>10
using the table, what is the p-value for a W- of 13 and n=10. what conclusion can be made in this scenario for a 1 and 2 sided test?
13 is btwn 14 and 10
for both 1 and 2 sided tests, p>0.05, thus we cannot reject H0, not a significant difference between the 2 medians

do you use W- or W+ when using the table for wilcoxon tests?
whichever is the smaller rank sum
what type of data is the mann-whiteney test applicable to?
unpaired data
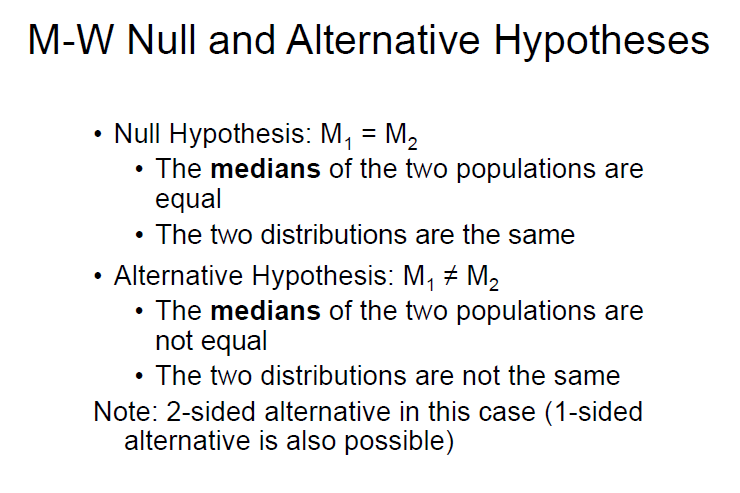
what are the null and alternative hypotheses for mann-whitney tests?
what are the steps involved in the M-W test?
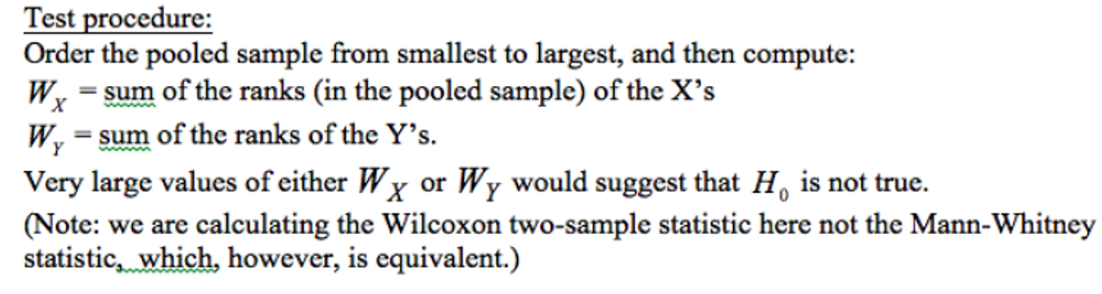
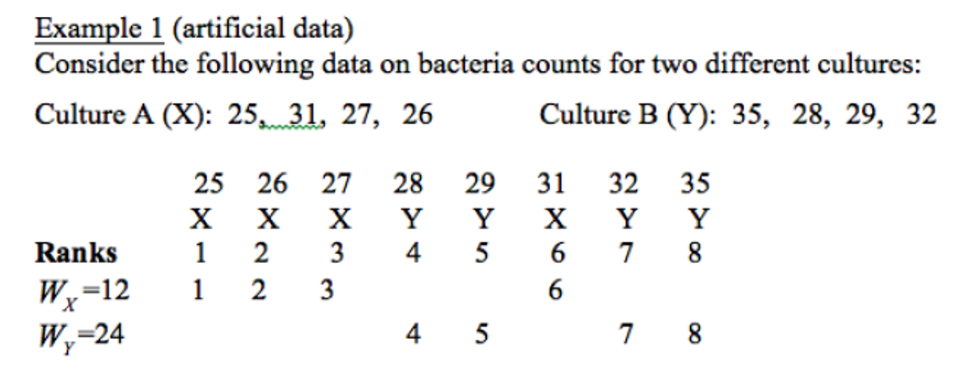
what do the rank sums indicate about the data?
larger rank sum indicates that the group is quite different, or further from the other group
how do you calculate the expectation and variance of Wx (or Wy) for MW tests?
how do you calculate the Z-statistic for Wx (or Wy)?
where sqrt of var = SD
p-value >0.2
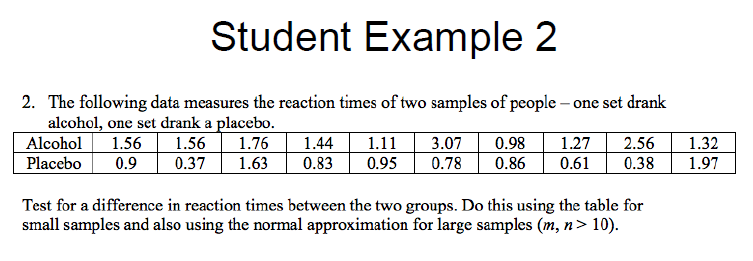
*P = 0.0041
in regression, how are residuals distributed?
normally distributed about the mean
what are the null and alternative hypotheses for testing the slope of a regression line?
H0: slope =b
Ha: slope =! b
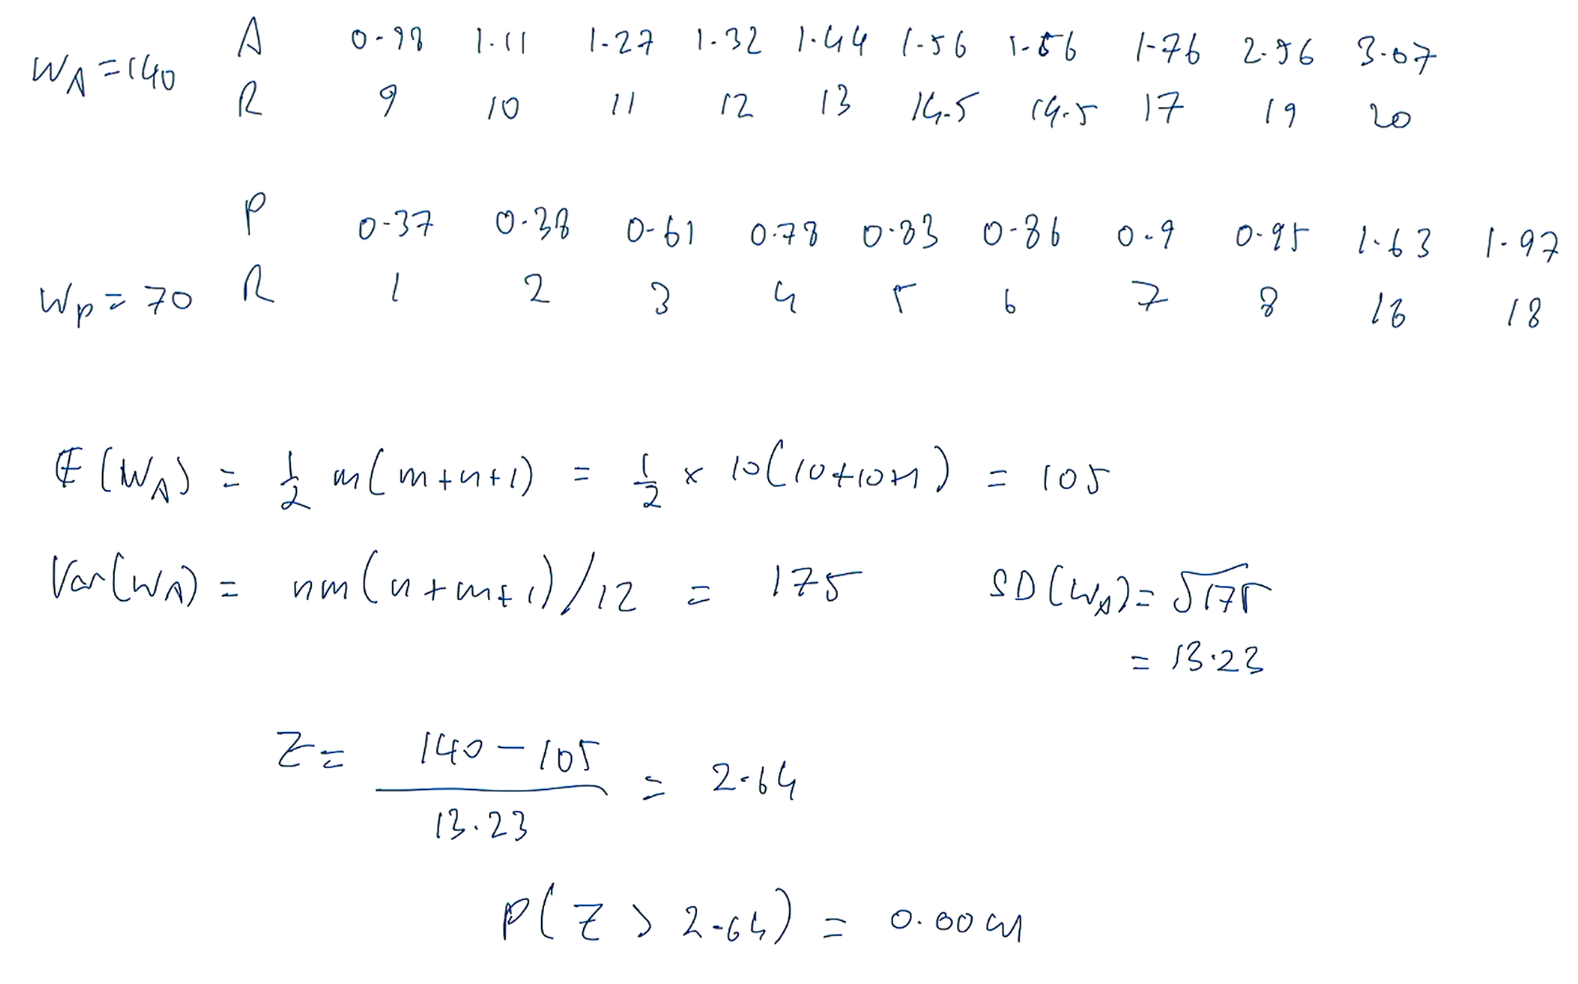
how do you calculate the SE of the slope?
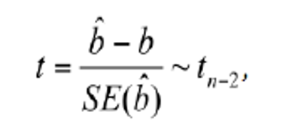
how do you calculate the test statistic for the slope? what are the degrees of freedom and why?
df = n-2 as we are estimating slope AND intercept
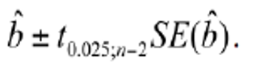
what is the structure of a 95% confidence interval for testing a slope?
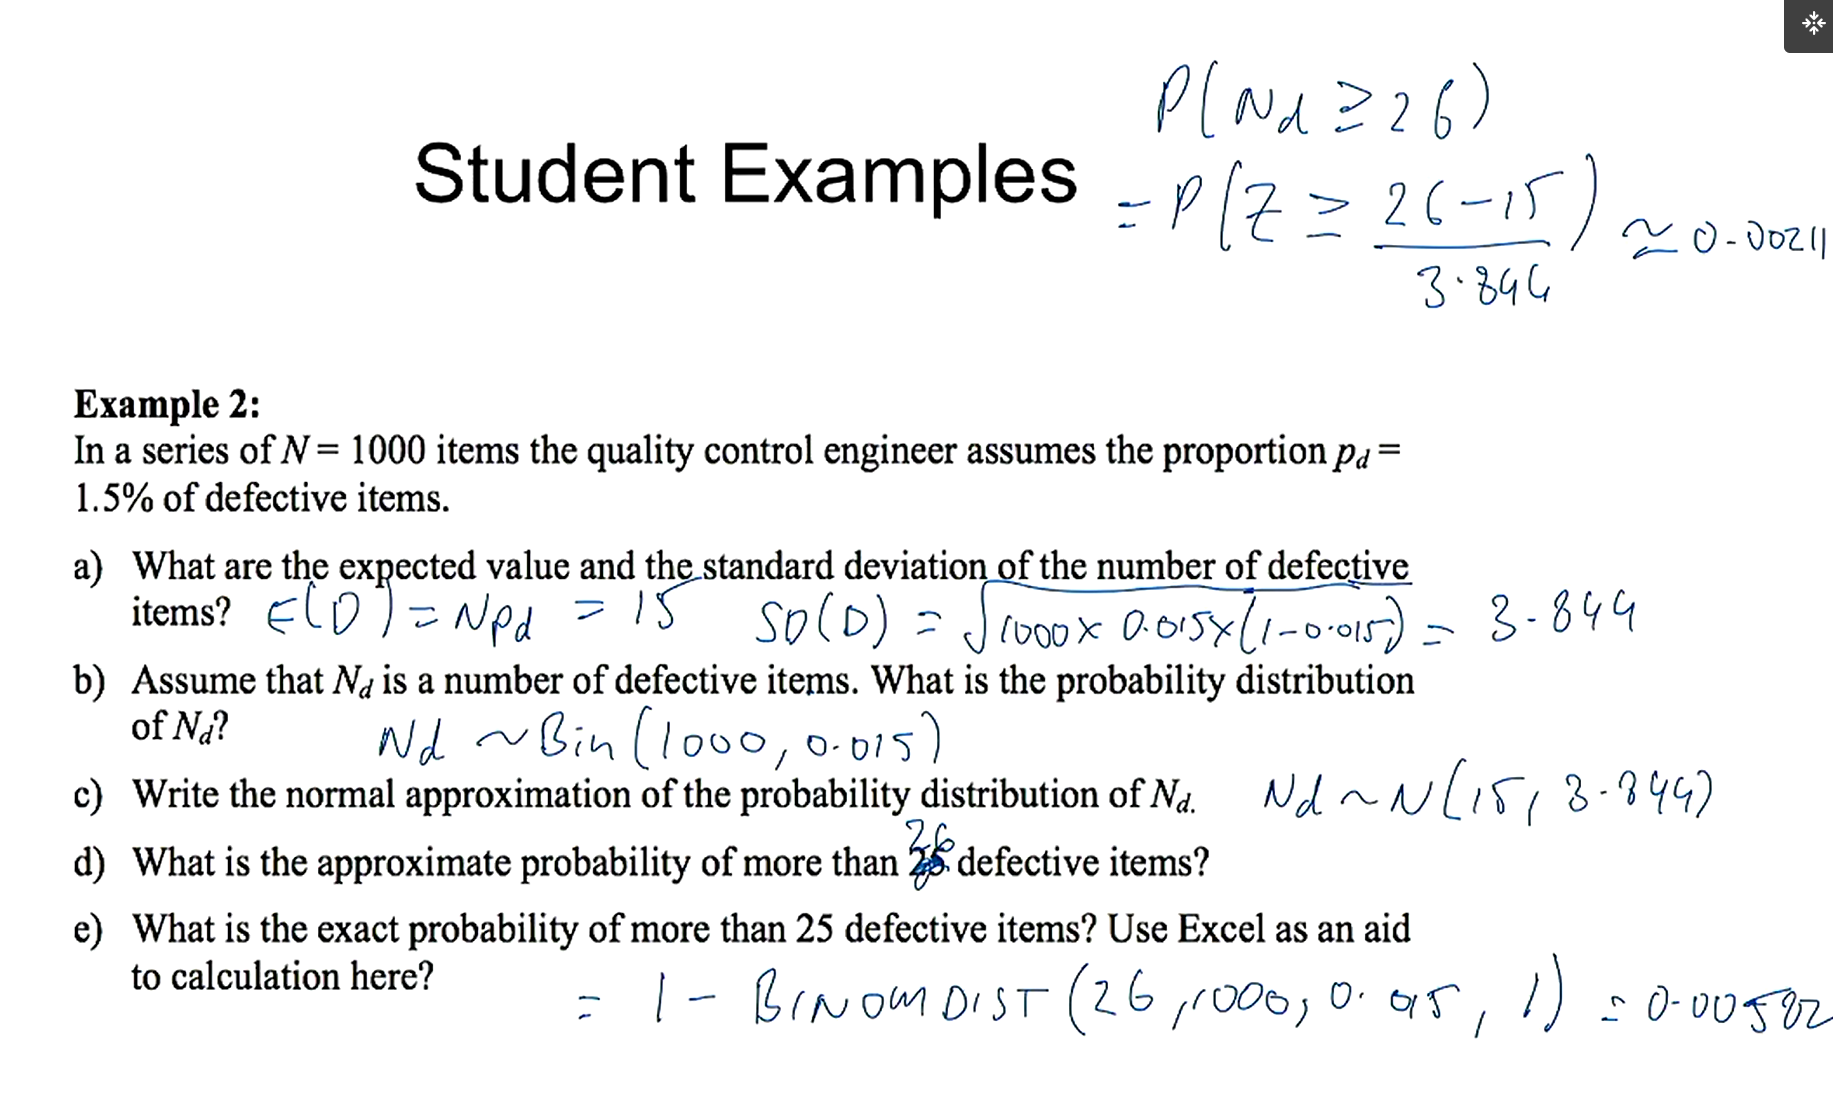
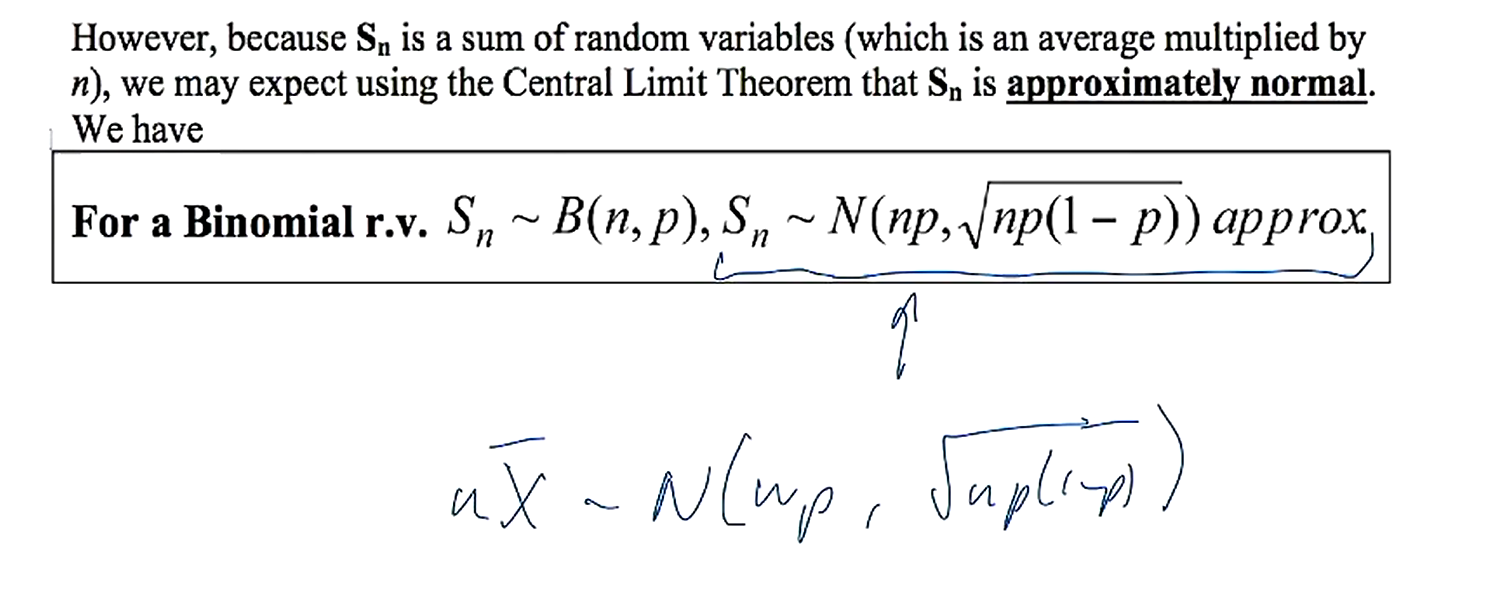
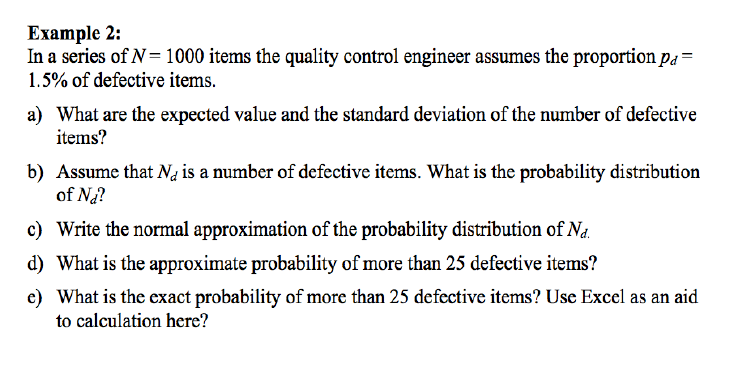
how can we approximate binomial distributions. what is this used to make inference on?
we can approximate the binomial using the CLT
approximations can be used to make inferences on proportions
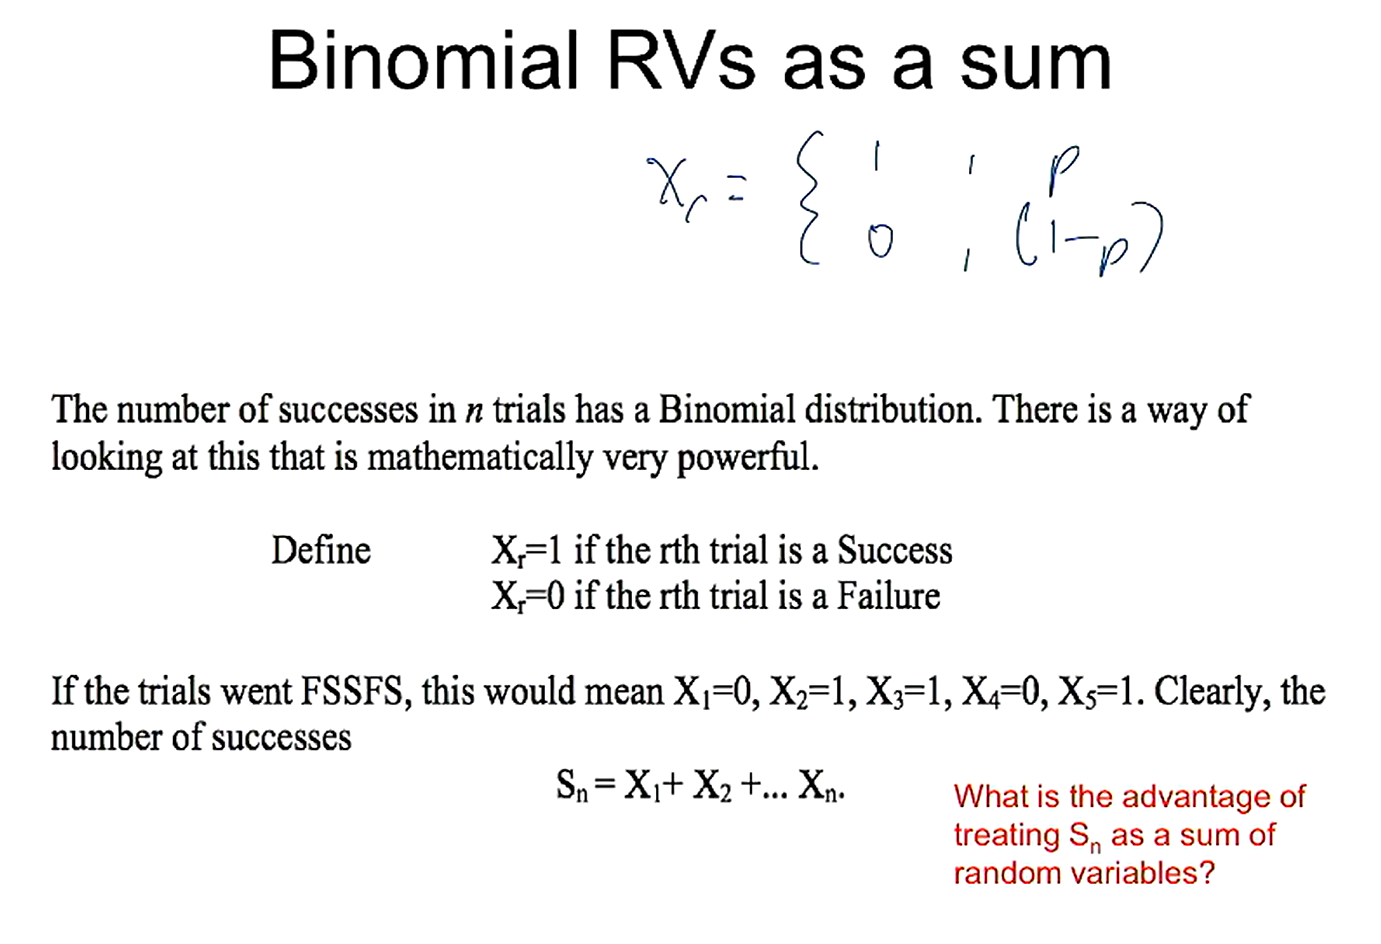
how can we find the sum of successes of a random variable? what is this defined as?
sum = no of successes = Sn
how do you calculate the expectation and variance of Sn?
for bernouli, expectation, E(X), = p

what is the distribution of Sn for a binomial rv?
what are the steps in the normal approximation for a binomial?
calculate binomial as a sum, find expectation and variance, and apply CLT
what are the 2 versions of the CLT?
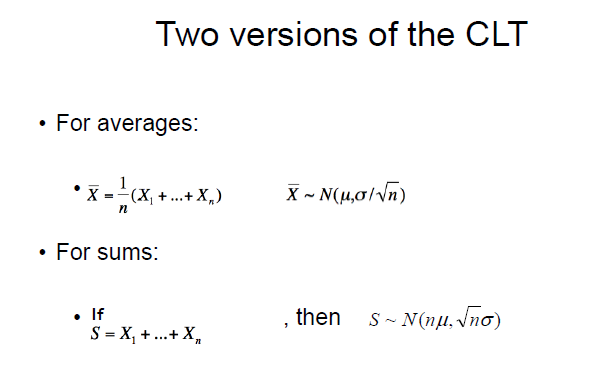
how do we improve the accuracy of the normal approx to binomial?
binomial vs normal - binomial is a discrete dist, normal is continuous
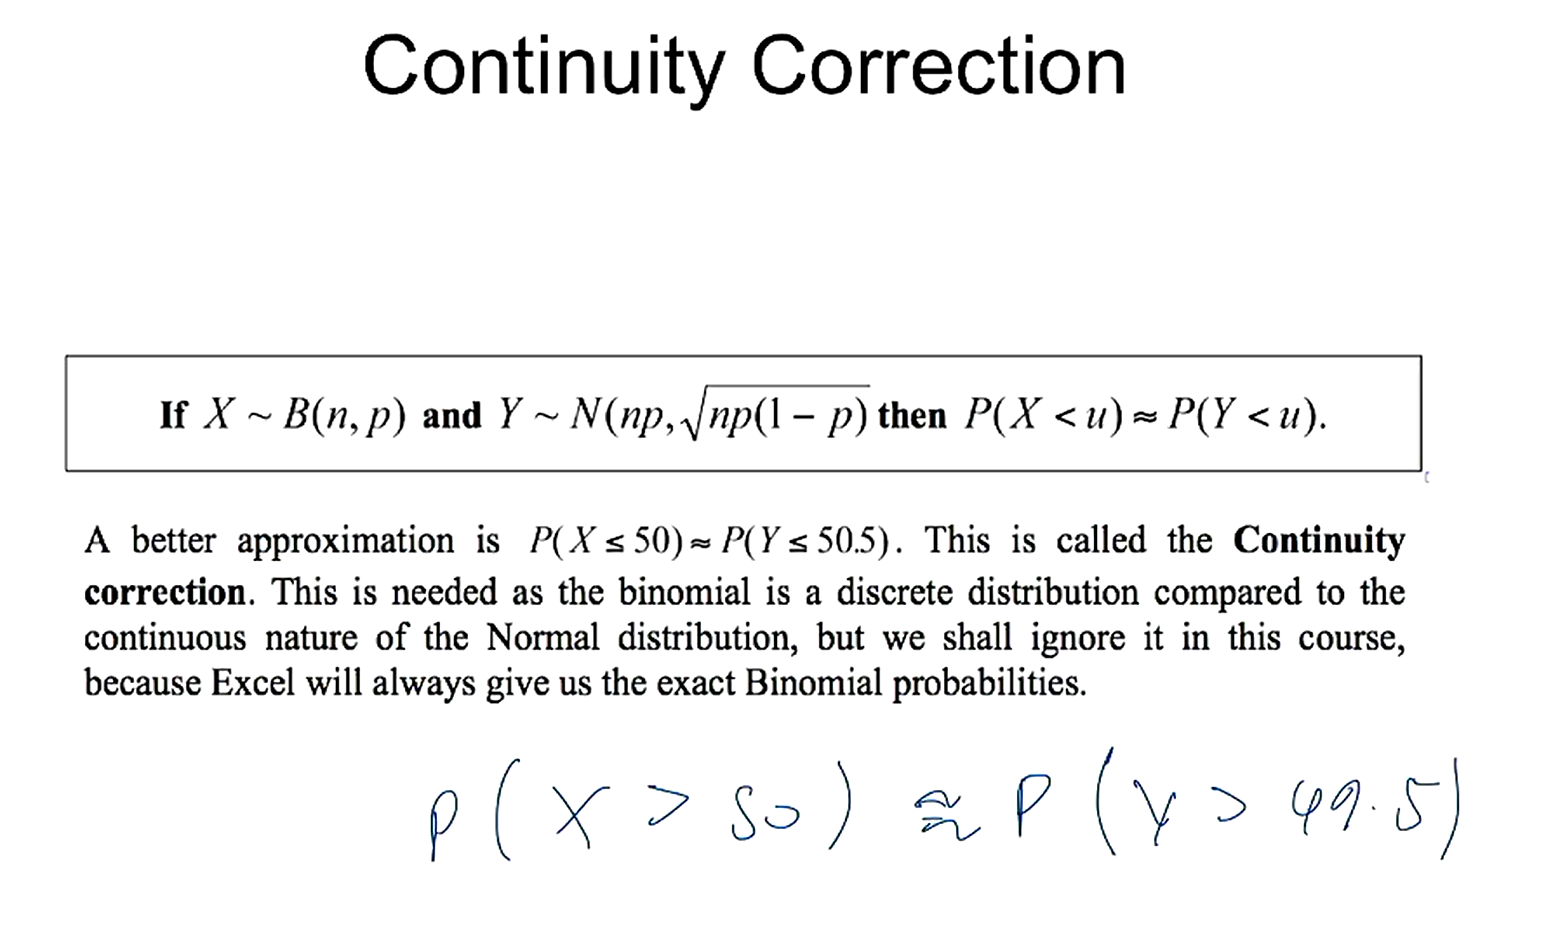
^use 26 for qd (or 25.5 for the correction)