Intro to Supply Chain Chapter 02: Forecasting and Demand Planning
 Call Kai
 Learn
Learn Practice Test
 Spaced Repetition
 Match
Match Flashcards
 Knowt Play
1/42

There's no tags or description
Looks like no tags are added yet.
Name | Mastery | Learn | Test | Matching | Spaced | Call with Kai | Chat |
|---|
No analytics yet
Send a link to your students to track their progress
43 Terms
Demand Planning
combines statistical forecasting techniques and judgment to construct demand estimate for products and services.
Independent Demand
demand for an item unrelated to the demand for other items, such as finished products or spare parts…demand is forecasted for these items.
Dependent Demand
demand for an item directly related to other items or finished products, such as a component or highly used materials…demand is calculated for these items.
Forecasting
business function that estimates future demand for products so they can be purchased or manufactured in appropriate quantities in advance of need.
uses historical data for future trends
uses math to predict future demand
Short-term forecasting
3 or less months, used for tactical decisions (specific, short-term)
Medium-term forecasting
Used to develop a strategy over the next 6-18 months.
Long-term forecasting
Moe than 2 years of predictions, used to detect general trends and identify major turning points.
Good Forecasting
More effective planning
Reducing inventory costs and stockouts
Better customer service
Bad Forecasting
Root of all problems
Surplus or Shortage
Can annoy customers
Factors Influencing Demand
Market Changes
Seasons
Competition
Pricing
Changing consumer preferences
etc
Forecasting Error Theory
the farther out into the future you forecast, the more wrong you will be.
Qualitative Forecasting
forecasting based on opinion and intuition, preferred for newer items, used when data is unavailable, best for long-range forecasting, depending on forecaster’s expertise
Personal Insight
Jury of Executive Opinion
Delphi Method
Historical Analogy
Customer Surveys
Quantitative forecasting
forecasting using math models and historical data, preferred for older/mature items
Time Series
Naive
Simple Moving Average
Weighted Moving Average
Exponential Smoothing
Linear Trend
Cause N Effect
Simple Regression
Multiple Regression
Personal Insight (Qualitative Forecasting)
based on the insight of the most experienced/senior person
Adv:
Fastest and cheapest
can provide good forecast
Dis:
relies on one person’s judgement
unreliable
Jury of Executive Opinion (Qualitative Forecasting)
A panel formed by management that conducts a series of forecasting meetings until they reach a consensus agreement.
Adv:
multiple experts/experiences
no time needed to collect data by survey
dis:
may have bias
some quieter panelists may be overshadowed by more outspoken panelist (bias)
Delphi Method (Qualitative Forecasting)
Same as Jury of Executive Opinion EXCEPT each expert is collected separately to avoid bias/influences
adv:
decisions are not caused by groupthink
useful for new products
best for long-term forecasting
dis:
may be some bias
company must spend time collecting data
external experts —> less confidentiality
can be time consuming
Historical Analogy (Qualitative Forecasting)
A judgmental forecasting technique based on identifying a sales history comparable to a present situation, such as the sales history of a similar product.
Adv
potential to provide lots of info that can be used for new products
relatively inexpensive
Dis:
there may be no similar product to historically compare
No 2 products, even similar are NOT identical, so may be inaccurate even though it’s similar.
Customer Survey (Qualitative Forecasting)
Customers are directly approached and asked for their opinion about a particular product (phone, email, online)
adv:
it is a direct method of assessing information from the primary source
simple to administer
no bias if questions are made well
dis:
can have bad questions —> unreliable answers
customers may just ignore survey
time consuming and costly to survey large population
Time Series (Quantitative Forecasting)
based on the assumption that the future is an extension of the past. History is used to predict future… forecasts for future demand rely on understanding past demand.
Cause N Effect (Quantitative Forecasting)
Assumes that one or more factors predicts future demand
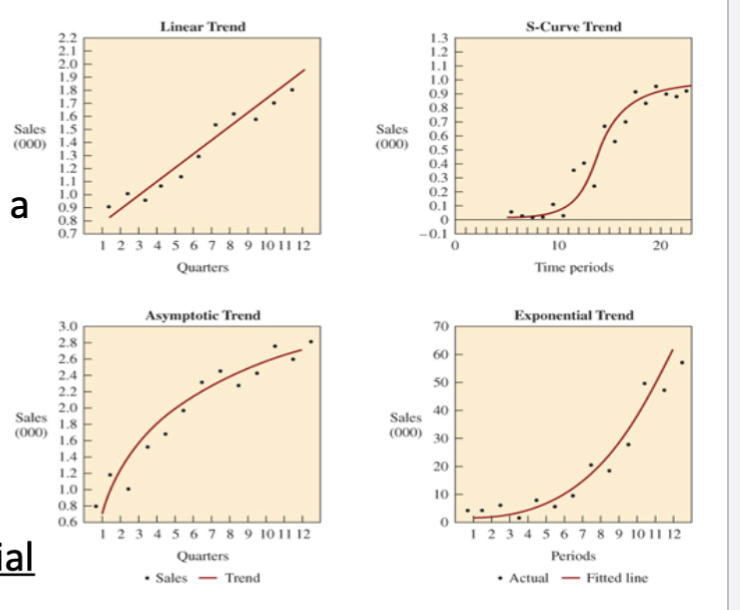
Trend Variations
Identification of trends is a common starting point for a trend
S Curve —> initial slow growth, usually new product (slow, then fast, then reduces a bit, then plateaus)
Asymptotic —> demand reaches a plateau over-time
Exponential —> Slow start but keeps going up
Random Variations
Instability in data caused by random occurrences
unpredictable weather, labor strikes, war, natural disasters
Seasonal Variations
Patters of variations within the year, high demand at some time, low at others
holidays, seasons
Cyclical Variations
Wave-like patterns that last longer than one year and extend over multiple years
not easily predictable
business cycles, china’s growth, GDP
Naive Forecast
last period’s actual demands are used as this period’s forecast without adjustment.
simple —> worked last time, works this time
adv
stable for mature products
easy to determine
dis
only for mature products
variations in demand creates inventory issues
Simple Moving Average
mathematical result that is calculated by averaging the demand of past data.
adv
short-term forecasting, no seasonality is present
addresses random variations
dis
fails to identify seasonal trends
create shortages when demand increases, and surplus when demand decreases.
Weighted Moving Average
A technique that puts more weight on recent data and less on past data through a weighting factor.
adv
more accurate than simple weighing
allows unequal weighing
dis:
still not a perfect way to forecast
more inconvenient and costly than exponential smoothing.
Exponential Smoothing
Exponential smoothing weights past observations with exponentially decreasing weights to forecast values…smoothing factor always btwn 0 and 1 and is based on company experts.
adv;
more responsive to trends than previous methods
Accepted Because:
surprisingly accurate, relatively easy
user can understand easily
small storage
dis
still lag behind trends, esp upward trends.
Linear Trend Forecast
Simplistic Forecasting technique that imposes a line of best fit to series historical data
adv:
provide accurate forecast even through random variations
dis:
seasonal and cynical variations are softened, making it more beneficial for annual forecast rather than monthly forecast
Selecting Weights for Weighted Moving Average
Experience and/or trial and error
recent past is more indicative than past past.
data is seasonal, weights should reflect appropriately
forecasting swimsuit sales for august…should have higher weight on July than December
Simple Linear Regression
models the relationship between a single independent variable and a dependent variable (demand) by fitting a linear equation to the observed data.
Multiple Linear Regression
models the relationship between a 2 or more independent variable and a dependent variable (demand) by fitting a linear equation to the observed data.
Fundamentals of Forecasting
Forecasting is often wrong, but the skill is to detect and adapt quickly
the more specific the forecast is, the less accurate it is
it is easier to forecast smaller time periods than larger time periods.
simple forecasting trumps methodological forecasting
one correct forecast does not mean your forecasting method is perfect. (could’ve been chance)
If you don’t use your data regularly, trust it less.
All trends eventually end
Hard to eliminate bias, so know that most forecasts have bias.
Tech is not the answer to better forecasting.
it is a tool to make you more accurate..
Impacts of social media
Evaluate brand health (understanding of customer’s feelings on product/service)
Improve demand prediction (can understand if product is trendy or not)
Address a crisis (social media can show negative thoughts of public)
Research competition (social media often compares similar products)
Forecast Error
measured in units/percents
Error Measurement
Critical in tracking forecasting accuracy, monitoring exceptions, benchmarking forecasting process.
Forecast Error Value (FEV) Formula
FEV = Actual Demand - Forecasted Demand
FEV% = ((A - F) / A) x 100
Mean Absolute Deviation (MAD)
measures the size of the forecast error in units.
Σ|A - F|) / nn = number of time periods
Mean Absolute Percent Error (MAPE)
measures size of error in %
Σ ((| A - F |)/ A))/ n
Bullwhip Effect
small shifts in consumer demand cause increasingly larger fluctuations in orders and inventory as you move up the supply chain
Alleviate the Bullwhip Effect
Collaboration (sharing info and data)
Sync Supply Chain (plan better between independent suppliers)
Reducing Inventory (using JIT or quick adaptions to effectively have perfect inventory, no surplus or shortage)
Collaborative Planning, Forecasting & Replenishment (CPFR)
business practice that combines the intelligence of multiple trading partners who share their plans, forecasts, and delivery schedules to ensure smoothness in supply.
Better customer service
lower inventory costs
improved quality
Supply Chain Agility
ability to quickly and efficiently respond to changes in demand or supply without sacrificing
reconfiguring people, processes, and goods to adapt to new market conditions
Helps avoid knee-jerk reactions to vulnerable markets