AP Human Geo key-Goncept Cramming
1/38
Earn XP
Description and Tags
Name | Mastery | Learn | Test | Matching | Spaced |
|---|
No study sessions yet.
39 Terms
GIS
Used to layer different maps to show patterns and data
Thematic maps
Type of map that shows data with an theme
Population pyramid
Used to show demographic patterns and population using sex and age
DTM
Five stages that it has been said all countries will have gone through. Each stage categorized by death/birth rates and natural population increase.
⭐i️t does not factor migration
Epidemiological transition theory
It shows separate diseases of countries is most likely to face depending on his development stage
Ravenstein laws of migration
Most moved to short distance,Migration goes by steps,Long-distance migraines are more likely to move to big cities,All migration flows have a counter flow, people of rural areas are more likely to migrate
Zelinsky model of migration transition
Talks about what type of migration is most likely to happen depending on the demographic stage of the country
Malthusain theory of population
That with the population, there wouldn’t be enough food and famine what happened but that did not stand true it was Incorrect
S-Curve
So the speed at which ideas are adapted, things started picking up slowly, then quickly became popular, then cool off.
Language tree
Three of which languages come from which family
Organic theory
Inspired by Hitler, the ideal was that countries are like living organisms that go through birth and death and the nourishment (acquiring less powerful states to survive)
Mickinders heartland theory
The key was even global power is to conquer Eastern Europe and Russia
Spyman’s rimland theory
The idea during the Cold War, that F1 country fell to communism the surrounding countries also fall like dominoes
Core periphery model
Describes the relationship between core and per countries. The core is one to rely on the labor from the periphery country.
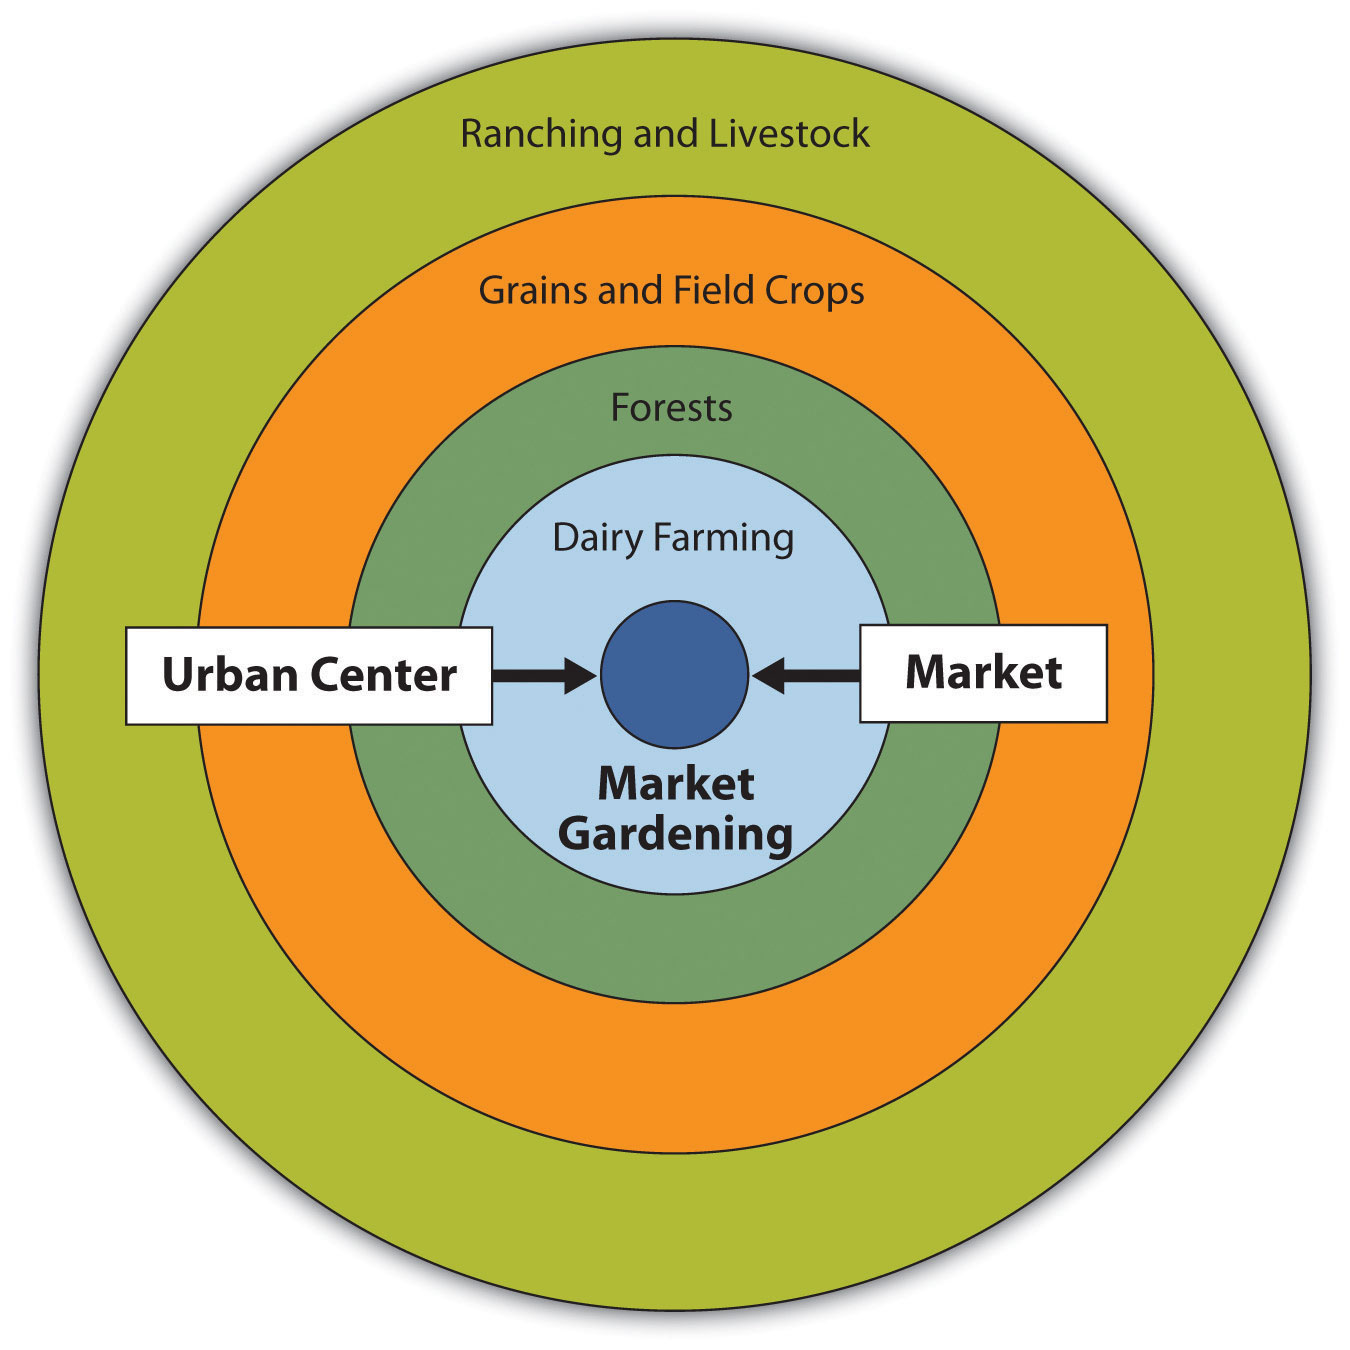
Von Thunen model
Shows where industries were located. With four rings around the city. The first wing was dairy farming plus market gardening. The second was forced. The third was plus food crops. And the fourth was ranching in livestock.
Esther boserups Theory
The idea that Food production will increase based on population increase
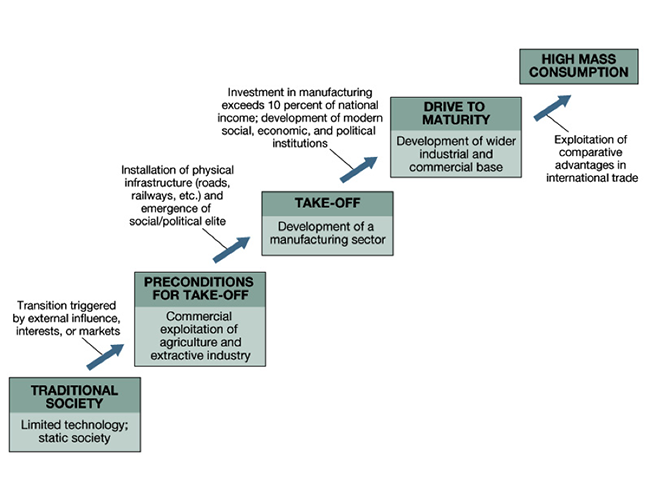
Rostows stages
Stage one: traditional society
Stage two: Preconditions to takeoff
Stage three: Takeoff
Stage four: Drive to maturity
Stage five: High mass consumption
Wallerstines World system
The connection between core relationship, relationships, and industrial development
Dependency
The idea that the world system theories to fantasy was caused by colonization
Webers least coast
The pattern was industries is that the transportation cost materials to the factory and the finished product to the market are the lowest
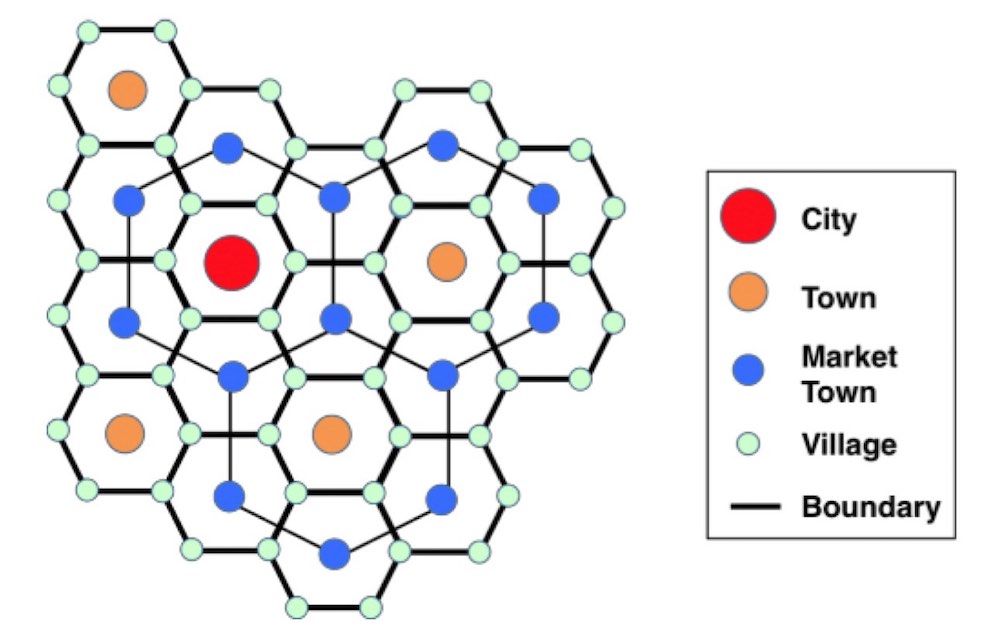
christaller's central place theory
Based on how far people are willing to travel for work and products
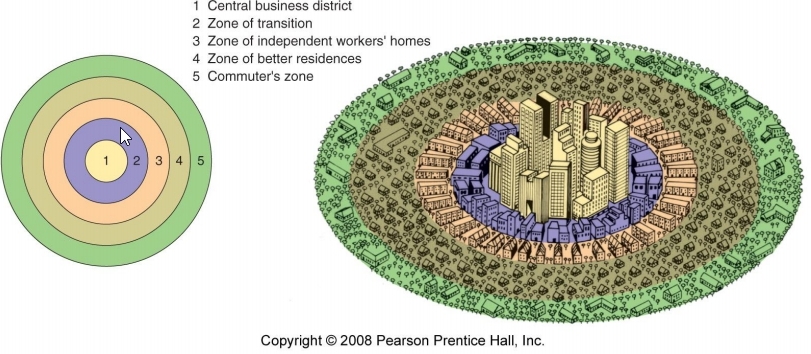
burgess concentric zone model
The center of the city, the best district industry/residential areas
Gravity
The idea that people would be more willing to go to certain places over others
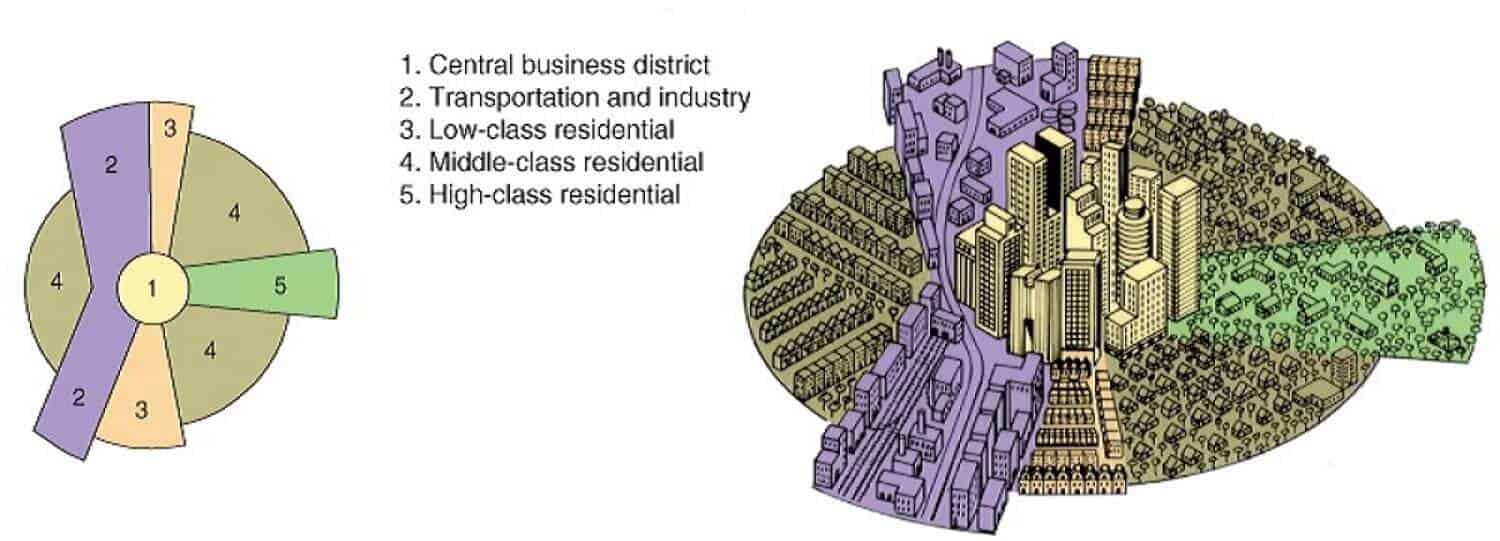
Hoyt sector model
Hey Siri map where the lowest Class lives around transportation while upper class live so long business
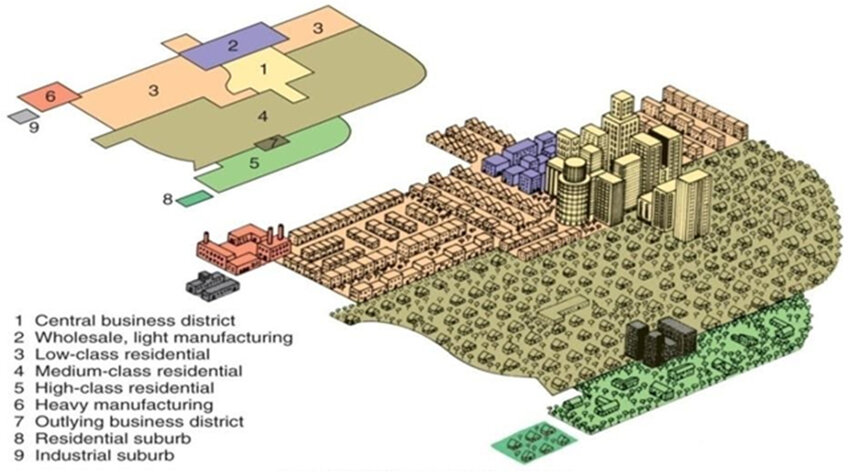
harris-ullman multiple nuclei model
City layout with multiple central business districts
borscht evolution of the american urban system
Changing the history of urbanization with cities, first being developed Newports and major waterways
Bid-rent curve
Further away from the central city, the higher the land prices
Break
Breathe in and breathe out u got this set a timer for 5 minutes then come back chill don’t stress yourself
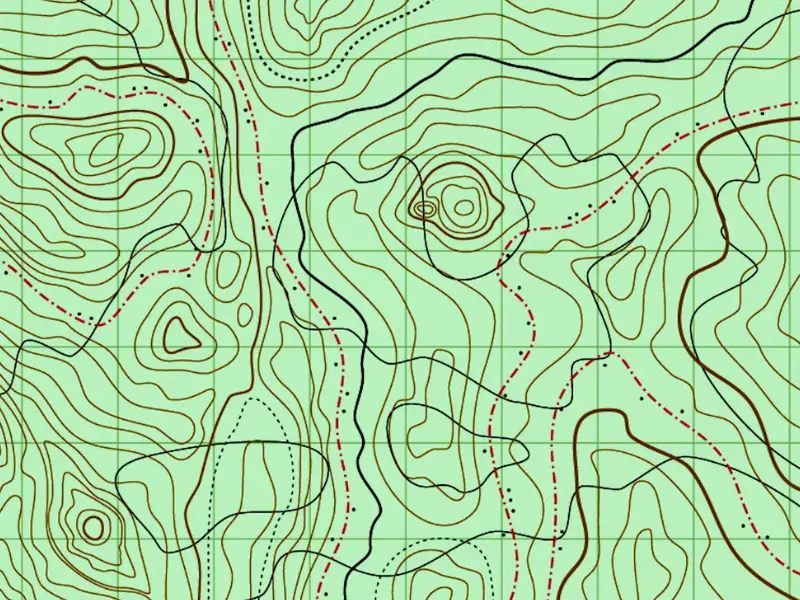
Topographic maps
Are maps used to show the natural and man-made features in a area including the evolution in detail. They use contour lies to evolution. That can show mountains, valleys, plains, lakes, rivers, etc. Well also including man-made details like roads, boundaries and buildings.
Thematic maps
They made a map so different from topographic maps. They are used to show data such as population, efficiency, measure, or economic patterns. These information can be shown in color, dots, and shapes.

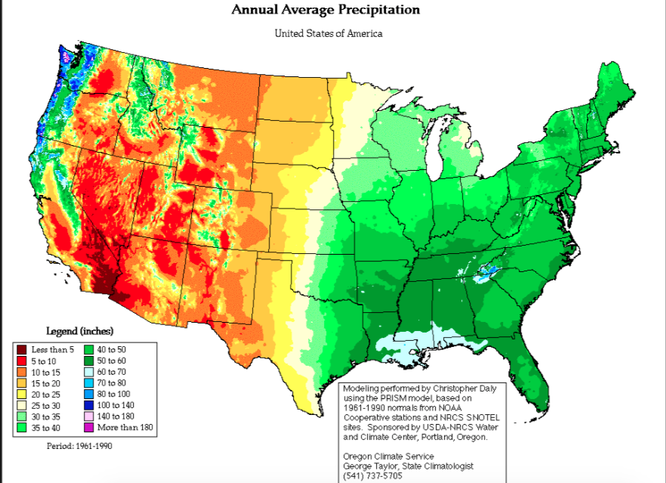
Chropleth maps
Or a type of automatic map that uses colors to show information
Isoline map
Maps use lines or contour lines to show information
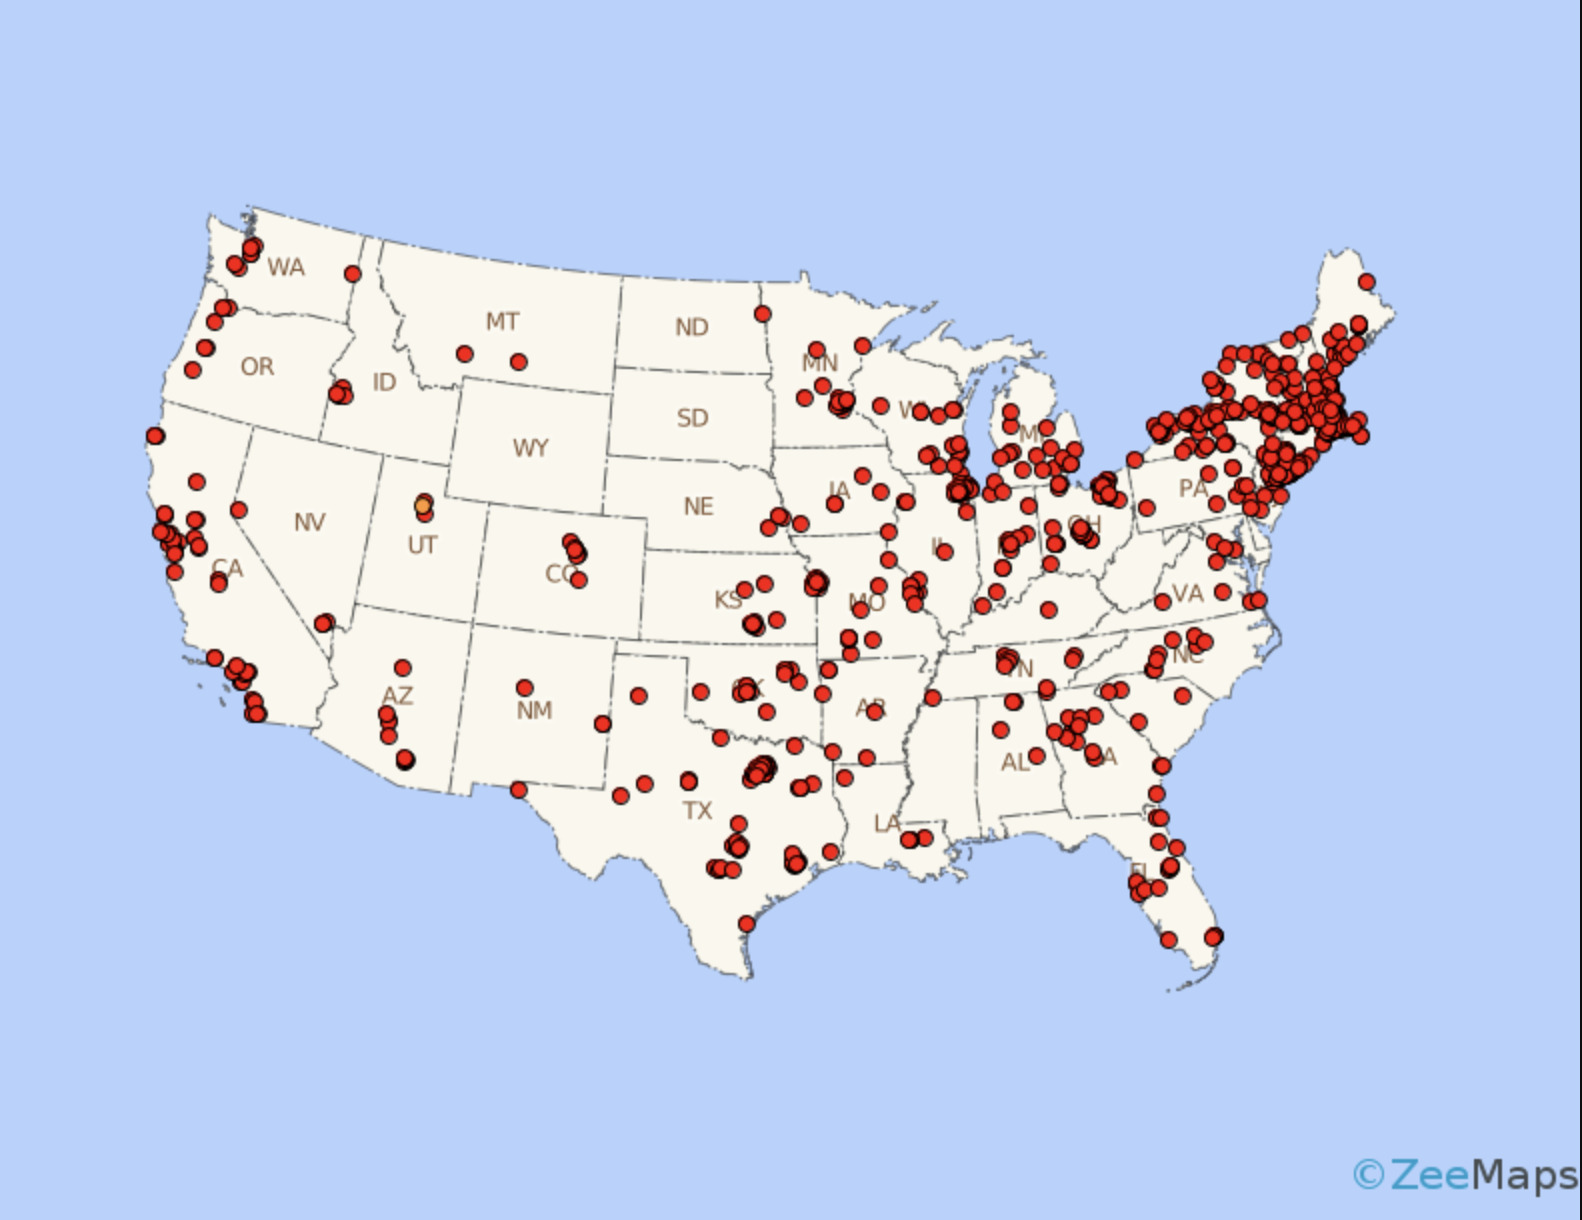
Dot density
Are maps that show information with dots.
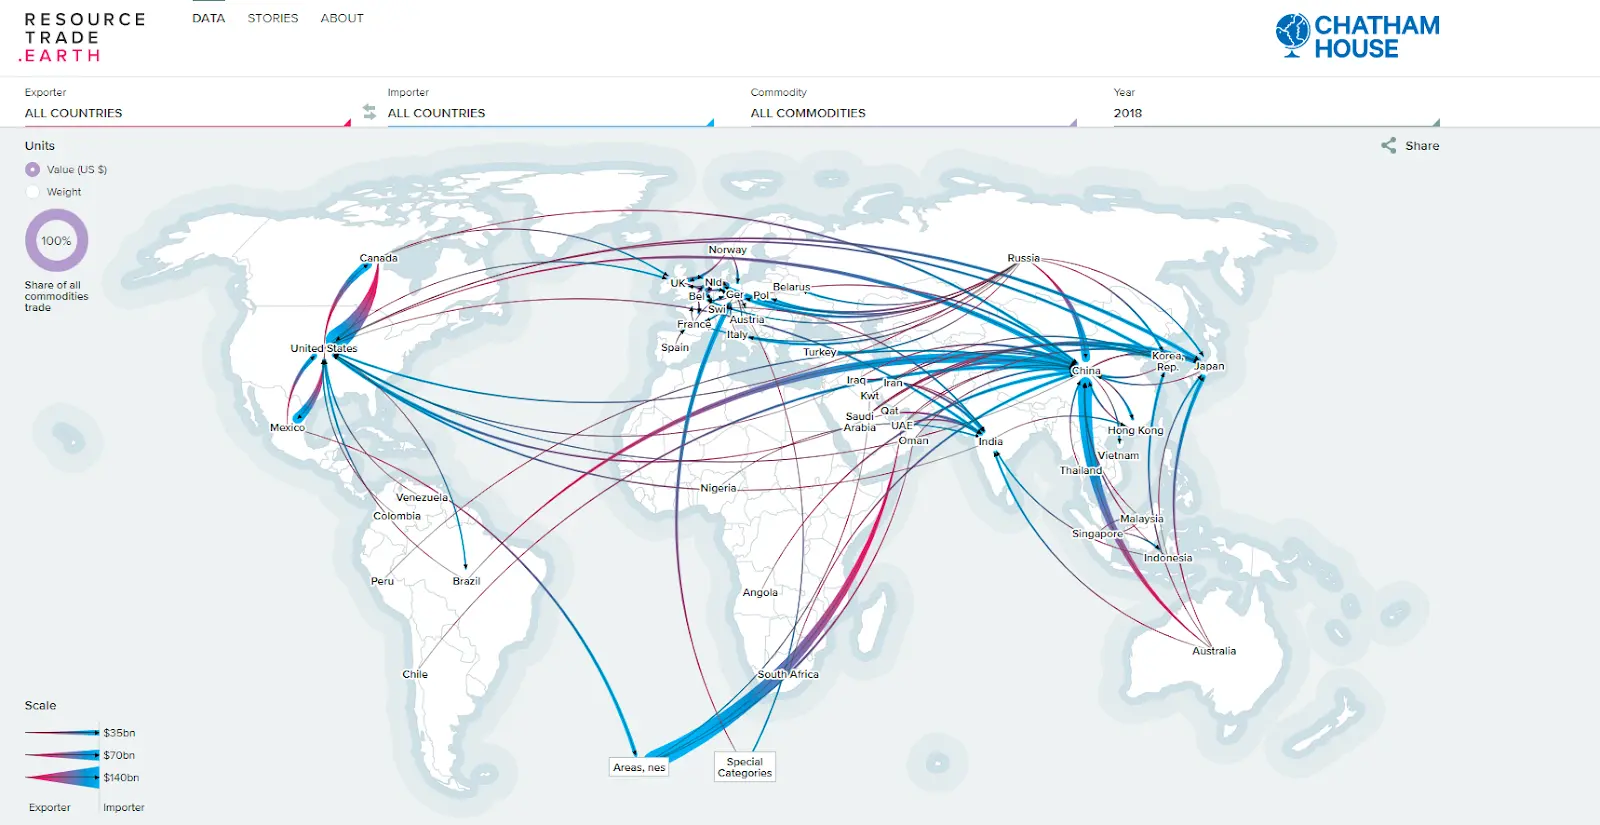
Flow line
Moment of things for one place to another using arrows, the thicker, the arrows, the more movers while the thinner arrow could represent less movers
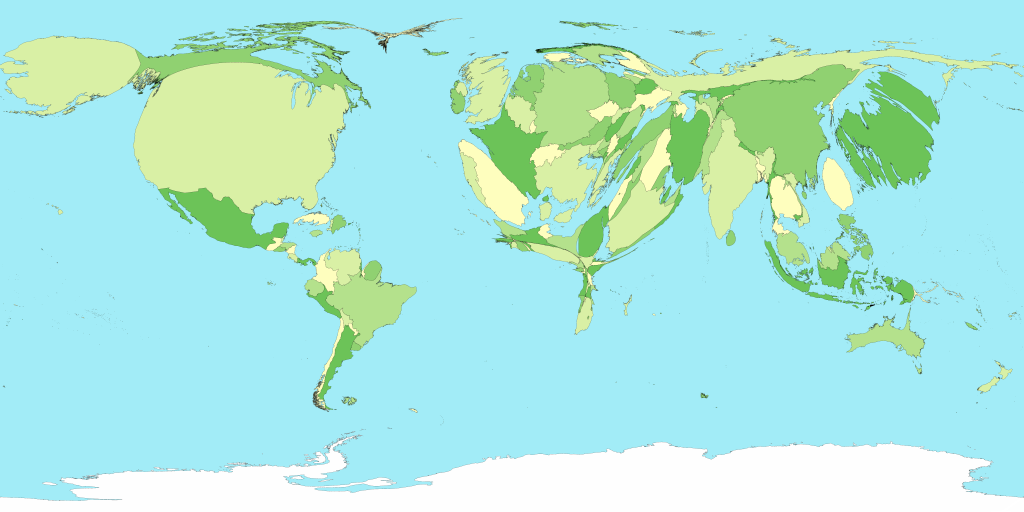
cartogram map
The sort the shape of the maps to dissect information they are trying to show
Mental map
Using your brain to find out where you are and how to get there
Another break breath
You got this if it’s past or it is 11 get ur ass to bed
Bed time
You are gonna do great skip this if this is your first break once on you second one go to bed unless it’s the afternoon then keep going!!!