PHCS Exam 1 Objectives
1/62
There's no tags or description
Looks like no tags are added yet.
Name | Mastery | Learn | Test | Matching | Spaced |
|---|
No study sessions yet.
63 Terms
Define pharmacoepidemiology
Discipline that seeks to evaluate the benefits and risks of medications as they are used in routine practice. It draws on observational analysis of the medications taken by large numbers of patients (sometimes in the millions)
What tools are used to conduct pharmacoepidemiology studies?
Secondary data (often electronic databases from insurance claims, electronic health records, national health survey data), computational hardware and software to analyze (SAS, Stata, SPSS, R, Python, etc.), Use of biostatistics to address confounding and bias (overcome weakness of the study design, no randomization)
What is exposure?
The independent/explanatory variable
Can be pharmacotherapy, health care intervention (like MTM services), individual risk factors (like smoking), or environmental factors (like living in a polluted area)
What is outcome?
The dependent variable
Can be disease, adverse side effect, survival, drug adherence, etc.
Why pharmacoepidemiology?
Because the FDA is mainly focused on the pre-marketing studies, planned data collection about drug efficacy and safety occurs most exclusively in highly protocolized care environments (e.g., RCTs)
Most of the drugs in RCTs disproportionately occur before the drug approval process, but once the drug is approved there is little incentive for the manufacturer to conduct RCTs due to the regulation involved. After approval, it creates shortcomings about not having enough data post-marketing. Pharmacoepidemiology can help to fill the spaces of missing data after the drug is approved.
What is efficacy?
The effect of a healthcare intervention (e.g., drug) in carefully controlled environments such as randomized controlled trials (RCTs)
What is effectiveness?
The effect of a healthcare intervention (e.g., drug) as performed in real world conditions in which the diagnosis may be less certain than in clinical trials, there may be several comorbid clinical conditions, and the patient may be taking other drugs concurrently
What is the key difference between experimental studies and observational studies?
Experimental studies (RCTs) are randomly assigned by the researcher (open-label, single- or double-blind)
Observational studies (pharmacoepidemiology) are uncontrolled by the researcher (self-controlled by the patient) and non-interventional
What are the advantages and disadvantages of experimental studies?
- Advantages: casual effect of exposure (e.g., drug) can be estimated (efficacy), reduced bias/confounding
- Disadvantages: omission or underrepresentation of key populations (complex elderly, pregnant women, children), other inclusion/exclusion criteria, limited size, atypical physicians/study setting/highly protocolized care, short duration (sometimes just 8-16 weeks, even for long term medications), use of a surrogate measure of efficacy, comparator may be placebo (active comparison would be better)
What are the advantages and disadvantages of observational studies?
- Advantages: reflect more naturalistic circumstances, effectiveness in real world practice can be estimated
- Disadvantages: non-randomization can lead to bias
Experimental studies are also called?
Randomized controlled trials (RCTs)
Observational studies are also called?
pharmacoepidemiology studies
What are the study designs in the order of establishing internal validity?
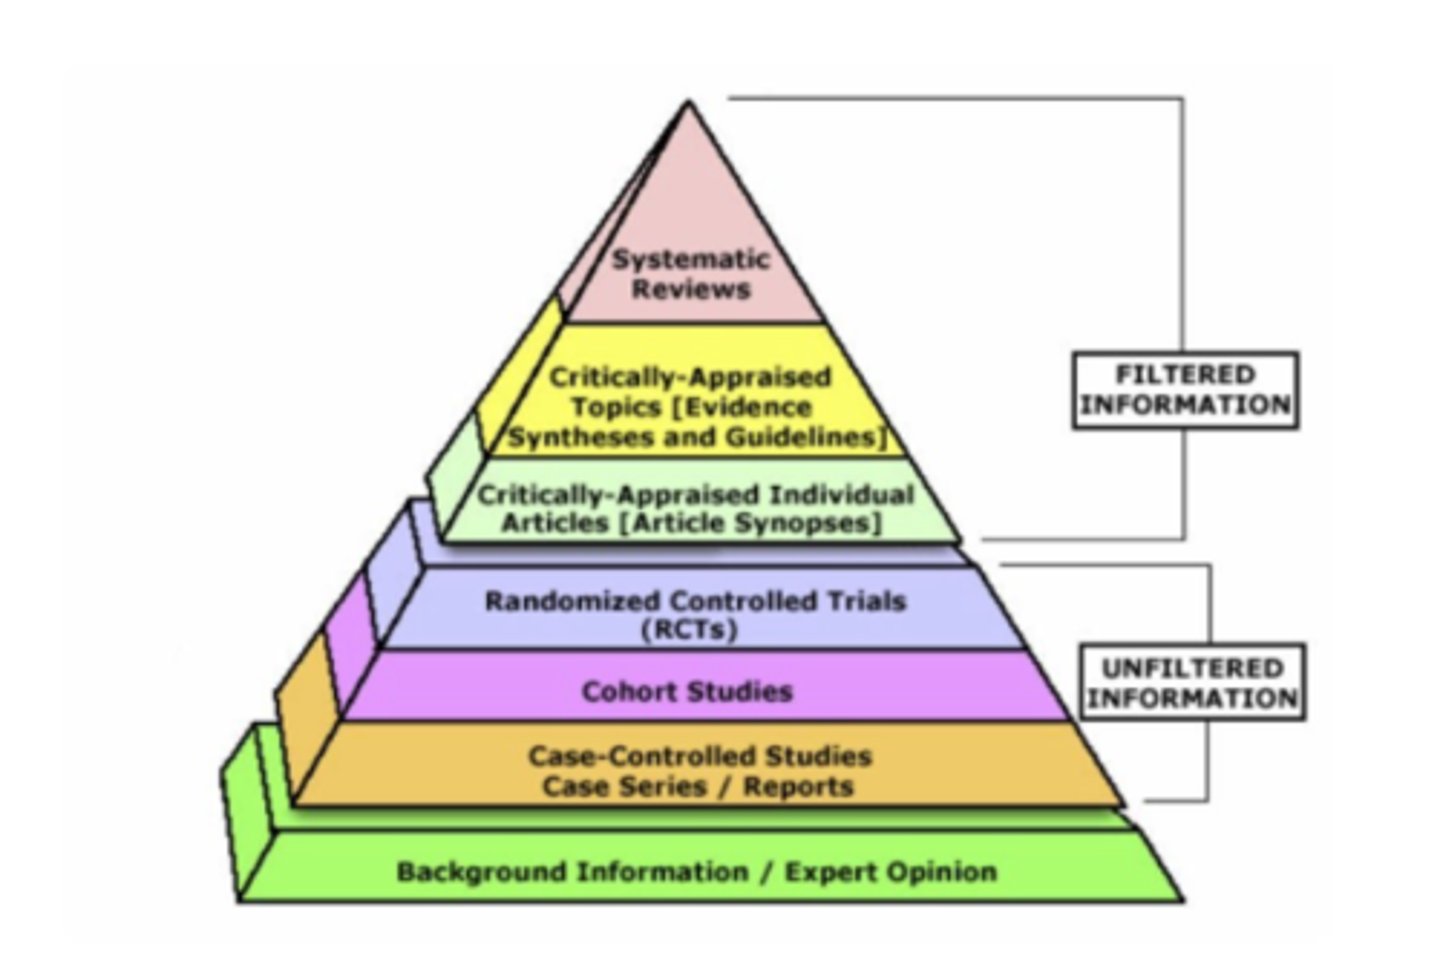
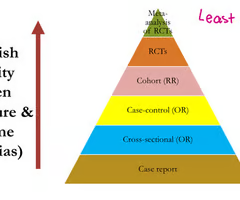
- case reports are on the bottom with the most bias, while meta-analysis of randomized controlled trials is at the top of the pyramid and shows the least bias
From the bottom: case report -> pharmaco-epi (observational) -> RCTs -> meta-analysis of RCTs

A study was conducted to compare INRs before and after patients take a proton pump inhibitor (e.g., omeprazole). INR (international normalized ratio) is a measure of patient's biologic response to anticoagulants such as warfarin. In this study, what is the exposure and what is the outcome?
Exposure: taking PPI
Outcome: change in INR
Distinguish "population" and "sample"
- population mean = true mean
- The population is impossible to know for sure. We estimate true (population) values using statistics, which comes with uncertainty. As a result, the estimated population mean is expressed as a range (95% confidence interval)
- Sample: what we have as data (expressed as a point value average, sample mean)
How do you tell if the null hypothesis is u1=u2?
There are two 95% confidence intervals (before and after). The null hypothesis is rejected if the two 95% confidence intervals do NOT overlap, meaning we are 95% confident that the means are significantly different.
How do you tell if the null hypothesis is u1-u2=0?
There is one 95% confidence interval interval for a change in the data values. The null hypothesis is rejected if 0 is not in the range. If 0 is included as a possibility in the range, we fail to reject the null hypothesis.
What does it mean when a null hypothesis is rejected?
The null assumes that there is no difference in population means between groups. If the null is rejected, we can say that there is a significant difference between the populations.
What does it mean when we fail to reject the null hypothesis? Does it indicate the two population means are the same?
If we fail to reject the null hypothesis, that means we cannot say with confidence that the populations are different, but this does NOT mean that the two populations are the same. There is a possibility that the population means are different and a possibility that the means are the same (not much can be concluded).
How do you identify significant variables if you are given a population mean (presented as a range)?
If 95% confidence intervals do not overlap: although we do not know the true mean as a point value, we can be confident that they are different (the null is rejected)
If 95% confidence intervals overlap, the true mean may or may not be the same, but we really cannot tell
How do you identify significant variables when given a p-value?
The data is significant if less than or equal to 0.05
What are the two indicators of statistical significance?
you need either a 95% confidence interval OR p-value to determine statistical significance
At a 5% significance level, under what condition is the difference significant?
95% confidence interval: significant if the interval does not include the null hypothesis condition
P-value: significant if less than or equal to 0.05
What is alpha?
The probability that there is no difference, but we incorrectly conclude that there is a difference (false positive, type I error)
What are the phrases that are used interchangeably with "5% significance level"?
- 5% significance level
- significantly different at 95% confidence level
- alpha = 0.05
The smaller the p-value....
the more significant the results
- p=0.001 reflect a more significant difference than p=0.01
- The p-value gets smaller as the test statistic calculated from your data gets further away from the range of test statistics predicted by the null hypothesis
What is p-value?
P-value is a number calculated from a statistical test, that describes how likely you are to have found a particular set of observations if the null hypothesis were true
What are the two broad categories of validity?
Internal validity
External validity
Define internal validity
Internal validity concerns biasedness (surveillance bias is related to internal validity)
For example, internal validity concerns whether Drug A (exposure) is truly responsible for causing dry mouth (outcome)
How do you apply internal validity when reading pharmacoepidemiology studies? (In other words, what questions do you ask with respect to internal validity when critiquing an article?)
- Is the investigators conclusion about the exposure and outcome relationship correct?
- Is the conclusion unbiased?
How do you apply external validity when reading pharmacoepidemiology studies? (In other words, what questions do you ask with respect to external validity when critiquing an article?)
- Is the study finding applicable to a population other than those included in the study?
- Is the conclusion generalizable to other populations?
Define external validity
external validity concerns generalizability Ius the effect of antipsychotics on type II diabetes observed in the study applicable to other populations?)
For example, External validity concerns whether the Drug A and dry mouth relationship is generalizable to African Americans.
Define detection bias
Surveillance bias = detection bias - it occurs when one group is followed more closely than the other group. This could lead to an outcome being diagnosed more often in the more closely followed group, but not because it truly occurred more often in that group
Know the example of detection bias provided in class
Before PPIs were initiated, the INR was taken every 4 weeks. After PPI initiation, INR was taken every week. Because of this increased frequency, the researchers are ore likely to detect changes in INR
The comparison between before and after PPI is not fair and may lead to bias
Define cohort study
Subjects are classified on the bases of the presence of exposure and then followed for a specified period of time to determine the development of disease in each exposure group
What are the strengths and limitations of a cohort study?
Strengths: it establishes the sequence of events (temporal relationship)
Limitations: it is inefficient for rare diseases (outcomes), can be very expensive and time consuming (prospective cohort)
What is a prospective cohort study?
Identification of the outcome-free cohort begins in the present and the subjects are followed into the future (still observational)
What is a retrospective cohort study?
These use data already collected for other purposes (claims, HER, etc.)
What is a case-control?
Subjects are classified on the basis of the presence of outcome and then determine the exposure status of each individual within both groups (it looks back to what has happened in the past to cases and controls)
What are the strengths and limitations of a case-control study?
Strengths: useful to study rare disease
Limitations: difficult to find a "comparable" control group (selection bias), subject to recall bias
What is a cross-sectional study?
It looks at a sample of a population of interest at a given point in time (usually the present) - snapshot of exposure and outcome in a group of people
What are the strengths and limitations of a cross-sectional study?
Strengths: well-suited to provide estimates on prevalence of exposure or outcome, best used for developing hypothesis for future examination
Limitations: often hard to infer casual relationship because they can't establish the sequence of events
What is an example of a cohort study?
Participants are categorized based on their diets (high fiber diets and normal diets) and then tested for the prevalence of colon cancer
What is an example of a case-control study?
Participants are categorized based on whether or not they have gastrointestinal bleeding. Then they identify whether or not they were exposed to aspirin.
Participants are categorized based on outcome. Those with the outcome of interest are the case, and those without the outcome of interest are the control group.
What is an example of a cross-sectional study?
Observing individuals who have a peptic ulcer and drink milk, don't have a peptic ulcer and drink milk, don't drink milk and have a peptic ulcer, and don't drink milk and don't have a peptic ulcer. Researchers might see a correlation based on different exposures, which can give idea if they are associated
The exposure and outcome are determined simultaneously, and each subject is looked at only at one point in time. These types of studies are a good argument for the development of a hypothesis.
Define recall bias
Those individuals with the outcome may recall certain exposures more clearly than controls, simply because they thought about what what could have caused their disease.
What study is prone to recall bias?
Case-control studies
How do you calculate relative risk?
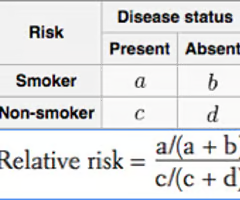
(exposed with outcome/total exposed) /(unexposed with outcome/total unexposed)

How do you calculate odds ratio?
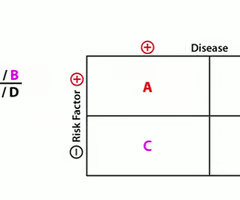
(exposed with outcome/exposed without outcome) / (unexposed with outcome/unexposed without outcome)

Which study design can be used to calculate relative risk (RR)?
Cohort studies are the only studies that can be used to calculate relative risk
(study subjects are first selected based on exposure, and then followed to see if they develop the outcome)
Which study designs can be used to calculate odds ratio?
Case-control studies, cross-sectional studies, and cohort studies can be used to calculate odds ratio.
While probability is a preferred measure, cohort studies could also be used to calculate odds.
What are the three necessary elements of interpreting RR and OR?
1) "compared to"
2) "on average"
3) more likely/less likely (for RR you can say how much more or less likely, but not for OR)
What does an RR or OR of 1 mean?
If RR/OR = 1, there is no association (no difference between exposed and unexposed with respect to the risk of disease)
What does an RR or OR <1 mean?
If RR/OR < 1, there is a negative association (the exposed group has a lower risk of disease)
What does an RR/OR > 1 mean?
If RR/OR > 1, there is a positive association (the exposed group has a higher risk of disease.
Interpret the following:
A cohort study compared statin users and non-statin users to see which group was more likely to develop stroke. RR = 0.2
Compares to statin non-users, statin users were, on average, 5 times less likely to develop stroke.
Interpret the following:
A cohort study compared smokers and non-smokers to see which was more likely to develop lung cancer. RR = 2
Compared to non-smokers, smokers are, on average, 2 times more likely to develop lung cancer.
Interpret the following:
In a cross-sectional study, smokers and non-smokers were observed to see which group was more likely to develop asthma. OR = 2
Compared to non-smokers, smokers are more likely to develop asthma, on average.
(Because this study determined odds ratio, we cannot quantify how much more likely.)
In general, which measure estimates the impact of exposure more accurately? (between RR and OR)
Relative risk (RR) is a better measure, because it is the probability of developing outcome from exposure.
How does the less accurate measure estimate the impact of exposure as compared to the more accurate measure (RR vs. OR)?
When RR is not compatible, odds ratio (OR) may be used.
OR over-estimates the impact of exposure on outcome.
n what circumstances does the less accurate measure approximate the more accurate measure? (OR vs. RR)
OR is the less accurate measure.
If the outcome is rare, OR approximates RR.
What are the study designs in order of establishing internal validity?
Most bias: case report
cross-sectional (OR)
case-control (OR)
cohort (RR)
RCTs
least bias: meta-analysis of RCTs

Under what condition is the RR or OR statistically significant?
The null assumes no difference, no association, and no impact. RR (or OR) is statistically significant if we can reject the null.
H0 = RR (or OR) = 1
H0 is rejected if 1) p<0.05 and 2) 95% CI does not include the null condition.
RR (or OR) is significant if p<0.05 or the 95% CI does not include 1 (it is more common to report 95% CI when using RR or OR)