7 full
1/43
There's no tags or description
Looks like no tags are added yet.
Name | Mastery | Learn | Test | Matching | Spaced | Call with Kai |
|---|
No analytics yet
Send a link to your students to track their progress
44 Terms
Rol van monitoring in systeembeheer (slide 3)
=
3
= geen luxe maar de kern van sysadmin-werk: het early warning system dat systemen available, performant en reliable houdt
beperkt impact van outages door vroege detectie
ondersteunt security, compliance en auditing
→ doel: problemen detecteren vóór de gebruiker ze merkt = proactief i.p.v. reactief
Wat gebeurt er zonder monitoring? (slide 4)
= falen blijft onopgemerkt → gebruikers beginnen pas te klagen als het te laat is
resource exhaustion (CPU, RAM, disk) → crashes
security-incidenten blijven onontdekt
troubleshooting wordt trager en guess-based
→ downtime, productiviteitsverlies, hogere kosten
→ in de cloud (pay-as-you-go) = onnodig resourceverbruik vertaalt direct in een hogere factuur
j
e
m
o
e
d
e
r
j
e
m
o
e
d
e
r
(lees)
= inbreuk bij Amerikaans kredietbureau die 78 dagen onopgemerkt bleef
~143M Amerikaanse, 14M Britse, 8000 Canadese records (namen, SSN, geboortedata, adressen)
oorzaak blindheid: SSL-certificaat ~9 maanden verlopen → door dat verlopen certificaat konden security monitors uitgaand verkeer niet meer decrypten/scannen, dus verdachte activiteit bleef verborgen Les: je moet alerts krijgen als je monitoringsysteem zélf niet meer werkt — anders blind spot zonder het te weten. (EXAMEN)
Why monitoring matters (slide 7)
=
4
= monitoring voorkomt dat kleine issues uitgroeien tot outages
tonen symptomen lang vóór de failure
signs: hardware-degradatie, vollopende disks, hoge latency
verlaagt MTTD (mean time to detect) → snellere detectie = kleinere blast radius
helpt root cause: logs + metrics + traces pinpointen de fout snel
→ ontbrekende monitoring = catastrofale blind spots (cf. Equifax);
observability cruciaal naarmate systemen cloud-native worden
Vijf domeinen van monitoring (slide 8)
= waar je naar kijkt, verdeeld over vijf lagen
Network — connectiviteit en performance
Infrastructure — de host (CPU, RAM, disk)
Application/Service — draait de service, hoe gezond?
Log monitoring — inzichten uit logs
Security monitoring — threats en anomalieën → samen: dekking van fysieke laag tot applicatielaag
CI/CD - DevOps cyclus (slide 9)
= monitoring is een integraal deel van de oneindige DevOps-lus, geen los stuk achteraf
- de lus: Plan → Code → Build → Test → Release → Deploy → Operate → Monitor → (terug naar Plan) → inzichten uit Monitor/Operate voeden de volgende Plan-fase: monitoring sluit de feedbackloop
CrowdStrike outage (juli 2024) (slide 10-11)
= een foutieve geautomatiseerde Windows-update legde ~8,5M systemen plat (BSOD)
- real-time monitoring door cloud providers maakte snelle publieke meldingen mogelijk
- tijdlijn: 04:09 update → Azure-VMs crashen meteen → 05:27 rollback → 06:48 Google Compute Engine meldt → 07:15 Google bevestigt oorzaak → 09:45 fix, veel handmatige interventie → les: testen is een integraal deel van monitoring; trage MTTD = miljoenen systemen plat Don't be Bart: een outage is nooit de grootste ooit, enkel de grootste tot nu toe. (EXAMEN)
Reactief vs. proactief (slide 12)
= fixing things when they break tegenover vooraf ingrijpen
- Reactief: langere outages → hogere kosten → ongelukkige klanten
- Proactief: minder verrassingen, stabiele operaties, tevreden gebruikers → spectrum: Pro-active → Predictive → Reactive; hoe verder rechts, hoe lager de performance en hoger de risk/cost. Je wil zo links mogelijk zitten
4 results van goeie monitoring (slide 13)
= vier concrete opbrengsten
Visibility — real-time zicht op health van servers/netwerken/apps (wat gebeurt er nú?)
Trend analysis — capacity planning (bv. disk over 40 dagen vol) + vroege degradatie
Alerting — detectie van hoge CPU, dode services… die enkel de juiste mensen bereikt vóór gebruikers geraakt worden (anders alarmmoeheid)
Root cause support — wanneer begon het? welke resource verzadigde eerst?
Reliability engineering + 3 performance goals
= systemen moeten available, resilient en performant zijn onder verwachte én onverwachte omstandigheden; monitoring is de fundering
SLI (Service level Indicator) = wat je meet: latency, error rate, throughput
SLO (Objective) = intern doel: bv. 99,9% success rate over 30 dagen
SLA (Agreement) = contractuele belofte aan de klant → ken de marge: SLA ligt meestal lager dan SLO als veiligheidsbuffer (bv. SLO 99% intern, SLA 95% naar klant) — speling vóór contractbreuk. (EXAMEN)
Incident detection & response (MTTD/MTTI/MTTR) (slide 15)
= tijdstraject van een incident: DETECT → IDENTIFY → FIX → VERIFY
MTTD (Detect) — tijd tussen ontstaan fout en detectie;
spot resource saturation,
component failures,
network degradation,
anomalous traffic,
failed deployments
MTTI (Identify) — tijd om de root cause te vinden via metrics/logs/traces
MTTR (Repair) — totale tijd van Issue Start tot Issue End; doel: zó kort dat de eindgebruiker niets merkt → metrics = wanneer veranderde iets, logs = wat gebeurde, traces = waar zit de bottleneck. (EXAMEN)
Post-incident reviews (slide 16)
= incidenten als leermoment;
= monitoringdata is het ruwe bewijsmateriaal
alle data (metrics, logs, traces)
bepaalt root cause,
precieze timeline,
lange-termijnfixes
→ die data is ook bewijs richting providers (bv. AWS) om compensatie te claimen bij SLA-breach
→ uitkomsten: betere alerting, verbeterde architectuur, aangepaste SLOs
White-box vs. black-box monitoring
= twee perspectieven op een systeem
- White-box = op interne metrics die het systeem zelf blootlegt (logs, JVM Profiling Interface, HTTP-handler met interne stats) → kijkt binnenin, meestal agent-based
- Black-box = testen van extern zichtbaar gedrag zoals een gebruiker het ziet (werkt de website?) → kijkt van buitenaf → elke gebruiker doet onbewust aan black-box monitoring: als de site niet laadt, meet hij extern gedrag. (EXAMEN)
Symptoms vs. causes
= onderscheid tussen What (symptoom) en Why (root cause) — dé kern van goede monitoring
- HTTP 500/404 → cause: database weigert connecties / gecrasht
- trage responses → cause: CPU overbelast of packet loss (beschadigde kabel)
- private content wereld-leesbaar → cause: software push vergat de ACLs → goed alerten = maximum signal, minimum noise: alert op de cause, niet op elk symptoom. (EXAMEN)
Types of monitoring
= vijf domeinen, elk een ander deel van de stack
- Infrastructure — host: CPU/load, RAM/swap, disk I/O, netwerkinterfaces
- Network — latency, packet loss, throughput, ICMP/SNMP, BGP/OSPF, bandwidth
- Service/Application — draait het proces? response time, error rate, port/process checks, dependency health (API, DB, cache)
- Log — errors, warnings, suspicious patterns, audit events, anomaly detection
- Security — intrusion attempts, unauthorized access, verdachte network flows
Three pillars of observability + →
= software is verspreid over servers/microservices → drie datatypes nodig voor volledige zichtbaarheid
Metrics — kwantificeerbare data, cijfers over de tijd (CPU, RAM)
Logs/events — gedetailleerde, getimestampte verslagen van gebeurtenissen binnen een span
Traces — het volgen van een request door een distributed system (essentieel voor microservices)
→ samen tonen ze huidig gedrag én laten ze toekomstige problemen voorzien; je hebt alle drie nodig. (EXAMENKERN)
Metrics - drie soorten
= verzamel de juiste data om snel perf-issues te onderzoeken
- Work metrics — output van de service: throughput, success, error, performance
- Resource metrics — verbruik onderliggende resources: utilization, saturation, error, availability
- Events — discrete gebeurtenissen: code changes, alerts, scaling events → work metrics zeggen of de service zijn job doet, resource metrics of er genoeg capaciteit is
The Four Golden Signals (Google)
= de vier kernsignalen die je minstens moet meten per service
- Latency — tijd om een request te bedienen; meet succes- én faal-requests apart!
- Traffic — hoeveel vraag krijgt het systeem? (app-specifiek)
- Errors — rate gefaalde requests: expliciet (HTTP 500) of impliciet (200 met foute inhoud)
- Saturation — hoe vol zit de service? (memory, I/O) → kan ze 2x of 10% meer verkeer aan? (EXAMEN)
Logging
wat is logging
4 types of logs
= continue verzameling, aggregatie en analyse van logdata — beantwoordt wat gebeurde er binnen het systeem?
complementeert metrics met event-info
context/root-cause na incidenten;
ondersteunt security-onderzoek (auth attempts)
auditing/compliance (ISO); één van de drie pijlers
Vier bronnen van logdata:
System logs — OS/kernel/boot, processen start/stop, hardware events, reboots
Application logs — error messages, stack traces, user actions, events
Security logs — authentication attempts, firewall events, IDS-events
Network logs — router/switch (SNMP, syslog), DHCP/DNS, gateway/proxy
Logging
key concepts (4)
pipeline / wat na collection
= hoe je logs bruikbaar én operationeel maakt Key concepts:
Logging levels: DEBUG → INFO → WARNING → ERROR → CRITICAL/FATAL
Structured (JSON/key-value, automatiseerbaar) vs unstructured (plain text, moeilijk parsen)
Retention: hoe lang bewaren? kost stijgt met log level + tijd; compliance
Collection: lokaal (verlies-risico) vs centralized (correlatie, lange termijn) vs cloud-native (sidecar agents, Kubernetes)
Pipeline:
→ indexing & search (errors laatste 10 min)
→ parsing & enrichment (regex/JSON + metadata)
→ correlation (request-/correlation-IDs)
→ alerting (event-driven, threshold-based, anomaly)
Traces - wat, spans & IDs
= de end-to-end reis van één request door een distributed system
= toont waar tijd verloren gaat, welke services betrokken zijn, waar errors optreden
→ onthult bottlenecks en hoe services in echte workflows samenwerken
Trace = volledig pad van een request, bevat meerdere spans
Span = één operatie (function call, DB query, API call, message queue) met start/end-timestamp, status (success/error), attributes (HTTP method, query duration), events (exceptions, retries)
Trace & Span IDs = unieke IDs die spans correleren over services via parent-child connections = context propagation
Traces - sampling strategies
= full trace data is enorm → je bewaart maar een deel
- Head sampling — beslissing aan het begin (bv. hou 10%) → risico: je mist net de error verderop
- Tail sampling — beslissing ná afloop → hou enkel interessante traces (bv. enkel als er een error optrad) (preferred)
- Adaptive sampling — hou méér traces tijdens anomalieën → tail wint: bespaart opslag maar vangt wél alle relevante fouten. (EXAMEN)
Problem detection - flapping, history & hysteresis
= naïeve drempels op de laatste meting geven valse alarmen → gebruik de geschiedenis
- Flapping: cpu.load.last() > 5 → te gevoelig → waarde wiebelt rond de drempel → alert constant aan/uit → alarmmoeheid
- Fix met history: cpu.load.min(10min) > 5 → conditie moet 10 min aanhouden vóór het een probleem is
- Hysteresis (recovery): verdwenen != opgelost; gebruik verschillende condities voor probleem en herstel — bv. alert bij
Anomalies
= afwijking detecteren door een norm uit het verleden te declareren en nieuwe data ertegen te vergelijken
- bv. transacties/sec laatste uur is 2x lager dan dezelfde periode vorige week → anomalie → baseline is relatief (vergelijk met verleden), niet een vaste absolute drempel
Trend prediction & problem forecasting
= van detecteren naar voorspellen — de echte proactieve stap
- trek een trendlijn (lineaire regressie) door een dalende metric en bereken wanneer ze de kritieke drempel kruist (bv. disk vol, of onder 10%) → je krijgt bv. nog 2 uur waarschuwing vóór het probleem optreedt, zodat je kan ingrijpen voor er iets breekt
Hoe reageren op problemen?
= van automatische actie tot escalatie, met balans als doel
balans vinden tussen veel fouten → users will ignore emails en te weinig errors → systeem is al aan het falen
reacties: auto-resolutie, alerts naar user(group), helpdesk-tickets — onbeperkt veel opties
~95% van de problemen lost zich automatisch op door de service te herstarten
escalatieladder (timeline):
0min Repeated Email → immediate reaction
SMS+ticket → 5min → delayed reaction
Service restart → 10min → notification and autoatic action failed
SMS to manager → 15/30min → repeated notifs
escalatie naar Boss → balans: te veel alerts = genegeerd; te weinig = systeem ligt al plat. (EXAMEN)→ excalation to new level
Te veel problemen? Event correlation
= bij een storm van alerts wil je niet 100 losse meldingen
- event correlation module doet deduplication, event filtering, root cause analysis → bundelt gerelateerde alerts tot één onderliggende oorzaak (bv. één switch down → 50 hosts unreachable = 1 incident, niet 50)
Agentless vs. agent-based
def
voor en nadelen van beide (telkens 4)
= twee manieren om data van een host te verzamelen
Agentless (remote, via SNMP/SSH/WMI/API, polling):
remotely, zonder locale software
hoe: verbind via netwerk protocols → at intervalls pollen
+ :
geen installatie (snelle onboarding),
lage overhead,
minder resource gebruik
ideaal voor devices waar je niets op kan installeren (IoT, printers, firewalls, switches)
- :
minder rijke data,
afhankelijk van netwerk,
firewall/ACL-complexiteit,
polling-intervallen
Agent-based (geïnstalleerde software per host, verwerkt lokaal):
installed software on each monitored host
+ :
rijke metrics,
low-latency,
betrouwbaar,
customizable
- :
installatie + onderhoud,
security-overwegingen,
resource overhead,
version drift. (EXAMEN voor/nadelen)
Push vs. pull based monitoring
= wie initieert de datatransfer?
Push (service stuurt zelf metrics via HTTP/gRPC/UDP):
each monitored services pushes metrics to monitoring system
werkt:
door firewalls/NAT (enkel outbound nodig),
goed voor containers/serverless,
event-driven,
flexibele frequentie
- :
moeilijk te checken of systeem leeft → daarom heartbeats (bv. elke 60s),
metric floods,
gaten moeilijk detecteerbaar
Pull (server scraped targets op interval — standaard modern, bv. Prometheus):
the monitoring system periodically scrapes metrics from targets
werkt:
monitoring system connects to metrics endpoint
scraping at sceduled intervals
common in modern systems
+ :
server bepaalt timing = controle over netwerkbelasting,
host-failures makkelijk detecteerbaar,
rate limiting,
service discovery
- :
vereist inbound access,
slecht voor kortlevende jobs,
schalen vereist sharding. (EXAMEN voor/nadelen)
Monitoring architectuur
= de typische keten van bron tot weergave
- monitored targets (met checks) → monitoring backend (verzamelt/slaat op) + management system (analyseert, alerts) + orchestrator (onderneemt actie) → web client voor de gebruiker → de orchestrator kan de lus sluiten door automatisch te reageren (bv. herstart, schaal bij)
Monitoring vs. logging vs. observability
= drie begrippen die vaak verward worden
Monitoring = tracks predefined metrics om system health te beoordelen (checks op bekende problemen)
Logging = verzamelt gedetailleerde event records om gedrag te analyseren
→ Observability = geeft inzicht in performance en interne toestand; metrics + logs + traces samen laten je ook onbekende problemen begrijpen en vragen stellen die je vooraf niet bedacht had
Waarom standaardisatie nodig is
= software is verspreid over talloze servers/microservices → handmatig alles monitoren is onhaalbaar
software observability = drie datatypes verzamelen
Metrics: quantifiable peices of data,
Traces: records of requests and interactions made of spans
Logs: specific occurrences within a span
to show how a system is behaving currently and can foresee potential issues in the future
→ de cloud-community zette open-source projecten op om het verzamelen van die drie pijlers te standaardiseren zonder vendor lock-in
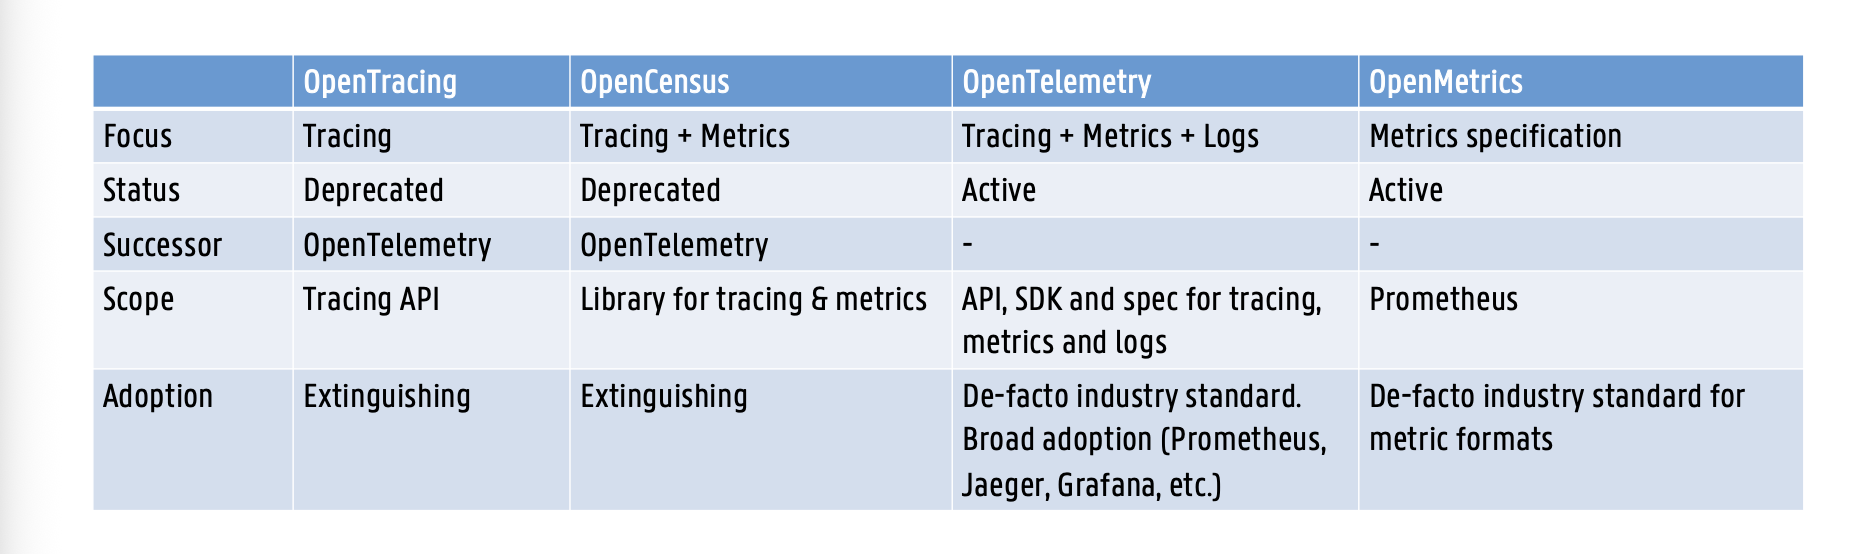
OpenTracing
=vendor-neutrale APIs en instrumentatie puur voor distributed tracing
geen language-, vendor- of product-lock-in
doel: standaardiseren hoe devs tracing toevoegen zonder vast te zitten aan een specifieke tool (Jaeger, Zipkin) → archived, gemerged in OpenTelemetry
Jaeger
= een concrete tool die distributed traces visueel weergeeft (geen standaard, maar een backend/UI)
- toont de spans van een request als een waterval-tijdlijn (welke service, hoe lang, parent-child) → illustreert hoe enorm groot en gedetailleerd één enkele request-trace kan zijn (tientallen spans over meerdere services)
OpenCensus
= de tweede stap: traces + metrics verzamelen, gemaakt door Google (https://opencensus.io)
- captureert distributed trace-info én metrics en exporteert naar backends (Prometheus, Zipkin) → archived, gemerged in OpenTelemetry
OpenTelemetry = OpenTracing + OpenCensus
= de samensmelting: één unified observability framework voor tracing, metrics én logs
unified spec (uit OpenCensus + OpenTracing) + APIs + libraries + SDK voor distributed tracing en metric collection
ondersteunt meerdere tools/backends (Jaeger, Prometheus, Grafana); open-source, vendor-neutraal, actief ontwikkeld
OpenMetrics
= een specificatie (géén API of SDK!) om metrics bloot te leggen in een Prometheus-consumeerbaar formaat (https://openmetrics.io)
- definieert het formaat en de datastructuur (labels) voor consistente metric-collectie over systemen heen
- OpenTelemetry kan metrics in OpenMetrics-formaat exporteren → zeer hoge industrie-adoptie, specifiek voor metric-formaten. (EXAMEN)
Microsoft SCOM
What it is
Microsoft’s closed-source enterprise monitoring solution.
It tracks the health, performance, and availability of multiple computers, devices, and services from a single, centralized console.
architectuur
management server: administering the management group en communicatie met db
operational db = sql server dat alle config data voor de management group heeft + monitoring data
data warehoude db = sql server dat monitoring + alerting data → historische
Strengths
Native Windows Integration:
It is the go-to choice if your company operates heavily within the Microsoft/Windows ecosystem.
Highly Scalable:
Distributed deployments are robust and can support monitoring for up to 15,000 agents.
High Availability: Management servers can be grouped into resource pools;
if one fails, the others automatically take over its tasks.
Weaknesses
Ecosystem Lock-in:
Because it is closed-source and tailored for Windows, it is not the best choice if you rely heavily on Linux (e.g., Ubuntu) environments.
Administrative Overhead:
It can require a lot of configuration to prevent alert noise and flapping.
Being Phased Out for Cloud:
Microsoft has actually killed off SCOM for monitoring its own internal cloud workloads, favoring Azure Monitor instead to reduce overhead. However, SCOM remains highly relevant for strictly on-premises data centers.
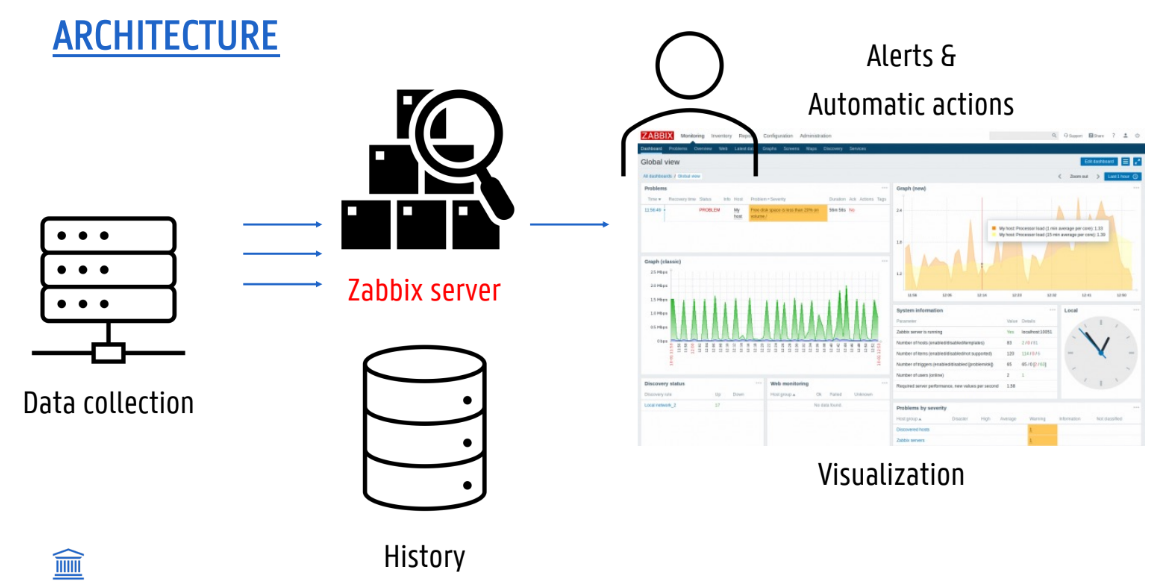
Zabbix
What it is
= enterprise open-source monitoring solution to track the status of networks, servers, applications, and hardware.
How it works
Data Collection (Pull & Push): Zabbix utilizes both methods.
With a passive agent (Pull), the server requests the metrics.
With an active agent (Push), the agent asks the server for a list of checks to perform and then actively pushes the gathered data to the server.
Auto-discovery: automatically find new servers and network devices and begin monitoring them.
Strengths
high performance & capacity
auto discovery
agentless
email notifications
secure user authentication
kk veel monitoring
server router firewall switch printer agentless monitoring VMWare monitoring Java-applications …
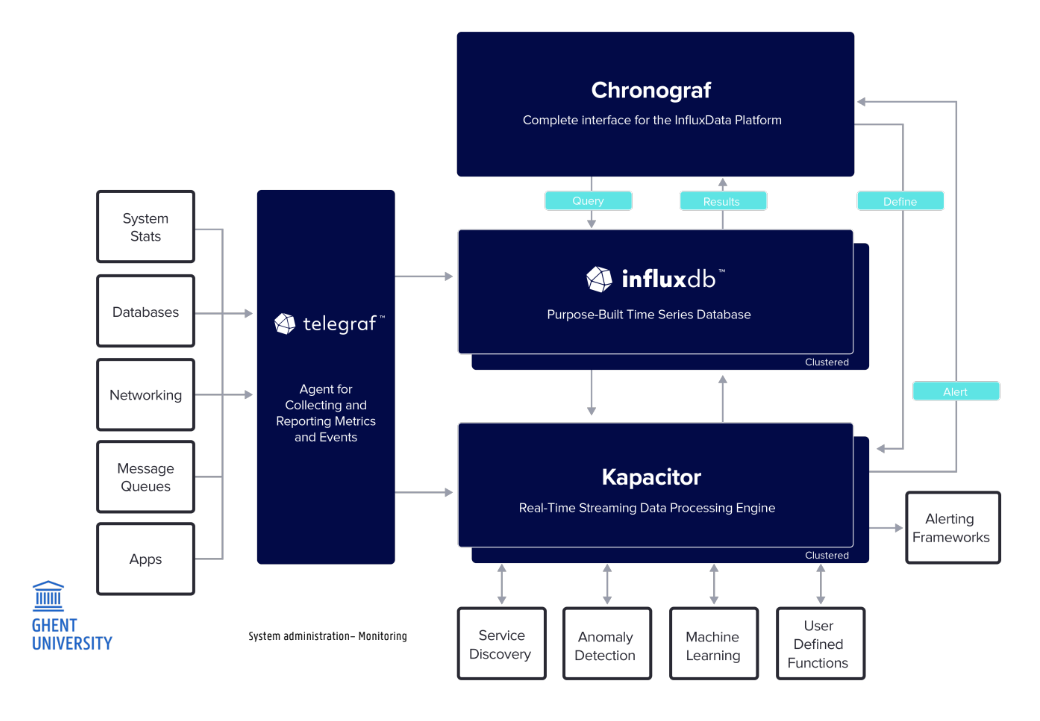
Tick Stack
4 onderdelen (ook uitleggen)
What it is
The TICK stack is an open-source time series platform specifically built to accumulate, store, visualize, and analyze time-series data (data points indexed in time order).
The name is an acronym for its four core components: Telegraf, InfluxDB, Chronograf, and Kapacitor.
How it works
Telegraf (Collect): collects and reports metrics
InfluxDB (Store): time series db (quick writes + retentions)
Chronograf (Visualize): UI + alerts
Kapacitor (Process): engine that processes data
Evolution (InfluxDB 2.0): deployment / security
Strengths
Highly Optimized:
Lightweight and Simple:
Highly Extensible:
Elastic Stack
4 onderdelen
What it is
The Elastic Stack (formerly known as the ELK Stack) is an open-source monitoring and observability platform.
It was originally built by a search company specifically for handling and querying massive amounts of log data, but has since expanded to accommodate metrics and security monitoring.
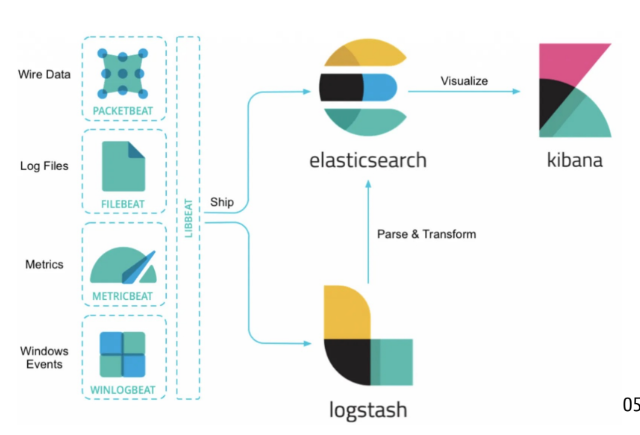
How it works The architecture is broken down into four distinct open-source projects:
Beats (Ingest): Lightweight, single-purpose data shippers installed on your servers. There are specific Beats for specific jobs, such as Filebeat (for logs), Metricbeat (for metrics), or Packetbeat (for network data).
Logstash (Process): A server-side data processing pipeline.
It dynamically ingests data from the Beats, filters and transforms it
(for example, deriving structure from plain text, or anonymizing sensitive PII data), and ships it to the database.
Elasticsearch (Store & Search): The core of the stack.
It is a highly scalable, RESTful, JSON-based search and analytics engine
capable of rapidly querying billions of data points.
Kibana (Visualize): The web-based user interface used to build dashboards, map data, and visually navigate through the information stored in Elasticsearch.
Strengths
The King of Logs: The lecturer explicitly noted that if your company's primary monitoring focus is logs and text data, this is the go-to solution.
Powerful Search Capabilities: Because it is built on a search engine, it offers incredibly advanced filtering, mapping, and natural language processing compared to other tools.
Modular Agent Architecture: By introducing Beats, Elastic solved the issue of having to install heavy, resource-intensive agents on every machine just to gather simple data.
Weaknesses
Historical Resource Heaviness: Before the introduction of Beats, Logstash acted as the primary data shipper on local machines. Because Logstash is a heavy, general-purpose processing pipeline, it was far too resource-intensive for simple tasks like tailing a single log file.
Complexity: Running the full stack (Elasticsearch, Logstash, Kibana, and various Beats) requires deploying and managing multiple distinct software components compared to a single-binary solution like the modernized TICK stack.
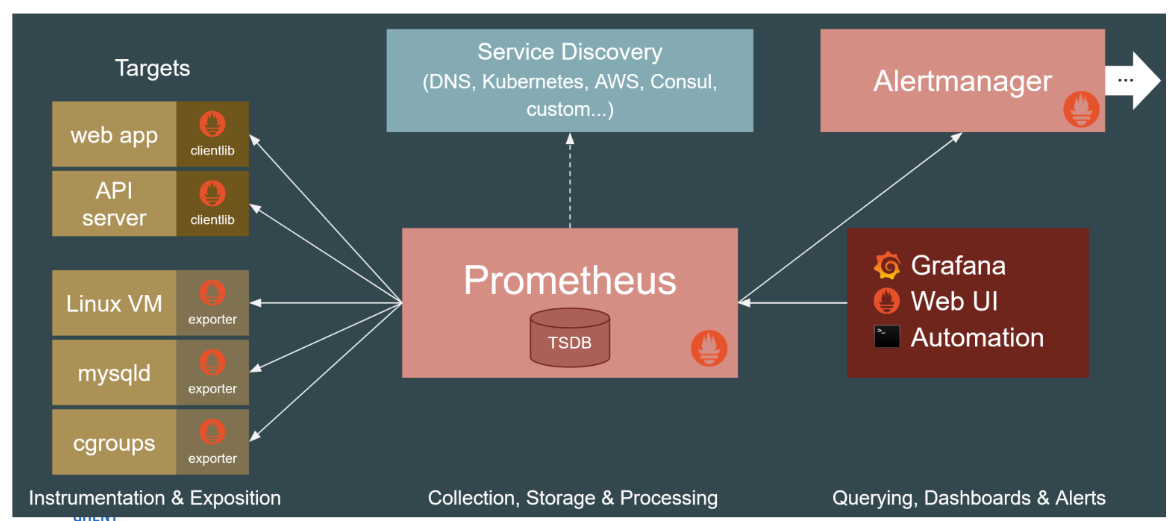
Prometheus
What it is
Prometheus is an open-source, metrics-based monitoring and alerting stack originally built at SoundCloud in 2012.
It is the de-facto industry standard for dynamic cloud environments and containerized workloads, such as Kubernetes.
Note: It is explicitly focused on time-series metrics. It is not designed for logging, tracing, or automatic anomaly detection.
How it works
Pull-Based Scraping:
Unlike tools that wait for data to be sent to them, the Prometheus server actively pulls (scrapes) metrics from the HTTP endpoints of target applications at scheduled intervals.
Service Discovery:
Because it is built for highly dynamic environments where containers and VMs constantly appear and disappear, it relies heavily on built-in "Service Discovery" (integrating with Kubernetes, AWS, DNS, etc.) to automatically figure out which targets exist and where to pull data from.
Data Model & PromQL:
It stores time-series data using a flexible model of metric names combined with key-value labels (no explicit hierarchy). To query this data, you use PromQL, a powerful custom query language specifically focused on time-series computations.
Alerting & Dashboards:
Alerts are generated by the Alertmanager when specific PromQL expressions hit a threshold (e.g., an error rate > 5%). While it has a basic built-in expression browser for graphing, it is most commonly paired with Grafana for visualizations.
Strengths
Operational Simplicity & Performance: It runs as a simple static Go binary. Its local time-series database is highly performant and scalable, capable of ingesting over 1 million samples per second.
Built for Microservices: Thanks to service discovery, it is exceptionally good at making sense of complex, ever-changing cloud architectures.
Natural Rate Limiting: Because it uses a pull-based model, the monitoring server controls the collection timing, preventing "metric floods" or network congestion from overwhelming the system.
Weaknesses
Short-Term Storage Only: Its local storage is only intended to keep a few weeks or months of data. If you need durable, long-term historical storage, you must connect Prometheus to a decoupled remote storage solution, such as Thanos, InfluxDB, or Cortex.
Single Point of Failure: By default, local storage does not use clustering. To achieve High Availability (HA), you have to run two identical instances side-by-side or integrate a tool like Thanos.
Firewall Challenges: The pull-based model requires inbound network access to reach the targets. This can be difficult to set up if your applications are behind strict firewalls or NAT