AS Microeconomics
1/339
There's no tags or description
Looks like no tags are added yet.
Name | Mastery | Learn | Test | Matching | Spaced | Call with Kai |
|---|
No analytics yet
Send a link to your students to track their progress
340 Terms
Economics as a social science
Economics examines how human behavior and decision making and how individuals, firms and governments respond to incentives under conditions of scarcity
Similarities between economics and natural sciences
• Theories are developed
• Theories are tested using observations, graphs, statistics
• Empirical data is used to improve and revise economic models
Differences between economics and natural sciences
• Economists can't conduct controlled lab experiments where one variable is changed at a time
• In economics its impossible to control everything because the real world is constantly changing. For example people's income, tastes, govt policies can all vary at the same time
Ceteris paribus
• Economists use ceteris paribus when looking at the relationship between two factors (e.g. demand and price)
• They'll assume that only these two factors change and all other factors (e.g. income, changed in taste) remain the same
Normative Statements
• A value based opinion or judgment that cannot be tested
• 'should' 'think' 'would'
• Example: "The government should increase benefits for the unemployed"
Positive Statement
• An objective statement or fact that can be tested using evidence
• "A reduction in income will increase the amount of people shopping in pound shops"
The basic economic problem
Resources are scarce, but wants are unlimited. This means choices must be made about how best to allocate limited resources efficiently
Scarcity
A gap between limited resources and unlimited wants and needs
Three fundamental questions
• What to produce?
• How to produce it?
• Who to produce it for?
Economic agents: Producers
• Firms or people that make goods or provide services
• Decide what to make and how much they're willing to sell it for
• Objective: maximize profits
• Problem: scarce resources, rising costs, competitive pressure, reducing profitability and efficiency.
Economic agents: Consumers
• People or firms who buy the goods and services
• Decide what to buy and how much they're willing to pay
• Objective: decide how to allocate their income across goods and services to maximize utility
• Problem: limited income may constrain choices, poverty, imperfect information
Economic agents: Governements
• Sets rules that other participants in the economy have to follow
• Decide how much to intervene in the way producers and consumers act
• Objective: operate in the interest of society to maximize social welfare, economic growth, full employment, low inflation
• Problem: budget deficits, government failure, corruption or lack of accurate information
Factors of Production
• The scarce resources used to make things people want and need can be divided into four factors of production
• Capital, Enterprise, Labor and Land (CELL)
Capital
• The equipment, factories and schools that help to produce goods or services
• Example: machinery, self-checkout, chainsaw
Enterprise
• Someone who is willing to take a risk for a reward
• Fail = lose money
• Succeed = profit
Labour
• Human input into the production process
• Factors that make some people more 'more valuable' or productive in the work place have a greater amount of human capital
Land
• Natural resources
• Non-Renewable resources: can't be replaced or regenerated (e.g. oil, coal)
• Renewable resources: can be replaced and regenerated (e.g. wind, wood from trees)
Opportunity Cost
The next best alternative foregone
Trade-off
When one thing is lost in order to gain something else
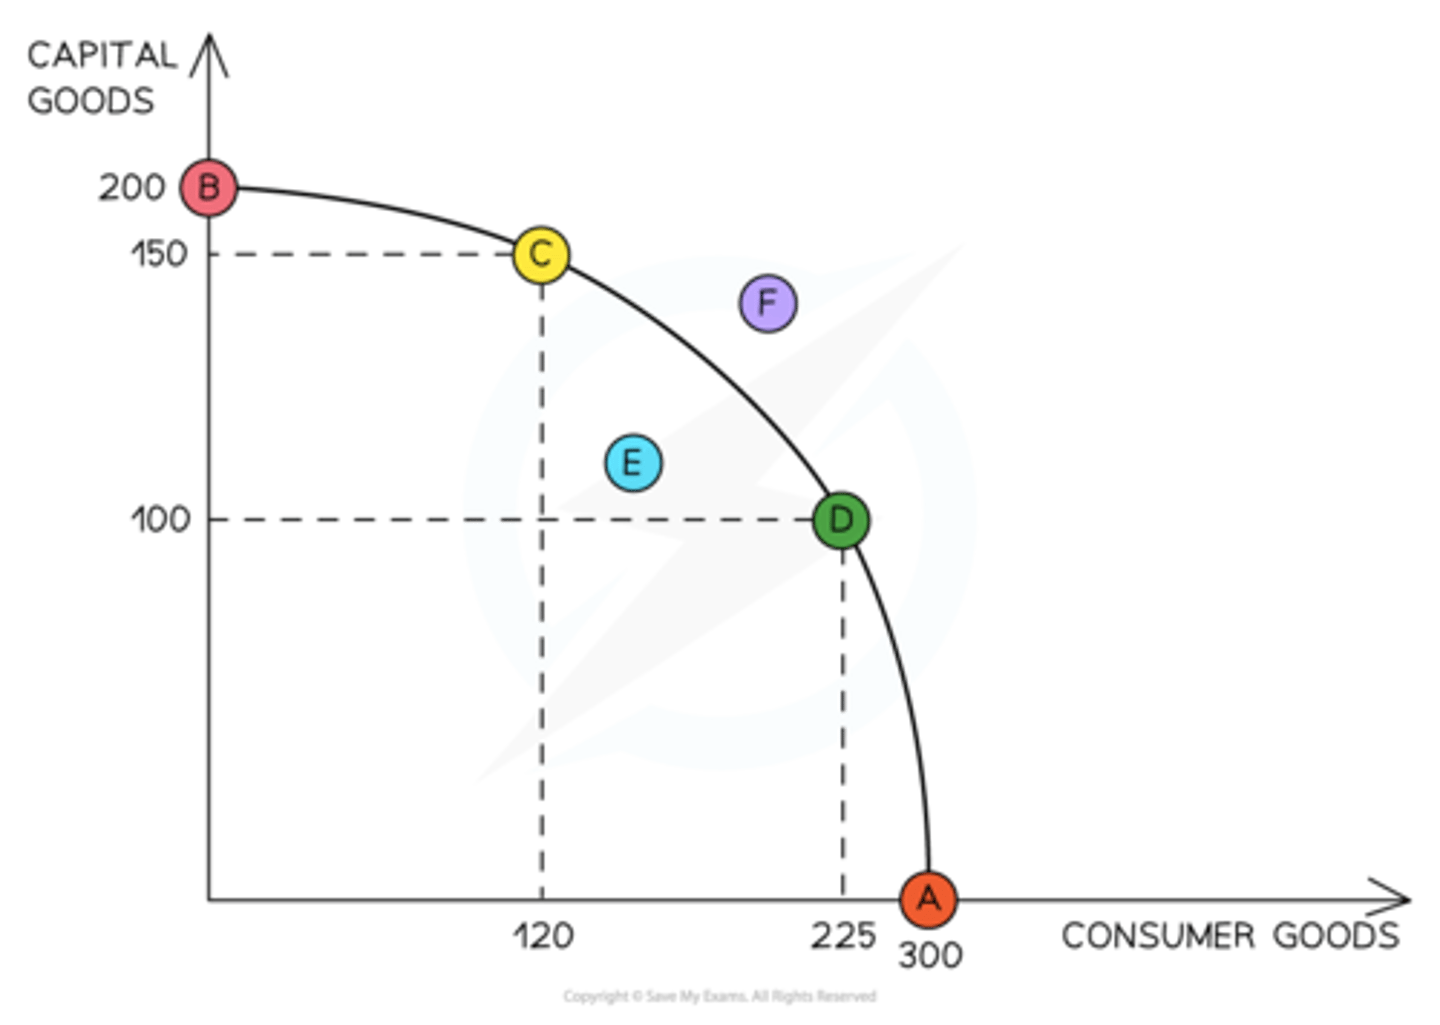
What does a PPF show?
• Shows the maximum number of goods/services that can be made using the existing level of resources in an economy.
PPF Diagram
• Points A,B,C and D are all achievable without any extra resources - are only achievable when all available resources are used efficiently
• B to C - Produce less capital goods but more consumer goods
• More resources are allocated to the production of consumer goods and fewer resources to the production of capital goods
• There is a trade-off between producing more consumer goods and producing more capital goods
• Point E lies inside in the PPF - indicates productive inefficiency, with current level of resources you could produce more of one good without making less of another good
• Point F lies outside of the PPF so isn't currently achievable using current level of resources in the economy
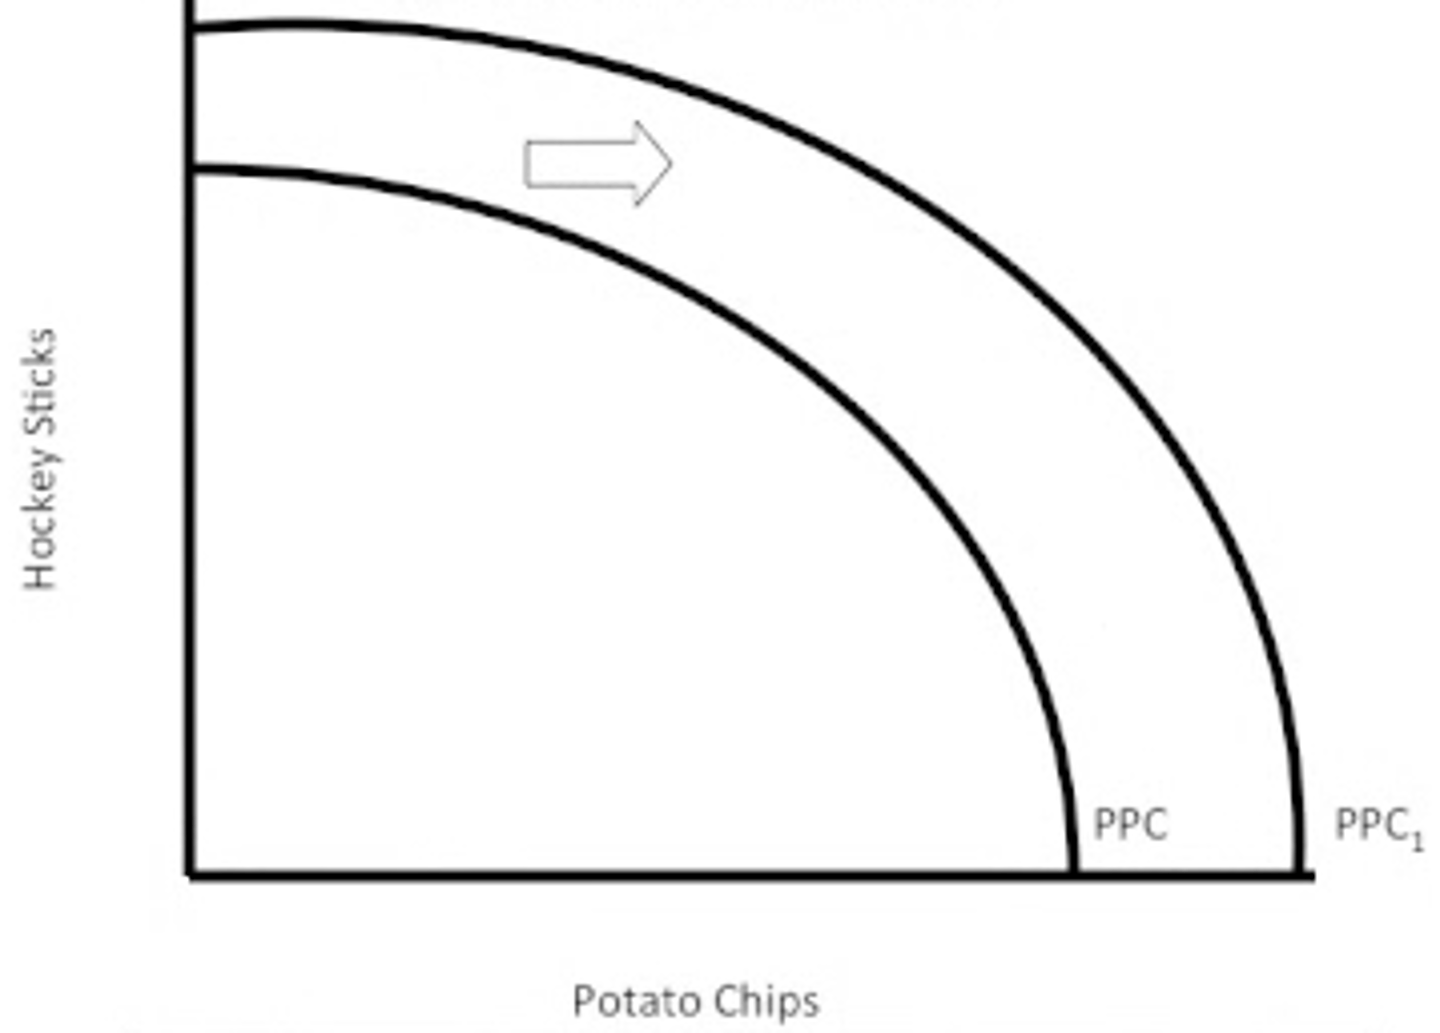
Shifts of the PPF
Reasons for outward Shift:
• Improved technology
• Improvements in labor
• Increased resources
Reasons for inward shift:
• External shocks - natural disaster, conflict
• Few resources available
Marginal Utility
the benefit gained from consuming one additional output of a good
Total Utility
Overall benefit gain from consuming a good
Law of diminishing marginal utility
For each additional unit of a good that is consumed, the marginal utility decreases.
Rational Consumers
• A rational consumer will choose to consume good at a point where marginal utility = price
• If marginal utility decreases with each extra good consumed then the price a consumer is willing to pay will decrease
Key assumptions in economics
• Economic agents are utility maximisers
• Economic agents are rational
Reasons why consumers don't act rationally
• Time available to make decisions is limited
• Not all information is available and information that is available may be limited
• People may not be able to process and evaluate vast amounts of data involved in making a decision
Behavioral Biases
Psychological tendencies that influence decision making
Rule of thumb (heuristics)
Simple mental shortcuts used to make quick decisions without analyzing all of the information
Example:
A student always chooses the cheapest revision guide assuming its the best value without considering the content quality
Achoring
Placing too much weight on the first piece of information encountered, even if its irrelevant
Example:
If a jacket is "reduced from £100 to £50", the £100 'anchor' makes £50 seem like a bargain even if its true value in only £40
Availability bias
Overestimating the likelihood of events based on how easily example come to mind
Example:
After seeing news about plane crashes, someone believes flying is more dangerous than driving, despite statistics showing the opposite
Social norms
People often base decisions on what others around them are doing, rather than personal benefit
Example:
A teenager might start buying a certain brand of shoes because their friends do, not because they personally value the brand
Habitual Behaviour
Repeated behavior over time become habits even if they're not optimal
Example:
someone might continue shopping at a more expensive corner shop simply out of routine despite a cheaper supermarket is nearer
Choice Architecture
An individual's choice in influences by adapting the way the choice is presented.
This can be done in a number of ways:
• Default options
• Framing
• Nudges
• Restricted choice
• Mandated choice
Default Options
Pre-set courses of action that take effect if nothing is specified by the decision maker
Framing
The context in which information is presented (changing the wording)
Example:
'90% fat free' and '10% fat'
Both convey the same information however '90% fat free' sounds more attractive
Nudges
Aim to change the behavior of consumers without taking away their freedom of choice
Example:
Replacing junk food with healthier food; placing healthier food at eye level
Restricted choice
Giving consumers a limited number of options when making a choice
Mandated choice
A form of choice architecture where the individual must make a decision.
Mandated choices are usually required by law.
Bounded Rationality
• Cognitive limitations that constrain one's ability to interpret, process, and act on information.
• People tend to make satisfactory decisions rather than spend ages trying to make rational decisions
Example:
Choosing a nearby coffee shop instead of researching the best-rated one
Bounded self-control
Limits on their self control
Example:
A consumer may have limited ability to stop smoking even though the act of smoking doesn't maximise their utility
Altruism
Being selfless and doing something to benefit others, without expecting anything in return. It can influence behavior in several ways:
• Social norms
• Empathy
• Reciprocity
• Self-esteem
Symmetric information
• Symmetric information means that consumers and producers have perfect market information to make their decision.
• This leads to an efficient allocation of resources.
Asymmetric Information
• Asymmetric information leads to market failure. This is when there is unequal knowledge between consumers and producers.
• For example, a car dealer might know about a fault with the car that the consumer is unaware of.
• This could lead to a misallocation of resources.
Demand
• The quantity of a good/service that consumers are willing and able to buy at a given price over a period of time
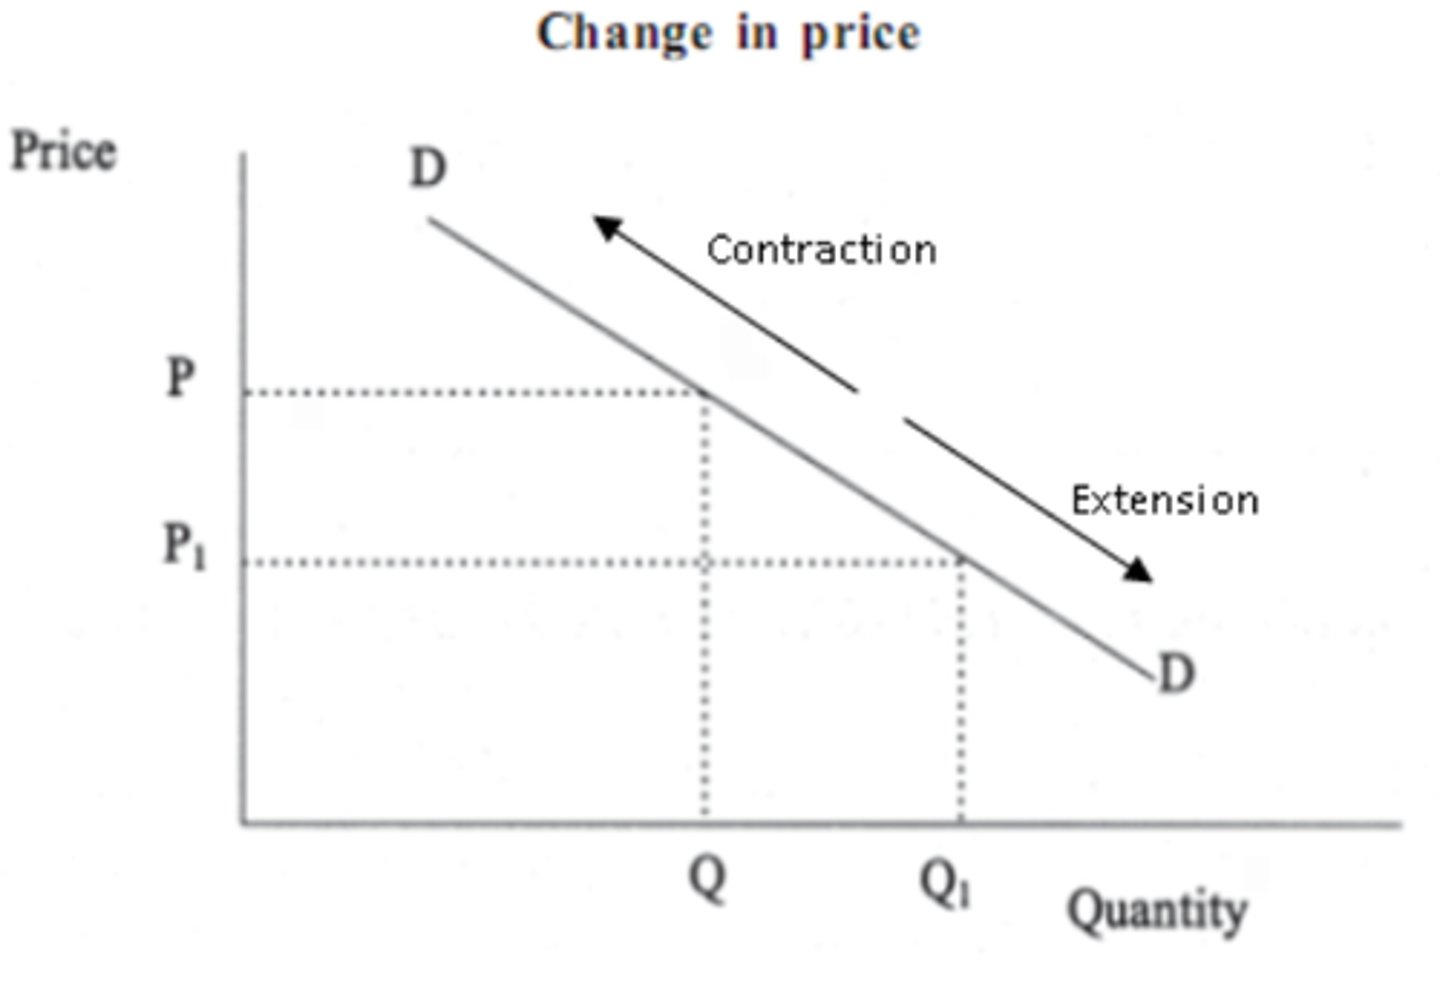
Demand Curve
• The demand curve is downward sloping because as price decreases, demand increases.
• A decrease in price leads to an extension in demand
• An increase in price leads to a contraction in demand
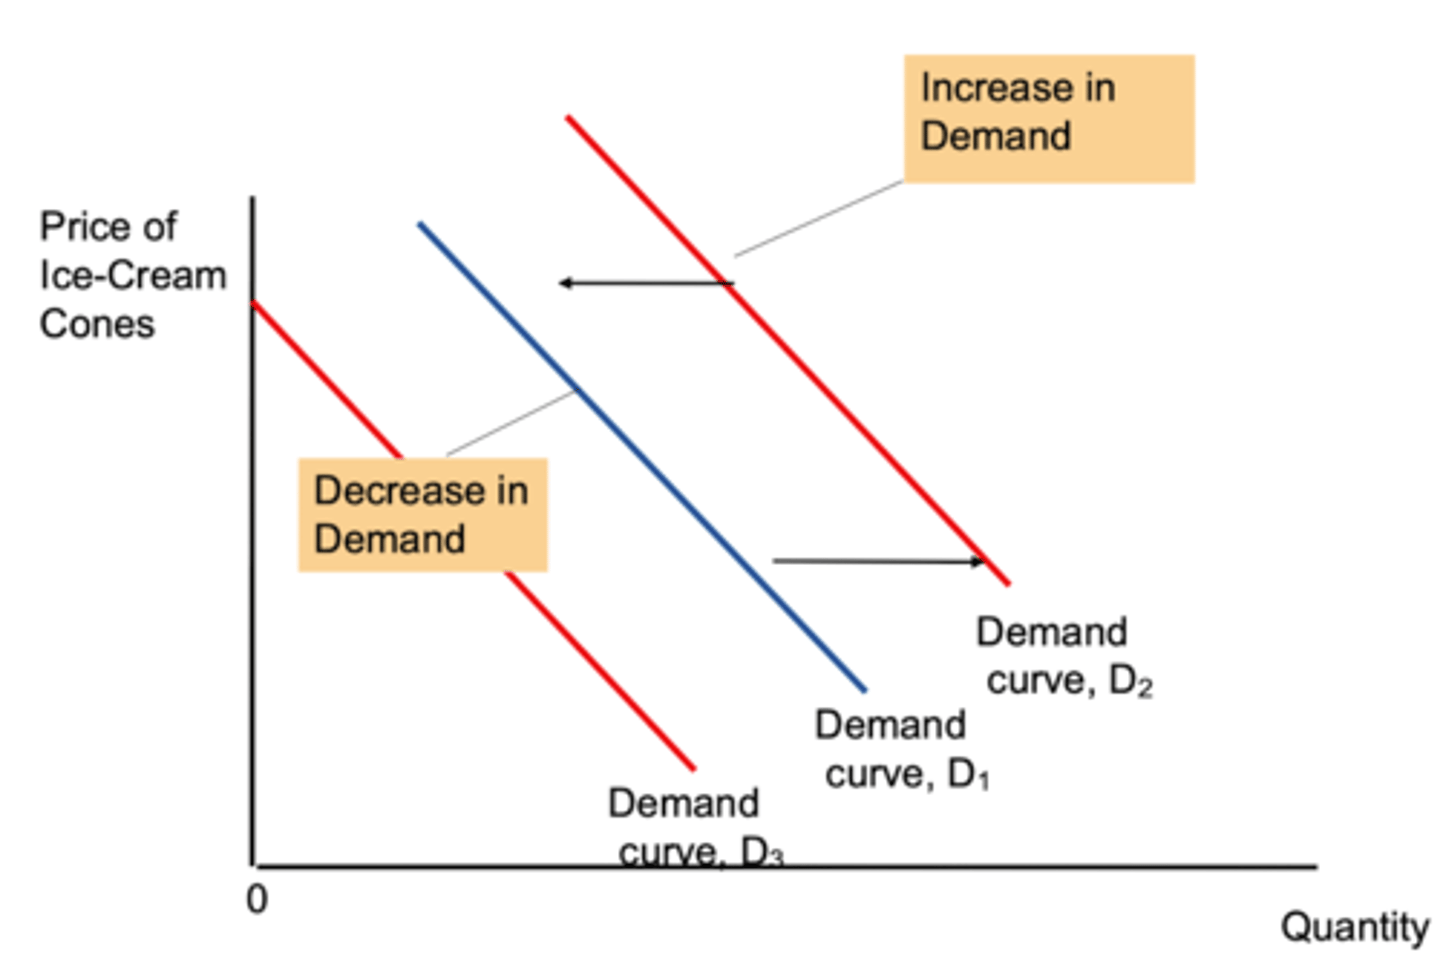
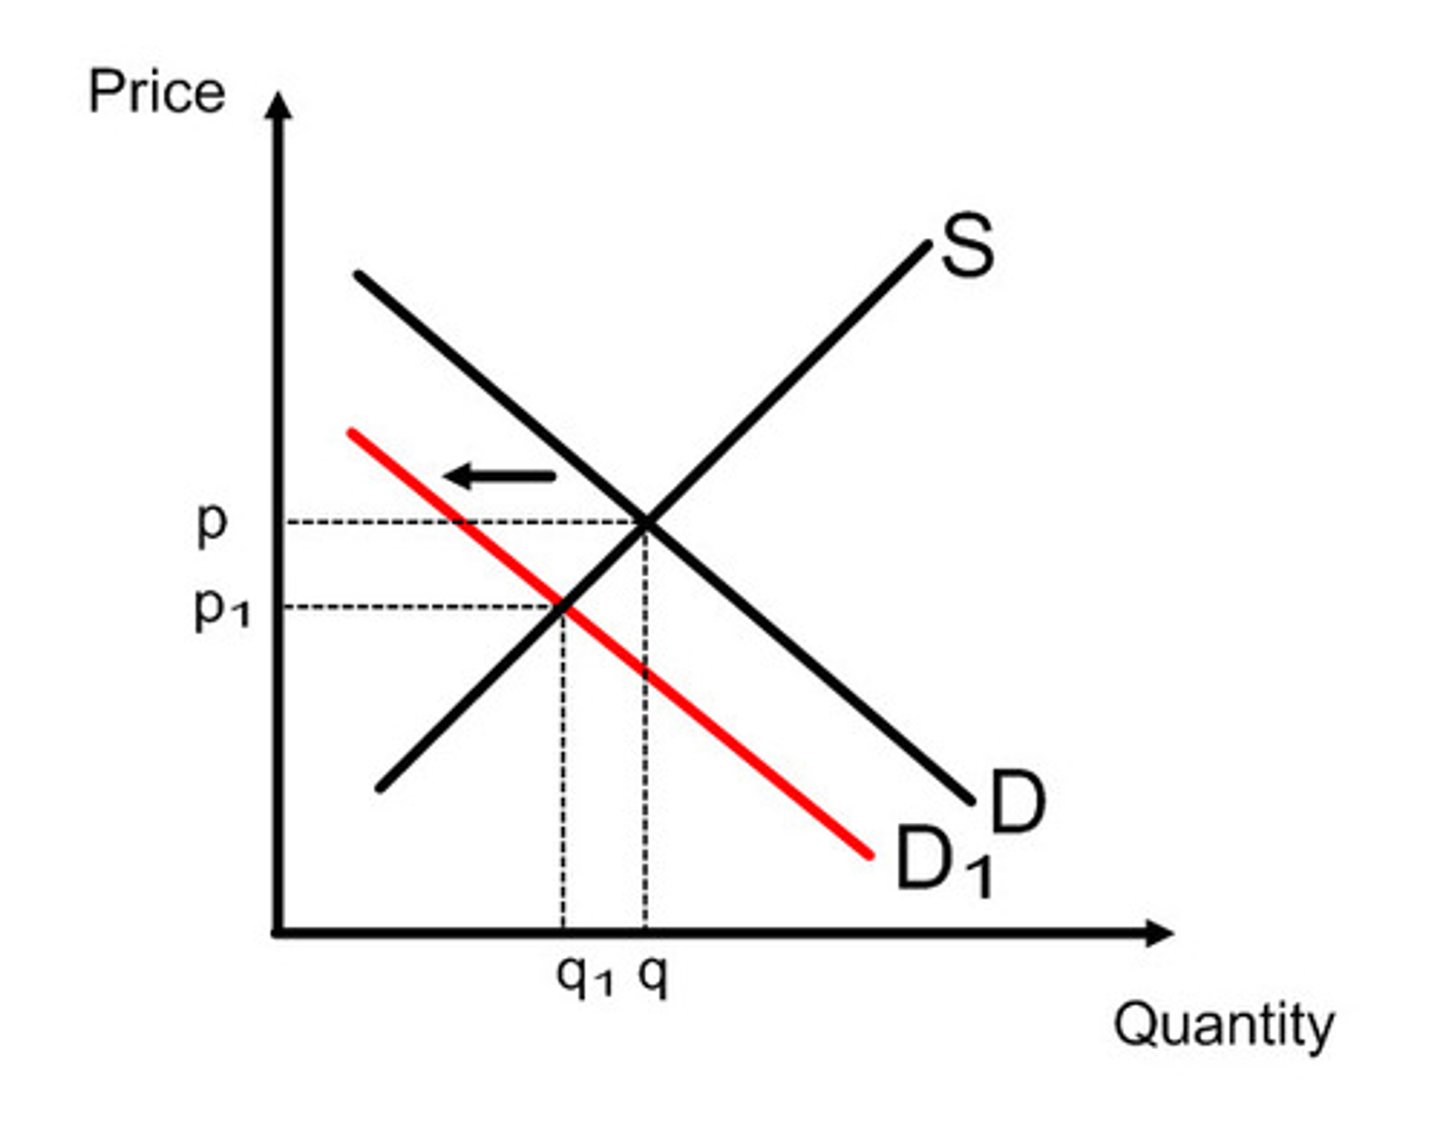
Shifts in the demand curve
• Demand curve moves to the left when there is a decrease in demand
• Demand curve shifts to the right when there is an increase in demand
Types of demand: Joint Demand
• When two or more goods are used together
• The demand for one goof is directly linked to the demand for another
• Also known as complementary goods
Examples:
• Printer and Ink
• Cereal and Milk
Types of demand: Competitive Demand
• Arises when goods are substitutes
• An increase in the demand for one leads to a fall in demand for the other
Examples:
• Playstation and Xbox
Types of Demand: Composite Demand
• When a good is demanded for multiple distinct uses
• An increase in demand for one use cab reduce availability for other uses
Examples:
• Water is used for drinking, cooking, cleaning and industrial processes
Types of demand: Derived Demand
• The demand for one item is derived from the demand for another item that is connected in the production or distribution process.
Example:
• If the demand for automobiles increases, it will lead to an increase in the demand for steel to produce the necessary components.
Factors causing shifts in the demand curve: Income
• For normal goods, an increase in income leads to an increase in demand shifting demand curve to the right (e.g. holidays, smartphones)
• For inferior goods, an increase in income leads to a fall in demand, shifting the curve to the left (e.g. instant noodles, bus travel)
Factors causing shift in the demand curve: Price of Substitutes
• If the price of a substitute falls, the demand for the original good falls
Example:
• If the price of the PS5 falls from £400 to £300 while the box remand at £400, demand for the Xbox decreases, shifting its demand curve to the left, while the PS5 demand increases
Factors causing shift in the demand curve: Price of complements
• Complementary goods are used together (joint demand)
• A fall in the price of one good increase demand for both
Example:
• If the price of coffee machines falls, demand for coffee pods rises. This shifts curve for both goods to the right
Factors causing shift in the demand curve: Consumer Preferences
• Tastes and preferences, influenced by by trends, advertising or social factors affect demand.
Example:
• If a product becomes outdated or unpopular, demand decreases shifting the curve to the left
However these factors may not always hold true due to:
• Brand loyalty: emotional attachment or trust in the brand
• Consumer preferences: strongly prefer one product regardless of price or quality differences
• Consumer inertia: may not change out of habit or convenience even if switching is beneficial
• Lack of information: might not be aware of price changes, alternatives or new products
• Good advertising: strong marketing can artificially maintain or increase demand
Supply
• The quantity of a good or service that producers are willing and able to offer for sale at a given price over a period of time
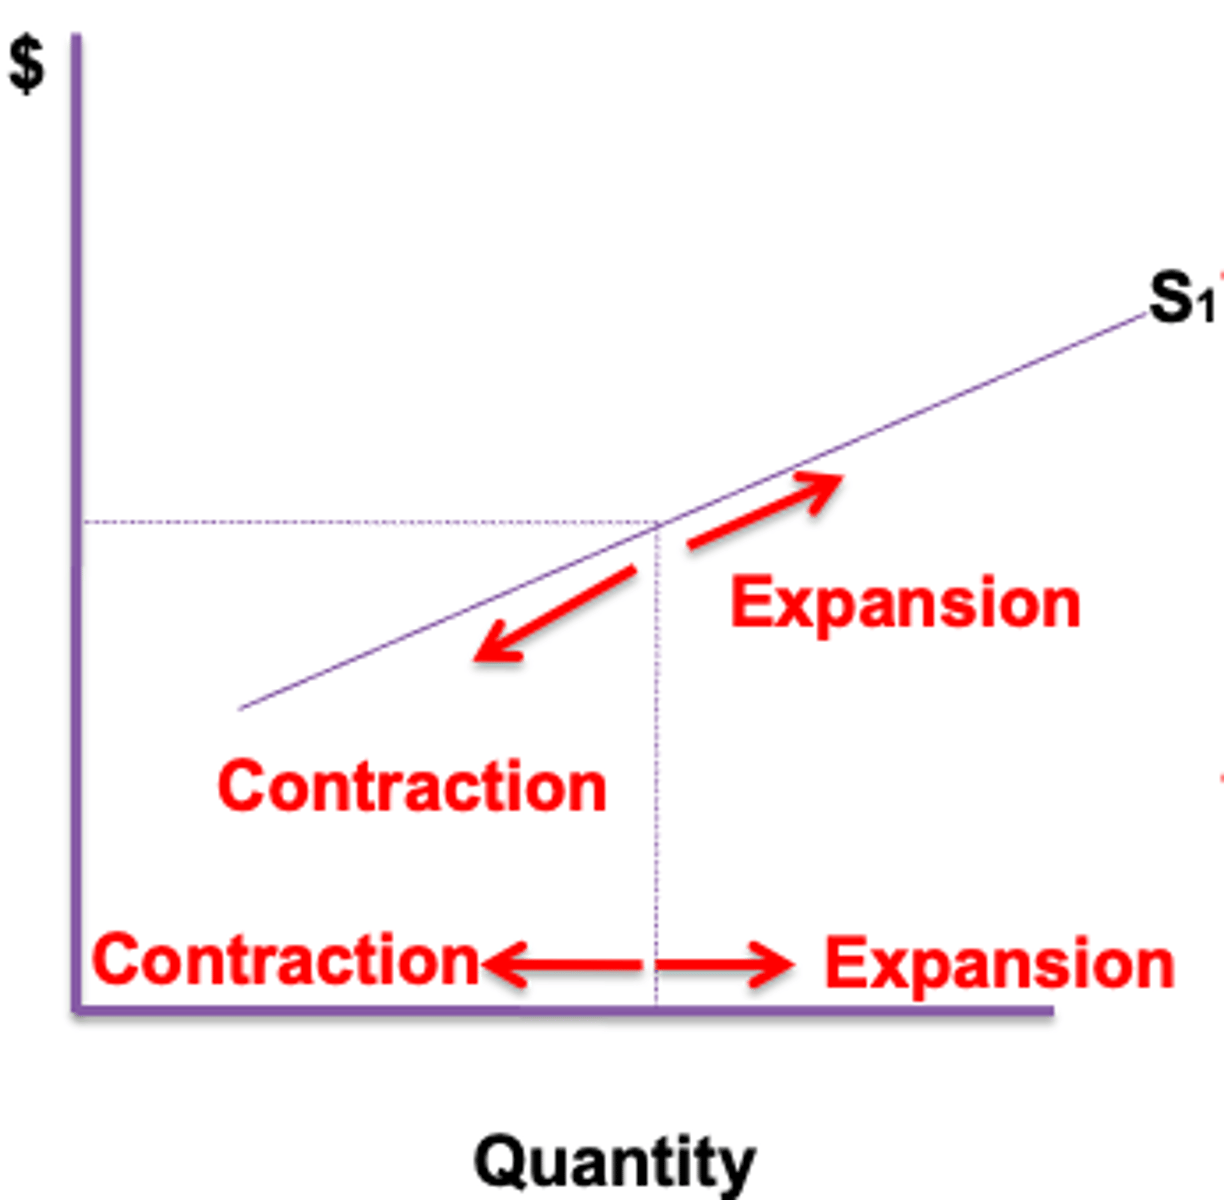
Supply curve
The supply curve is upward sloping because as prices increases, supply increases because:
• The higher the price of a good, the more profit a firm can make so more quantity is produced
• When price increases, the sector may be more profitable than their previous sector which signals new firms to join the market
A increase in price leads to an extension in supply
An decrease in price leads to a contraction in supply
Shifts in the supply curve
• The supply curve shift to the right when there is an increase in supply
• The supply curve shifts to the left when there is a decrease in supply
Types of supply: Competitive supply
• This occurs when two (or more) alternative goods can be produced from the same factors of production.
• Increasing the supply of one goof reduces the ability to produce the other
Example:
• A plot of land can be used to grow wheat and barley - not both. If the farmer chooses wheat the supply for barley decreases.
Types of supply: Joint supply
• Occurs when the production of one goods automatically results in the production of another
• If the price of the product increases, then supply of it and any joint products will also increase
Example:
• From a single cow, a farmer can produce milk, leather, and beef
• If the price of petrol increases, the level of drilling for oil and the supply of petrol and its joint products will increase
Indirect taxes
Taxes imposed on goods and services
Subsidies
A grant given by the government to a firm to increase production by reducing a firm's cost of production
Factors causing shift in the supply curve: Cost of Production
When costs rise, goods become less profitable causing supply curve to shift to the left.
A fall in production costs make goods more profitable, causing supply curve to shift to the right
Factors influencing production costs: Technological progress
• Advancement in technology improve productivity, allowing firms to produce more with the same resources.
• This reduces average costs in the long run and shift the supply curve to the right
Factors influencing production costs: Capital-labor substitution
• Investment in machinery and automation (capital) can replace manual labor
• This reduces long term costs and increases efficiency, leading to a shift in the supply curve to the right
Factors influencing production costs: Globalisation
Enables firms to offshore production to countries with lower wages, reducing input costs
Factors influencing costs of production: Wages
• Can increase due to rising inflation
• Can decrease as increased immigration may increase supply of labor making it less scarce and reducing wages
• Low labor costs reduce production costs and increase supply
Factors causing shift in the supply curve: Indirect taxes
• Higher indirect taxes increases production costs, making goods less profitable and reducing supply
• This shifts the supply curve to the left
Factors causing shift in the supply curve: Subsidies
• Government subsidies lower firms' costs of production increasing profitability.
• This incentivises firms to produce more, shifting the supply curve to the right
Factors causing shift in the supply curve: Price of related goods
• When price of alternative good rises, firms may reallocate resources to produce the more profitable good
• This reduces the supply of the original good causing supply curve to shift to the right
However these factors may not always hold true due to a few factors:
• Time lag: even if costs fall, firms may take time to respond - they may need to invest in new machinery or train staff, meaning supply wont shift immediately
• External shocks: extreme weather, pandemics or political instability can disrupt supply chains and override cost considerations
• Government policies: taxes, subsidies or legal restrictions can have a greater influence than costs (e.g. a heavy carbon tax might reduce supply even if costs of production falls)
• Elasticity: even with lower costs, firms may not have the capacity or flexibility to increase output quickly
Elasticity
A measure of sensitivity of one variable change in response to another
Price elasticity of demand
The responsiveness of the quantity demanded to a change in the price of the product
PED Equation

Elastic demand
• When demand is elastic, a change in price leads to a proportionately larger change in quantity demanded
• Represented by a relatively flat (gentle) demand curve
PED > 1 (ignoring the negative sign)
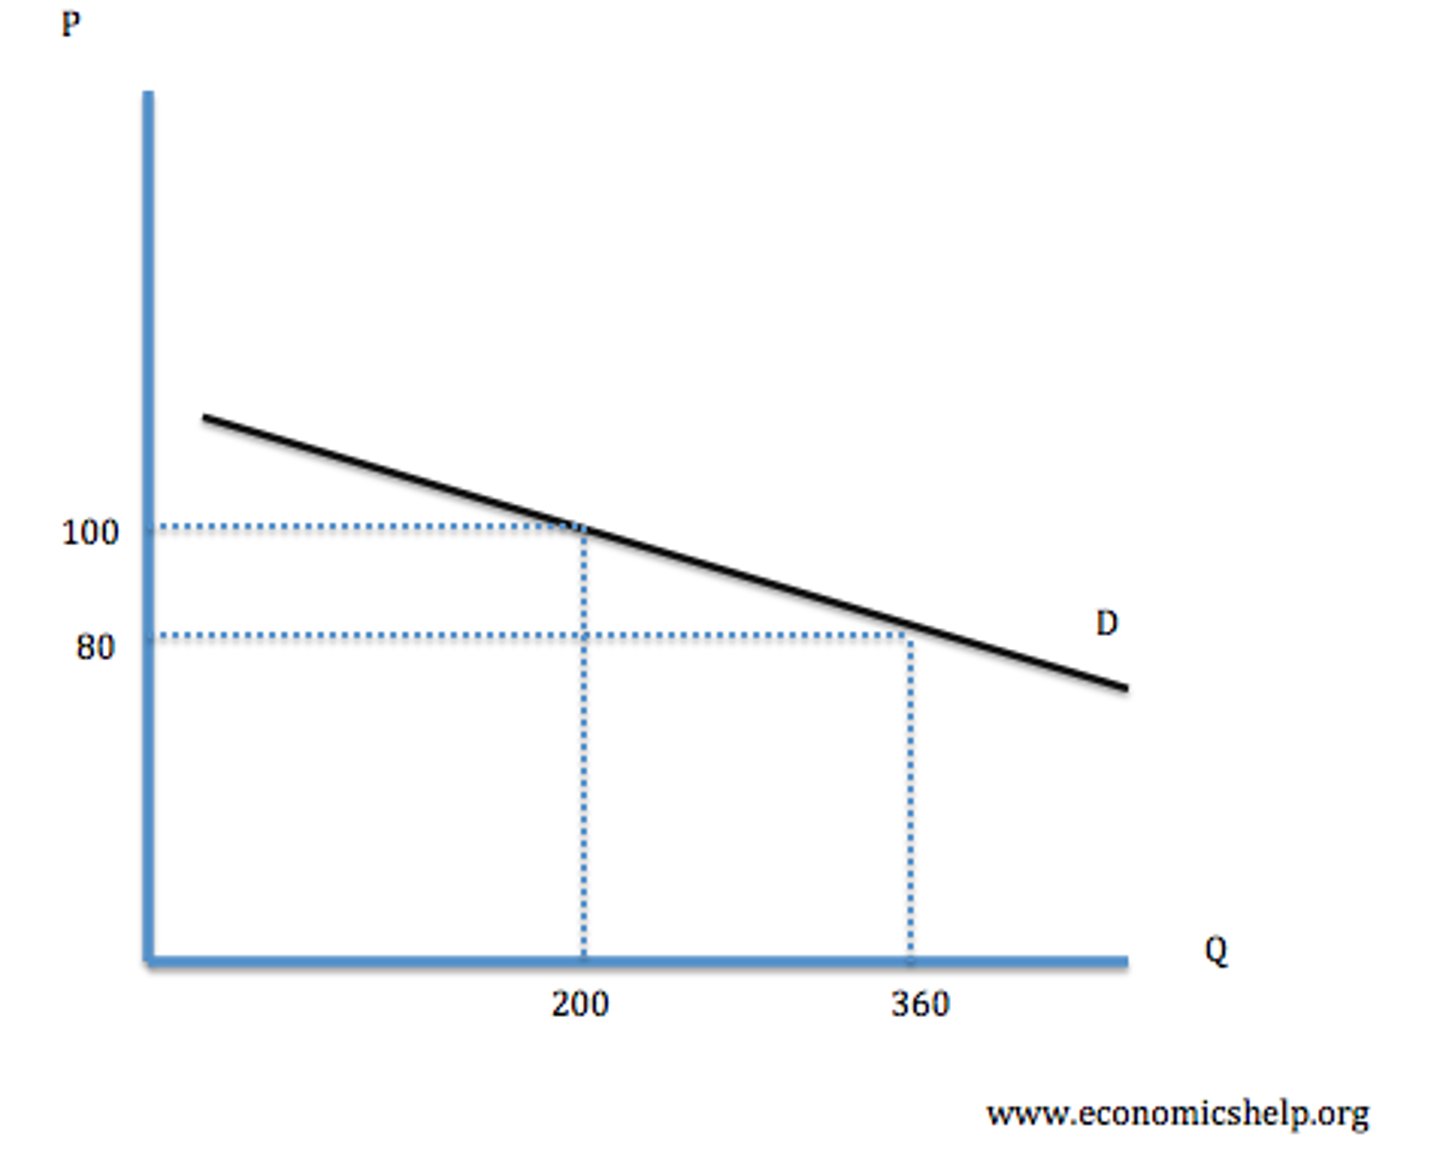
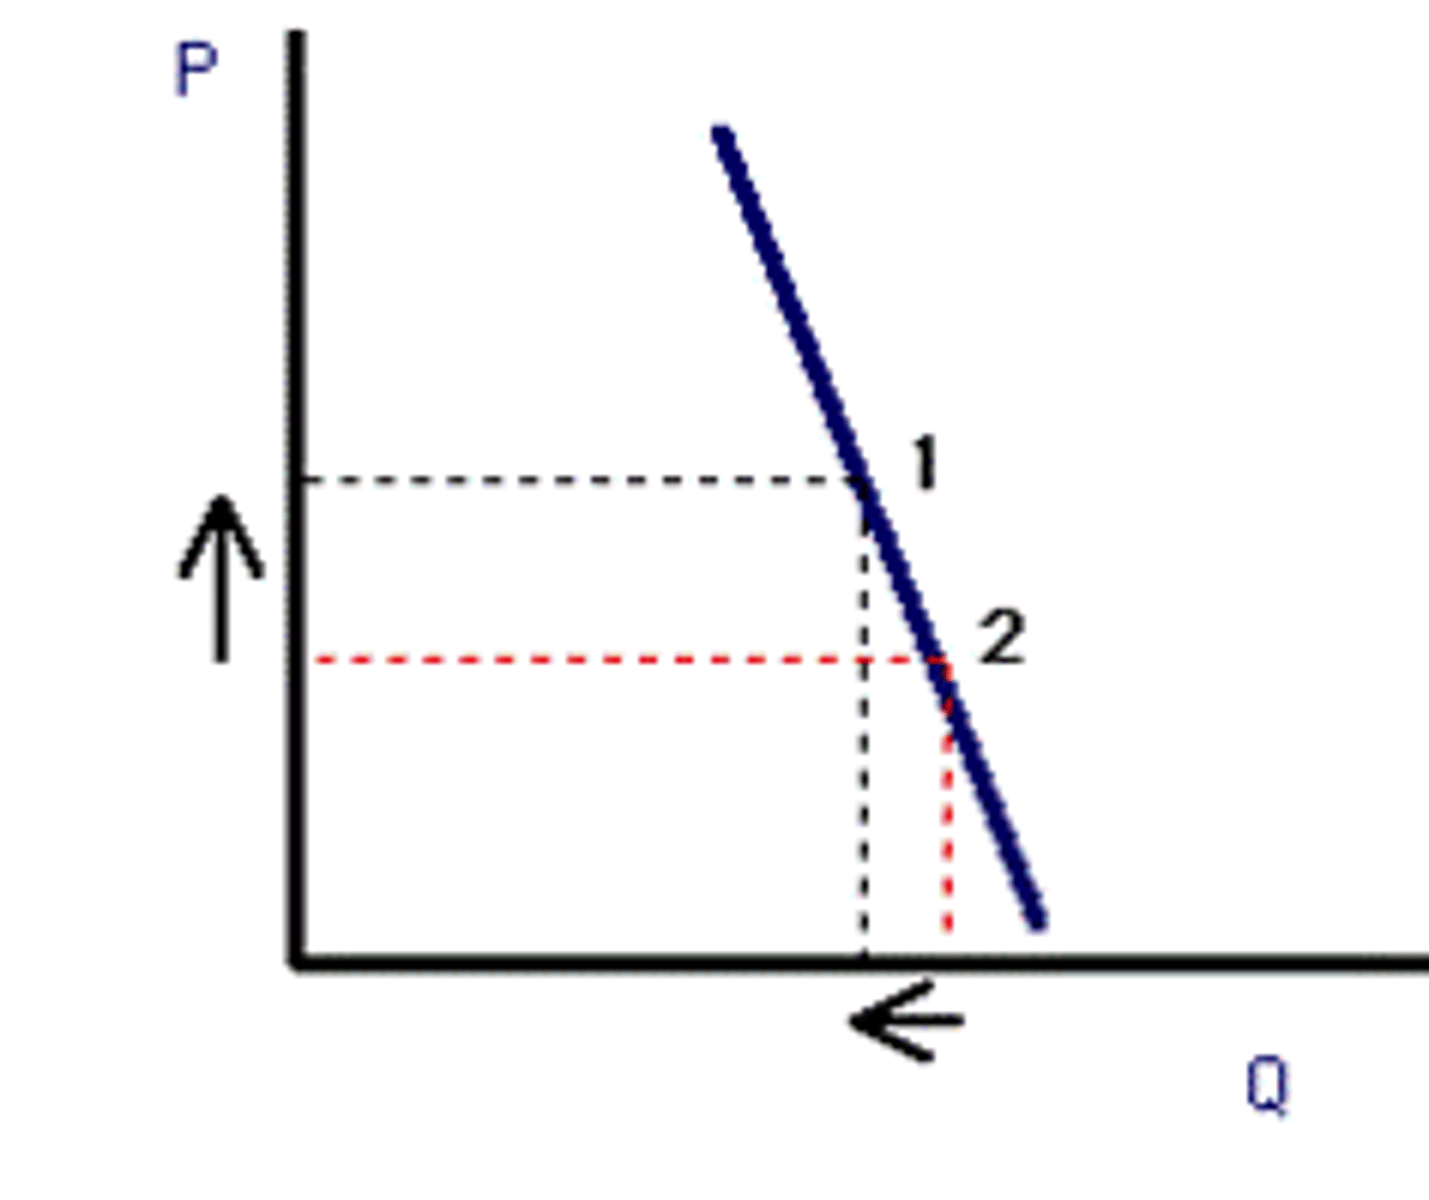
Inelastic demand
• When demand is inelastic, a change in price results in proportionately smaller changes in quantity demanded
• Represented by a steep demand curve
0 < PED < 1
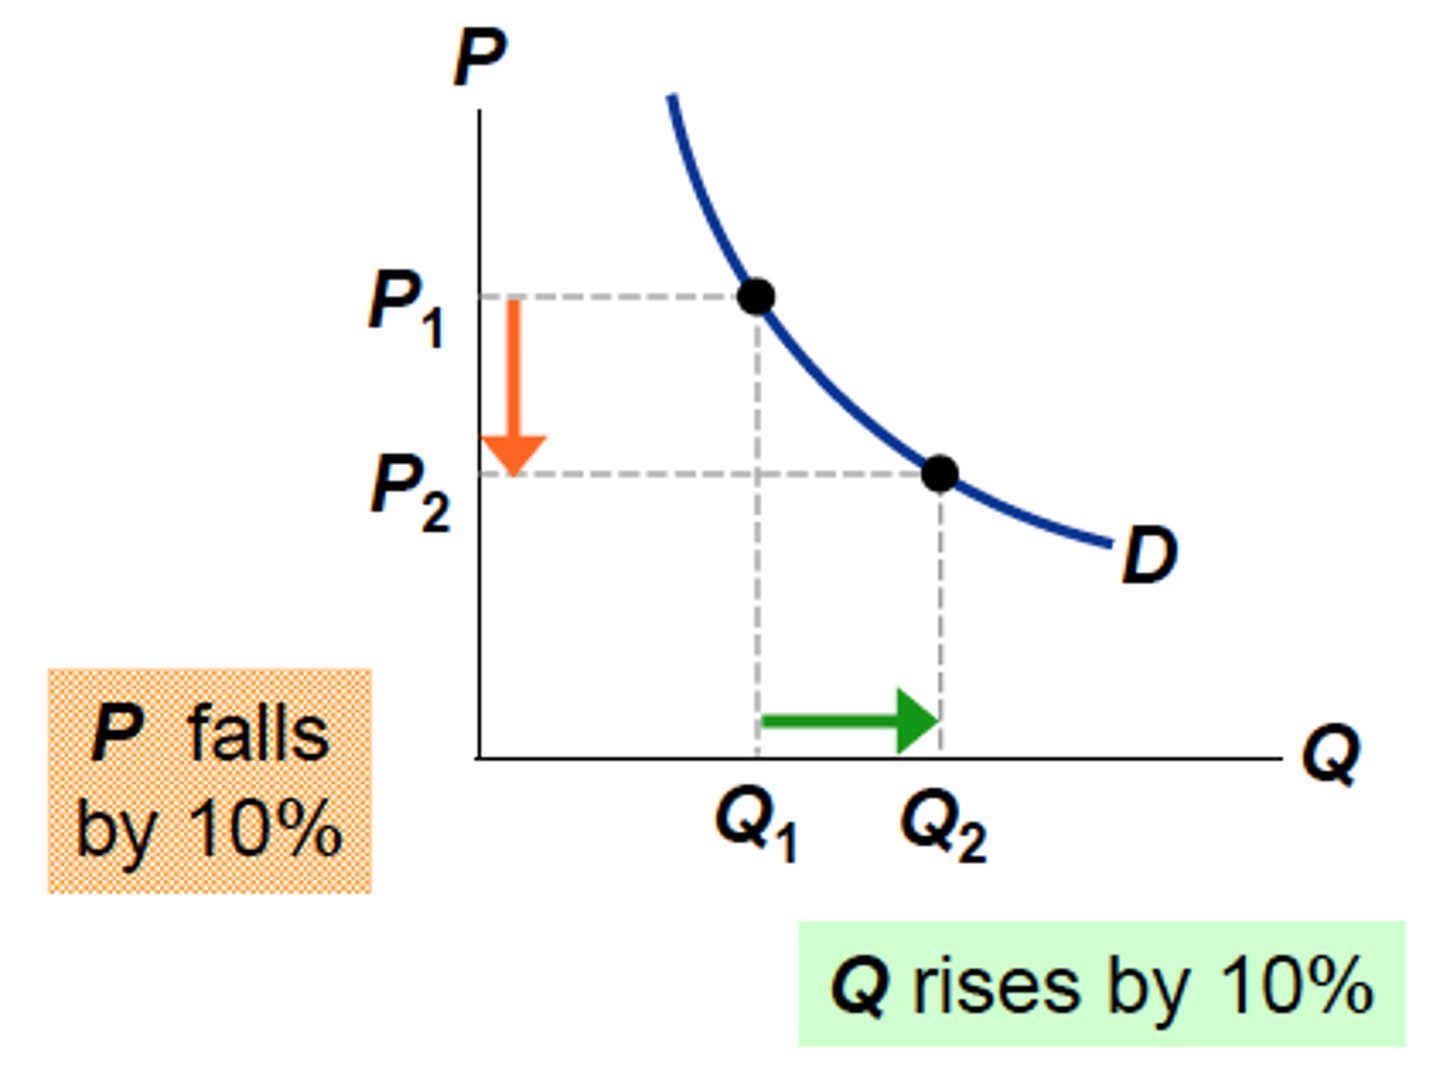
Unit Elastic demand
• Price and quantity demanded change by the same same percentage
• Total revenue stays the same
PED = 1
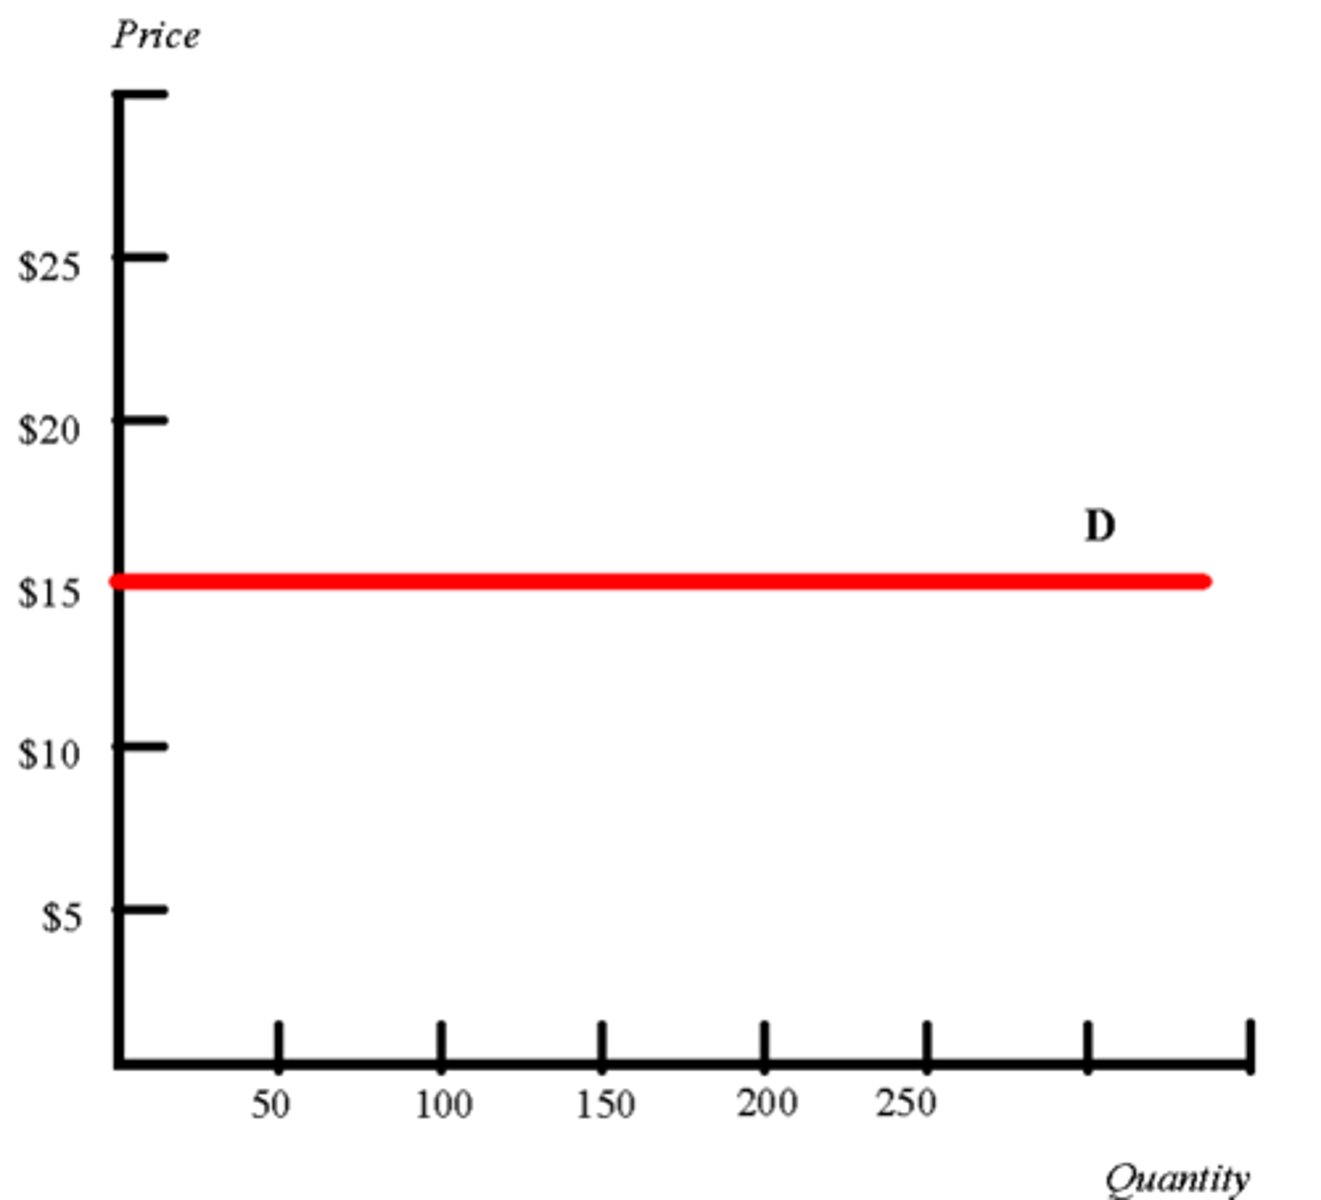
Perfectly Elastic Demand
• Any price increases causes demand to fall to zero
• Consumers are extremely price sensitive
PED = Infinity
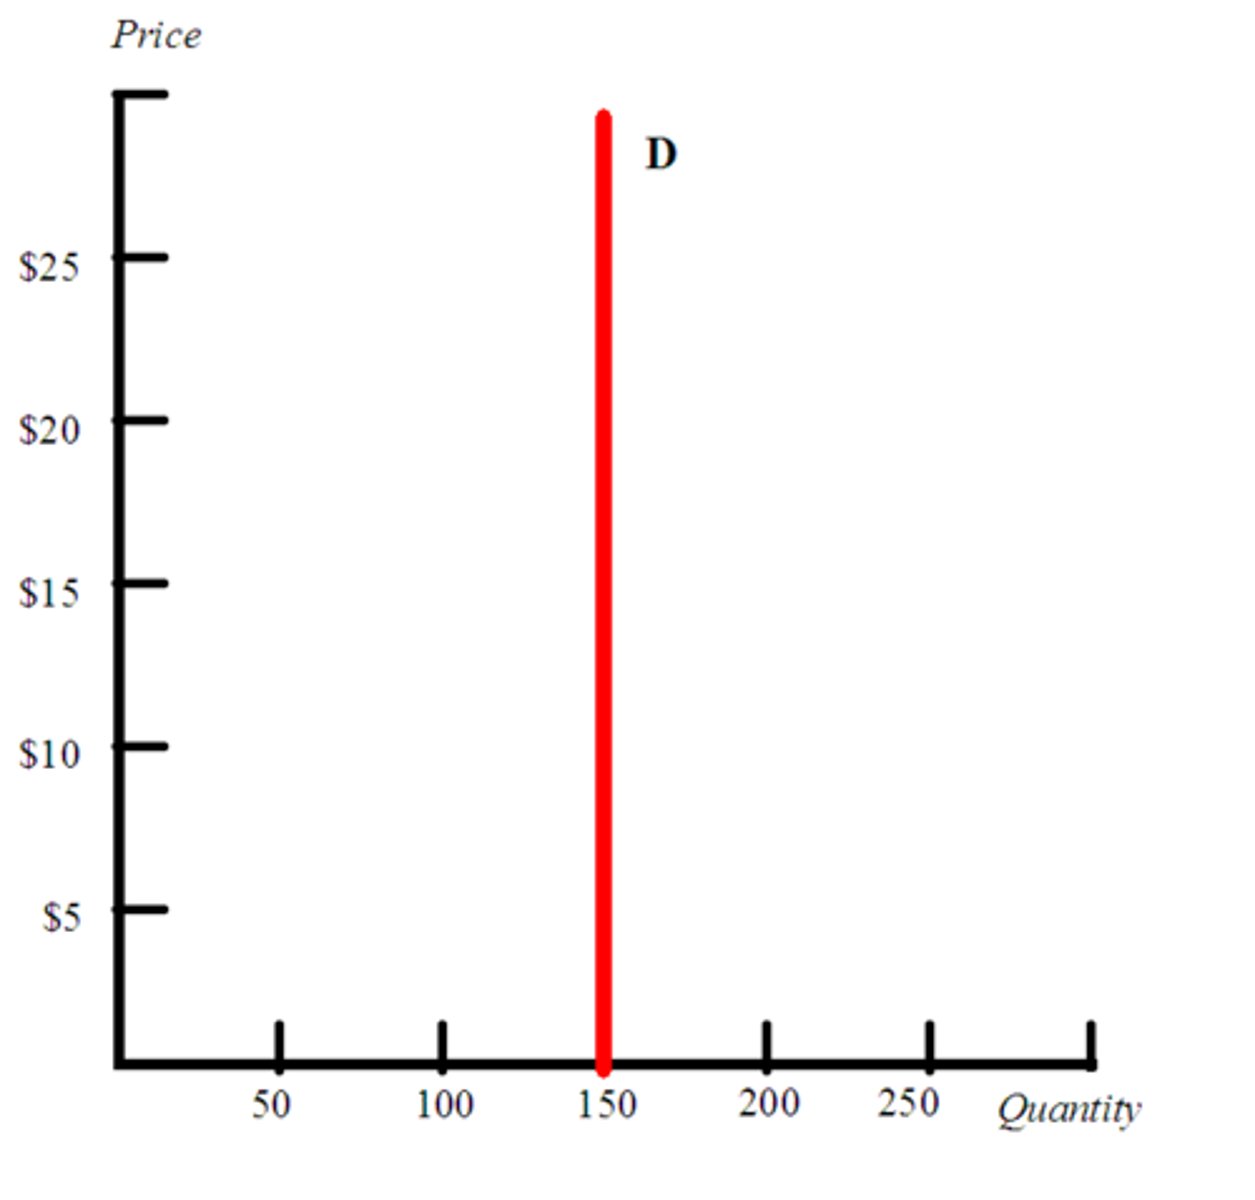
Perfectly Inelastic Demand
• Quantity demanded stays the same regardless of price
• Consumers will buy the same amount no matter the price
PED = 0
Determinants of PED: Availability of Close Substitutes
Analysis:
• If there are many close substitutes available, a rise in price will cause consumers to switch to alternatives, leading to a more than proportionate fall in quantity demanded i.e. if demand is elastic
• Conversely, if substitutes are limited, demand is likely to be inelastic
Evaluation:
Although high number of substitutes typically leads to elastic demand, this may not always hold due to:
• Brand loyalty
• Perceived quality: consumers may not see substitutes as equivalent
• Consumer habits/preferences
• Inertia: Consumers may be unwilling to change due to effort or comfort
Determinants of PED: Nature of the Good
Analysis:
Goods considered necessities (e.g. food, utilities) or addictive (e.g. cigarettes) tend to have inelastic demand: even if price rises quantity demanded falls less than proportionately
Evaluation:
The classification of a good as a necessity is subjective
For example:
Smartphones may be seen as essential in the UK but not in rural parts of Bangladesh.
Cultural and economic context affects how 'necessary' a good is considered
Determinants of PED: Proportion of Income Spent
Analysis:
• If a good represents a small fraction of income (e.g. chewing gum), demand is likely to be inelastic since price changes have minimal impact
• For expensive goods that take up a larger share of income (e.g. cars, designer bags), demand tends to be more elastic as consumers are more sensitive to price changes
Evaluation:
Luxury items may still be purchased even at higher prices for specific occasions meaning demand may not fall sharply despite price increases especially if purchases are infrequent or symbolic
Determinants of PED: Time
Analysis:
• Demand is usually more inelastic in the short run as consumers have less time to find alternatives or adjust their behavior.
• Over time demand becomes more elastic as substitutes emerge and consumer adapt
Evaluation:
This varies between individuals. Factors such as brand loyalty, habits and consumer inertia can delay or prevent adjustment even in the long run
Relationship between elastic demand and revenue
• A reduction in price will increase the firm's total revenue
• An increase in price will reduce the firm's total revenue
Relationship between inelastic demand and revenue
• A reduction in price will reduce the firm's total revenue
• An increase in price will increase the firm's total revenue
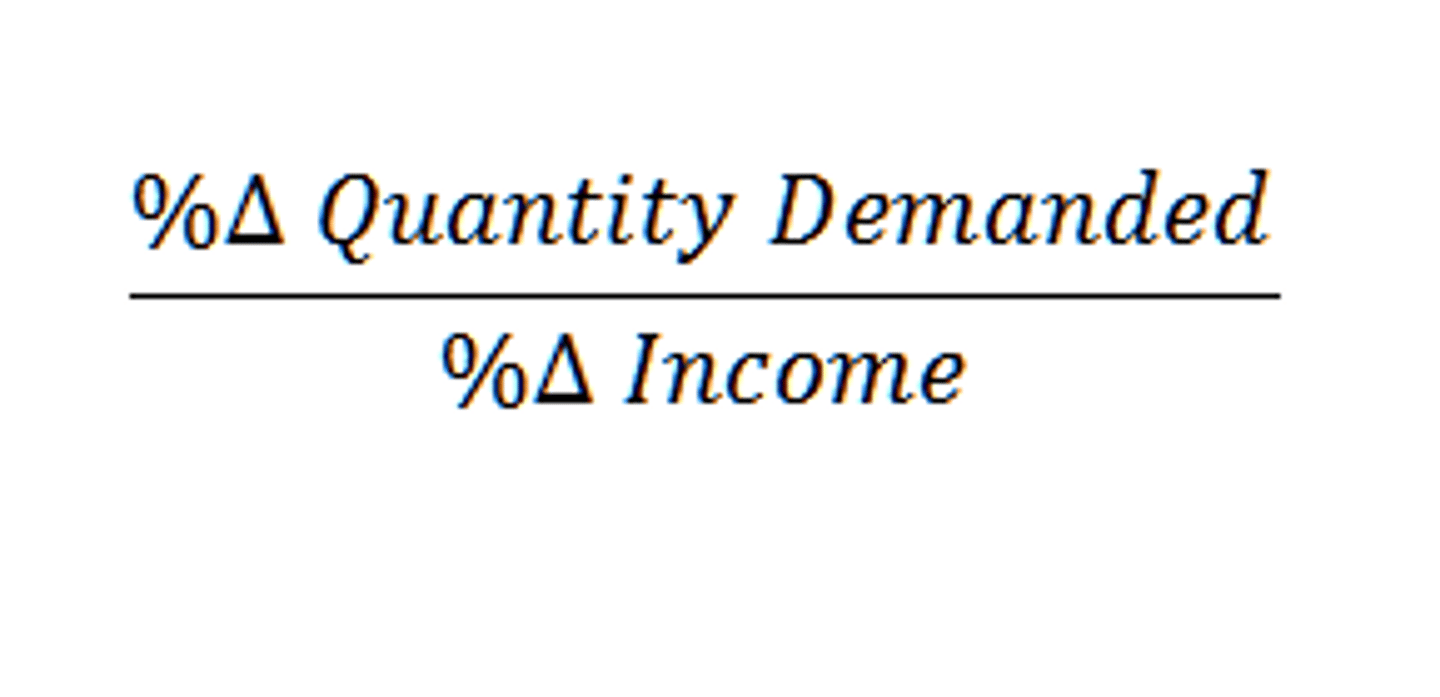
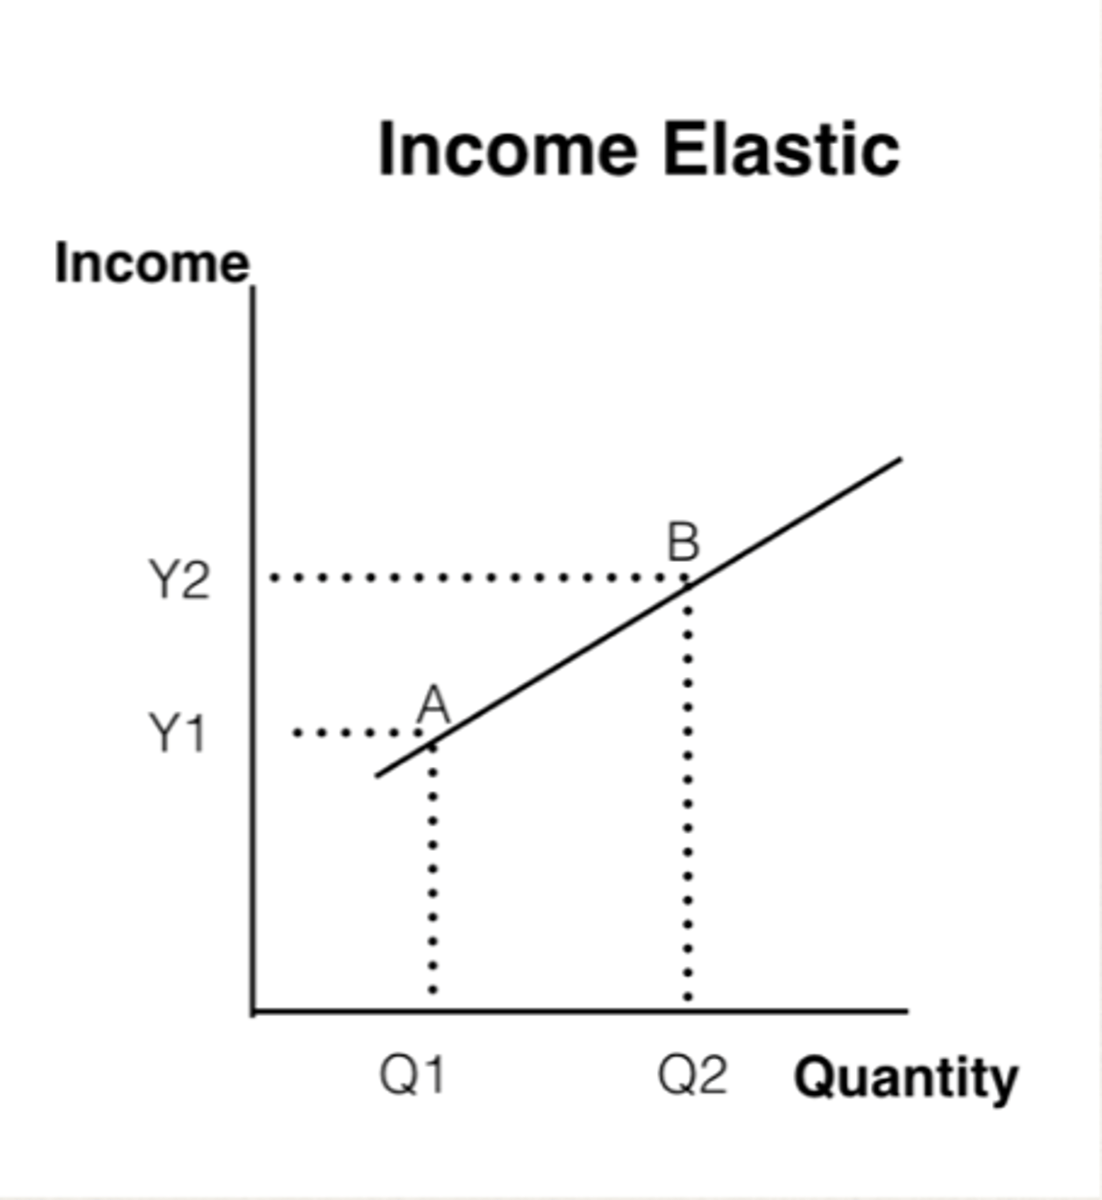
Income Elasticity of Demand
The responsiveness of the quantity demanded to a change in income
YED Formula
Normal Good
• As income rises, demand also rises.
• Known as normal goods, e.g. clothing, food, smartphones
YED > 0

Inferior Good
• As income rises, demand falls
• Known as inferior goods, such as unbranded product or instant noodles
YED < 0
Luxury Good (Elastic YED)
• Demand increases more than proportionately with income Example:
Holidays, designer bags, high-end electronics
YED > 1
Necessity Good (Inelastic YED)
• Demand rises less than proportionately as income increases
Example:
Bread, milk, toothpaste, consumers only buy what they need
0 < YED < 1
Determinants of YED: Nature of the Good
Analysis:
• Goods classified as necessities usually have a positive YED less than 1, meaning demand rises with income but less than proportionately
• Luxury goods have a YED greater than 1, showing demand grows faster than income
• This distinction reflects how consumers prioritize spending depending on the type of good
Evaluation:
• Classification can be subjective and vary between individuals
• E.g. a smartphone might be a necessity in developed countries but a luxury in developing ones
• Economic development, cultural factors individual preferences mean the YED of a good can shift over time or differ between markets
Determinants of YED: Time Period
Analysis:
• In the short run, consumers may not immediately adjust their consumption in response to income changes due to contracts, habits or lack of substitutes so demand appears less income elastic
• Over long term, as consumers adapt and incomes stabilize the demand for many goods may become more income elastic
Evaluation:
• Some consumers may quickly increase spending on luxuries while other remain cautious
Determinants of YED: Quality and branding
Analysis
• High quality and well branded products often show higher YED as consumers with rising incomes are more willing to pay a premium for status, durability or perceived value
• Marketing and celebrity endorsements can increase demand sensitivity to income changes by enhancing the product's desirability
Evaluation:
• Some consumers may continue purchasing their preferred brands regardless of income making demand less responsive
Determinants of YED: Temporary vs Permanent Income Changes
Analysis:
• Consumers are more likely to increase spending on luxury goods when they perceive income changes as permanent leading to higher YED
• Temporary income boosts tend to be saved or spent cautiously, so demand may not rise as much
Evaluation:
• Consumer confidence, expectations about the economy and personal circumstances may influence spending decisions more than the actual nature of income changes, leading to inconsistent effects on YED
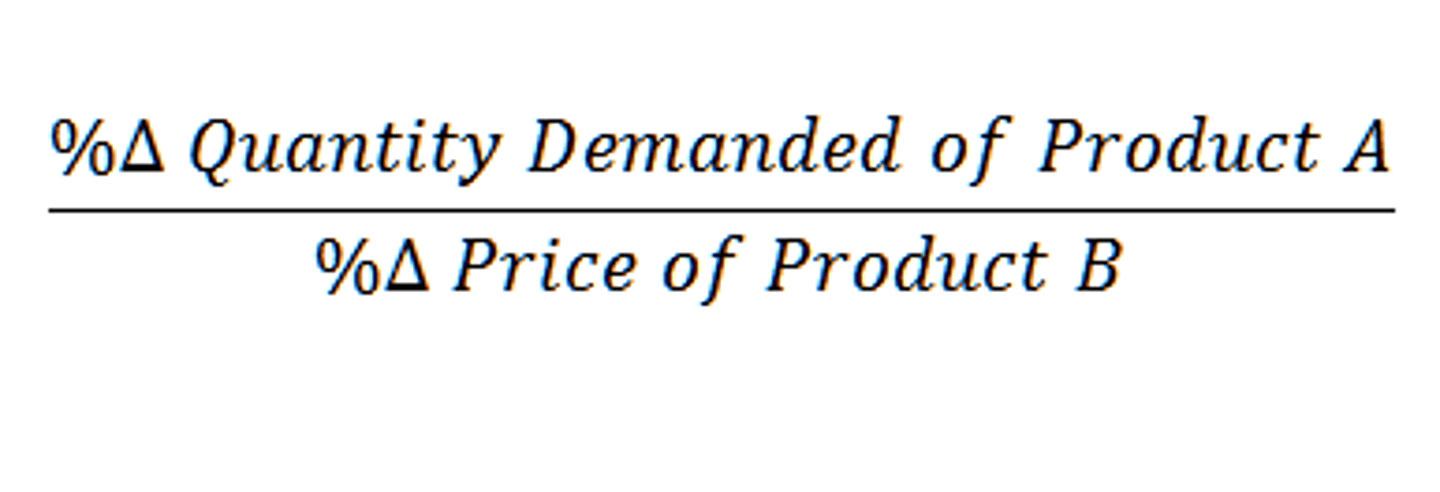
Cross Elasticity of Demand
The responsiveness of demand for one product in relation to a change in the price of another product
XED Formula
Substitutes
• A positive cross elasticity of demand means that as the price of good A increases, the demand for good B increase
• This is because the goods are substitutes so consumers switch to the cheaper alternative
XED > 0
Examples:
Apple and Samsung
Playstation and Xbox