risk perception
 Call Kai
 Learn
Learn Practice Test
 Spaced Repetition
 Match
Match Flashcards
 Knowt Play
1/48

There's no tags or description
Looks like no tags are added yet.
Name | Mastery | Learn | Test | Matching | Spaced | Call with Kai |
|---|
No analytics yet
Send a link to your students to track their progress
49 Terms
what is risk (Fischhoff et al., 1984)
no one agreed definition, but concerns the potential of gaining/losing something of value resulting from a given action/inaction which can be forseen/unforeseen
values could be physical/emotional health, social status, wealth etc.
what is risk perception
the subjective judgement that people make about the severity + probability of a risk → this varies between people (some more risk averse than others)
how did Slovic et al. (1981) assess perceived risk between groups
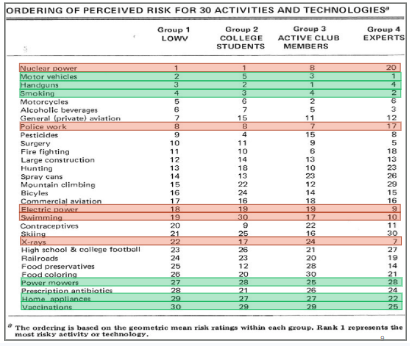
got 4 groups of participants to order their perceived risk for different activities + technologies:
league of women’s voters
college students
active club members
experts
showed large disparities between the way groups ranked risks overall
how did technical expert judgements differ from lay judgements in Slovic et al. (1981)’s study
overall, technical expert judgements are in line with objective data, while lay judgements don’t agree with objective data
e.g. LOWV + college students ranking nuclear power much higher than experts, who ranked electrical power much higher proportionally
lay judgements did not agree with lay estimates of current annual fatalities (e.g. ranking nuclear power as low annual deaths + high risk)
in what two ways do risk perceptions affect political attitudes
level of perceived risk of terrorism predicts support for aggressive anti-terrorism strategies (through voting Bush; Huddy et al., 2005)
public perception of climate risk predicts support for climate change policies (Taylor et al., 2014)
in what 2 ways have researchers found risk perceptions affect behaviour
found an estimated 1,500 Americans died in car crashes after 9/11 due to rates of increased road travel to avoid the perceived risk of flying (which had less fatalities in comparison) (Gigerenzer, 2006)
20-30 excess abortions occurred in Italy in the 5 months following the Chernobyl explosion → mothers worried about radiation risk
in what 2 ways have researchers found risk perceptions affect economy/society
decrease in footfall + tourism following 2 Salisbury poisonings led to £3.7 million fund from the government to help them recover → increased risk perception of Salisbury affected UK’s travel there
UK entered recession after gross domestic product dropped 20.4% in 2020 → footfall was significantly lower after COVID outbreak, affecting businesses
in what ways to risk perceptions allow governments + educators to communicate risks to the public better
participants were more concerned about the radiation from a dirty bomb than the explosion itself → public should be more aware of bomb risk (Acton et al., 2007)
concerns about vaccine side-effects/safety reduces COVID vaccination willingness → health experts need to weight against benefits more effectively to increase willingness
what is the aim of protection motivation theory (Rogers + Prentice-Dunn, 1977)
explains the behavioural impact of health risk information as a psychological determinant of behaviour
what is ‘protection motivation’ in protection motivation theory (Rogers + Prentice-Dunn, 1977)
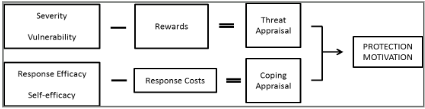
a motive that arouses, sustains + directs activity → usually measured using intentions to complete the relevant protective behaviour. protective behaviour occurs when protection motivation = high
what two cognitive appraisals combine to form protection motivation (Rogers + Prentice-Dunn, 1977)
threat appraisal → considers risky behaviour
coping appraisal → considers the adaptive/protective behaviour
what are the three aspects of threat appraisal (Rogers + Prentice-Dunn, 1977)
the perceived severity of the threat (‘I could get lung cancer’)
the probability of being vulnerable to the threat (‘my grandfather died of lung cancer, so I am likely to get it if I continue smoking’)
rewards of the risky behaviour (‘smoking helps me concentrate’)
what are the three aspects of coping appraisal (Rogers + Prentice-Dunn, 1977)
response efficacy → the efficacy of the health behaviour for dealing with the threat (‘if I quit smoking, I can still reduce my risk of getting cancer’)
self-efficacy → confidence for being able to engage in the behaviour (‘I have quit drinking so I will be able to quite smoking’)
response costs of the adaptive behaviour (‘if I stop smoking, the calming effects will be gone’)
how do the variables in PMT interact with one another (Rogers + Prentice-Dunn, 1977)
coping appraisal (response/self-efficacy - response costs) and threat appraisal (perceived severity + vulnerability - rewards) both interact to influence motivation for the protective behaviour
e.g. those who have low coping appraisal are less likely to perceive threat as severe, so will have lower intentions to perform protective behaviour
high coping appraisal = greater perceived threat = greater intentions to perform protective behaviour
what evidence did Floyd et al. (2000) find for the relevance of different variables in PMT
performed review of 65 studies that represented 20 health behaviours + found:
increases in threat severity (.48), threat vulnerability (.21), response efficacy (.55) + self-efficacy (.45) increases adaptive intentions/behaviour
increased risky behaviour rewards (.52) + protective behaviour response costs (1.05) decreases adaptive intentions/behaviour
shows coping variables show slightly stronger (moderate-large effect) relations with adaptive behaviours than threat variables (small-moderate)
what evidence did Malmir et al. (2000) find for the effect of PMT on cervical screening attendance
completed an RCT → participants had to complete a questionnaire including constructs + demographic variables, then experimental condition:
placed in educational intervention based on PMT → 6 sessions of lectures, group discussions booklets covering topics e.g. epidemiology, symptoms, risk factors + importance of early detection
found the intervention had significant effects on construct scores + screening attendance were significantly increased after 3 months
what are 4 possible issues with studies testing PMT constructs
many studies measure intentions rather than behaviour → intention-behaviour gap issue
measurement of intentions are often vague with no time frame → people with more perceived vulnerability may intend to change behaviour earlier than others
when behaviour is assessed, self-report measures often used → subject to social desirability/recall bias
measurement of PMT constructs are often not validated/reliable
what is the suggested reason for smaller relationships between threat appraisals + protective behaviour (Brewer et al. (2007)
threat appraisals are better predictors of behaviours intended to reduce specific health threats, e.g. getting vaccinated, but less for behaviours that have variety of health + social consequences, e.g. exercise
research found correlation between perceived vulnerability + vaccination intentions = stronger than behaviours with wider consequences
what are 2 issues with many experimental designs assessing PMT constructs
though experimental designs give methodological strength:
these tend to not use mediation analyses to test if the impact of the intervention is due to changes in PMT constructs → could be confounding variable, e.g. an aspect of the intervention itself
follow-up on behavioural measures after the intervention tends to be short → doesn’t capture whether behaviour change is sustained, so long-term efficacy
what are 4 theories to understanding what influences risk perception
cultural theory
heuristics + biases
the psychometric paradigm of risk
social amplification of risk
what is cultural theory of risk perception (Douglas & Wildavsky, 1982)
risk perceptions = socially constructed by institutions, cultural values + ways of life, so less about personal control
individuals = expected to form perceptions of risk that reflect + reinforce their commitment to one or other ‘cultural ways of life’ → individuals gravitate towards risk perceptions that advance the way of life the commit to
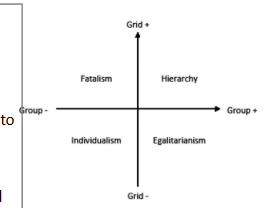
across what 2 dimensions does cultural theory assess people’s views + what are the 4 categories
through group and grid:
strong grid (top) → believes life should be organised through role differentiation based on demographics e.g. sex, ethnicity, wealth etc.
weak grid (bottom) → believes life should be equal, where anyone can participants in any social role
strong group (right) → believes life is a sense of community; people depend on one another
weak group (left) →views life as competitive; people fend for themselves
what would someone who is strong grid + strong group be defined as, and what is their risk perception based on
hierarchy → fears things that disrupt the natural order of society
what would someone who is weak grid + strong group be defined as, and what is their risk perception based on
egalitarianism → fears things that increase inequalities amongst people
what would someone who is strong grid + weak group be defined as, and what is their risk perception based on
fatalist → feels regulated by social groups they do not belong to + are indifferent to risks
what would someone who is weak grid + weak group be defined as, and what is their risk perception based on
individualism → fears things that obstruct their individual freedom
what 3 ways of life from cultural theory did Dake (1991) assess + what were the outcomes
performed cross-sectional telephone survey measuring associations between hierarchy, individualism + egalitarianism, and social risk concerns. found:
hierarchy + individualism were related to concerns about social deviance + war
individualism more concerned about market issues
egalitarianism related to concerns about technology, environment + breakdown of democracy
suggests each cultural way of life is associated with different risk perceptions
what are 4 limitations of cultural theory (Johnson + Swedlow, 2019)
doesn’t allow for individual rational choice
empirical support based on studies using unreliable + non-validated measures of the ‘ways of life’
respondents could + do rate high on more than one world view
only explains a small amount of variance in individual perceptions of risk (e.g. studies typically find about 5% of variance in risk judgements are explained by cultural theory measures)
what is the heuristics + biases approach to explaining risk perception (Tversky + Kahneman, 1974)
found people use a number of heuristics to evaluate information → these are mental shortcuts for thinking that people base judgements of risk based on experience
subject to cognitive biases → may lead inaccurate judgements of risk
what are 2 situations where heuristics are more likely to be used (Tversky + Kahneman, 1974)
especially likely when:
time is short (limited cognitive resources)
information is incomplete/bewildering in terms of possibilities → low self-efficacy for studying facts
what are 3 heuristics/biases related to Tversky + Kahneman (1974)’s approach
affect heuristic
availability heuristic
optimism bias
what are affect heuristics (Tversky + Kahneman, 1974)
the way feelings about a risk object are used by individuals to arrive at conclusions about levels of risk + their acceptability → altering people’s emotions often affect how their perceive a risk
if feelings towards a risk object = positive (e.g. addicted to smoking), there is a tendency to underestimate the potential harm + overestimate benefits
what evidence did Hsee & Kunreuther (2000) find for affect heuristics on sentimentality
asked participants how much they would pay to insure a clock if it was:
a gift from grandparents
had no sentimental value
found people were willing to pay twice as much if it had sentimental value → shows more positive affect heuristic affected behaviour
what evidence did Yamagishi (1997) find for affect heuristics on disease perception
asked participants what was worse out of a disease that kills:
1,300 of every 10,000 people it affects
one that kills 24% of people it affects
found most people choose option a, even though b has higher risk → shows that manipulating emotions by framing changes risk perception
what are availability heuristics + what is this often affected by (Tversky + Kahneman, 1974)
risk perceptions based on how easily one can think of an example of a risky situation happening → direct + indirect suffering explains most variance in risk judgements, so generally an effective heuristic
however mass media affects this in that rare deaths = overestimated and common deaths = underestimated
what support did Keller et al. (2006) find for availability heuristics on flooding risk
participants were asked to imagine they were planning to buy a house, and they received info about the probability of a flood
found availability heuristic based on direct experience affected risk perceptions → participants with own experience of flooding rated riskiness of living in the house much higher than those with no previous experience
what support did Facione (2002) find for availability heuristics on cancer screening
performed survey on women regarding cancer screening behaviour + perceived risk of developing it
heuristics based on direct/indirect experience influenced risk perception → women with history of it or have relatives with it both overestimate their risk
what is optimism bias + what 3 cognitive biases contribute (Tversky + Kahneman, 1974)
the belief that bad things happen to other people more than oneself, e.g. risk of spouse being affected = higher than my risk. contributed to by:
defensive denial → protects from worry
downward comparison → compares to people ‘really’ at risk
egocentrism → believing one takes precautions more than other
this means that someone is more likely to engage in risky behavours
what are 2 examples of empirical evidence of optimism bias
college-aged drivers believe that in all situation of traffic accidents, they would be less at risk than other drivers (Dejoy, 1989)
current smokers believed they had a lower risk of developing lung cancer than the average smoker, and perceived risk didn’t increase with the no. of cigs smoked a day (Weinstein et al., 2005)
what is the aim of the psychometric paradigm to explaining risk perception + what method do they generally use (Slovic et al., 1986)
aims to unveil the dimensions that determine risk perceptions in order to create a taxonomy for hazards that can be used to understand + predict estimates of risk. this is completed in 2 stages:
first participant rates ‘riskiness’ (of death) on a range of hazards ranging from alcoholic beverages to nuclear power
second participant rates each hazard on a range of dimensions, e.g. novelty, severity
researchers assess correlations between rated riskiness + dimension scores to assess which dimensions matter in predicting our estimates of risk
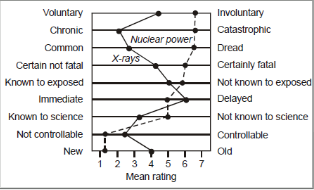
what 9 dimensions were assessed in early psychometric paradigms (Slovic et al., 1986)
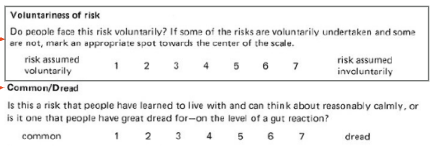
voluntary vs involuntary
chronic vs catastrophic
common vs dreaded
certain not fatal vs definitely fatal
known to the exposed vs unknown
immediate vs delayed effects
known vs not known to science
incontrollable vs controllable
new vs old
what two factors have factor analysis studies identified as contributing to perception of risk (Slovic et al., 1986)
factors include:
dread (as opposed to common) → maps onto lack of control, fatal, risk increasing, involuntary) → strongest correlation with global estimates of risk
unknown (as opposed to known) → maps onto new, unknown to science/those exposed) effect delayed
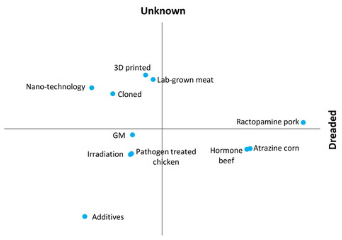
what research support did Jenkins et al. (2020) find for the psychometric paradigm on food hazards
UK sample rated 11 old + new food hazards on 12 risk dimensions → principal components analysis found 2 main components:
dread
knowledge
which explained 80.8% of variance in perceptions
what 4 strengths did Sjoberg et al. (2004) find for the psychometric paradigm
concept for the paradigm replicated many times
different dimensions matter in different situations, but there is research agreement that dread + unknown are important
factor structure = stable
factors account for risk perceptions well → usually explain 70% or more of variance in risk perceptions
what 4 limitations did Sjoberg et al. (2004) find for the psychometric paradigm
works best on aggregate-level data (comparing different risks among groups) → poorer associations at individual level/for individual risks
replication of correlations + factors could be due to artefacts in the question working (they are fairly similar)
risk is often targetless → could be to self, family members etc.
different properties + dimensions seem to matter in different studies → lack of testable predictions
what is the social amplification theory of risk perception (Kasperson et al., 1988)
brings together previous theories to better understand how risk info is disseminated + changed through different actions/interactions
outlines how communication of risk events pass from the sender through intermediate stations to a receiver explaining how risks are amplified or attenuated
believes risk events interact with individual psychological, social + other cultural factors in ways that either increase/decrease public perceptions of risk
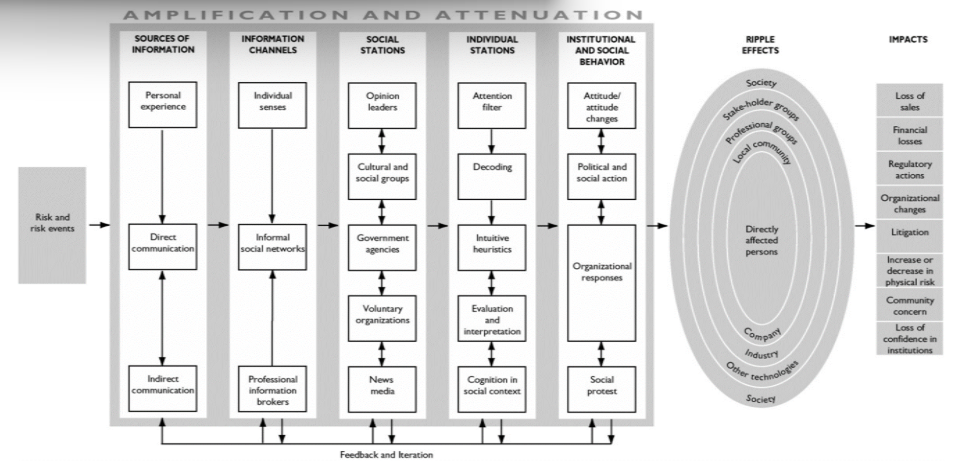
explain the social amplification of risk model (Kasperson et al., 1988)
risk events that occur lead into 5 stages of amplification or attenuation depending on the nature of the path:
sources of info → experience, direct + indirect communication
info channels → senses, social networks, professional info brokers
social stations → leaders, cultural/social groups, government, voluntary organisations
individual stations (cognitive processing) → attention filter, decoding, intuitive heuristics, evaluation + social cognition
institutional + social behaviour → attitude change, organisational responses
these stages cause ripple effects affecting those directly effected, in local community + society → causes societal impacts
what did Frewer et al. (2002) find assessing the social amplification of risk theory on GM food
investigated effect of increased media reporting about the risks associated with GM food on public attitudes to the technology → sent out surveys:
1998 → before media attention peak
1999 → at media coverage peak
2000 → after media attention was subsiding
found perceptions of GM food risk increased during highest levels of media coverage, but decreased as coverage diminished
what are 2 strengths + 3 limitations of the social amplification of risk theory
can explain why certain risks experts characterise as small produce massive public reactions
helps to clarify phenomena e.g. the key roll of mass media in risk communication + the influence of culture on risk processing
amplification may be directed as to what are regarded as ‘exaggerated’ risk rather than general risk events
may be too general to test empirically + to seek outright falsification
formulated 30 years ago → studied within traditional mass media + long before the advent of online media