MCAT Statistics (P/S)
1/146
There's no tags or description
Looks like no tags are added yet.
Name | Mastery | Learn | Test | Matching | Spaced | Call with Kai |
|---|
No analytics yet
Send a link to your students to track their progress
147 Terms
__ occurs when a condition is predicted to be present but in reality is absent.
False Positive
__ occurs when a condition is predicted to be absent but in reality it's present
False Negative
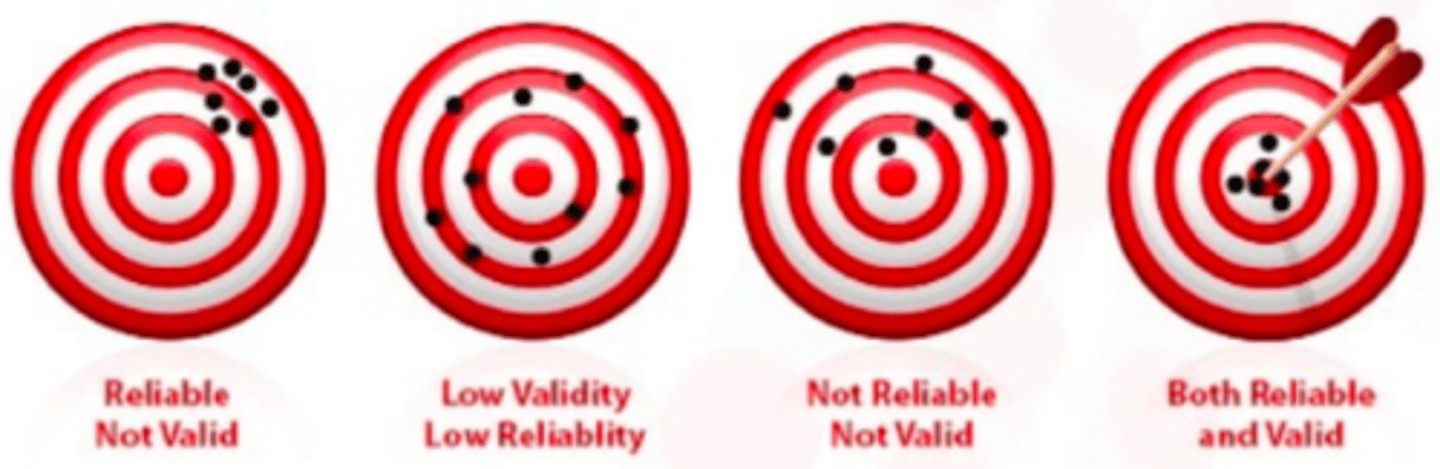
__ refers to the accuracy of a study measure (does the test measure what it claims to measure?)
Validity
__ refers to whether the observed change in the dependent variable is corresponding to a change in the independent variable and not by other variables.
Internal Validity
__ is how generalizable the results of an experiment/study are -> how can the results be applied outside to real-life situations?
External Validity
__ extent to which an experiment/measure consistently produces similar results every time.
Reliability

A __ states/assumes that there is no significant difference between the variables measured.
Null Hypothesis
If you fail to reject the null hypothesis → then we can conclude __
that there is no difference between the variables
(because a null hypothesis states/assumes that there is no significant difference between the variables measured)
The __ hypothesis states that there is a significant relationship between the variables.
Alternative Hypothesis
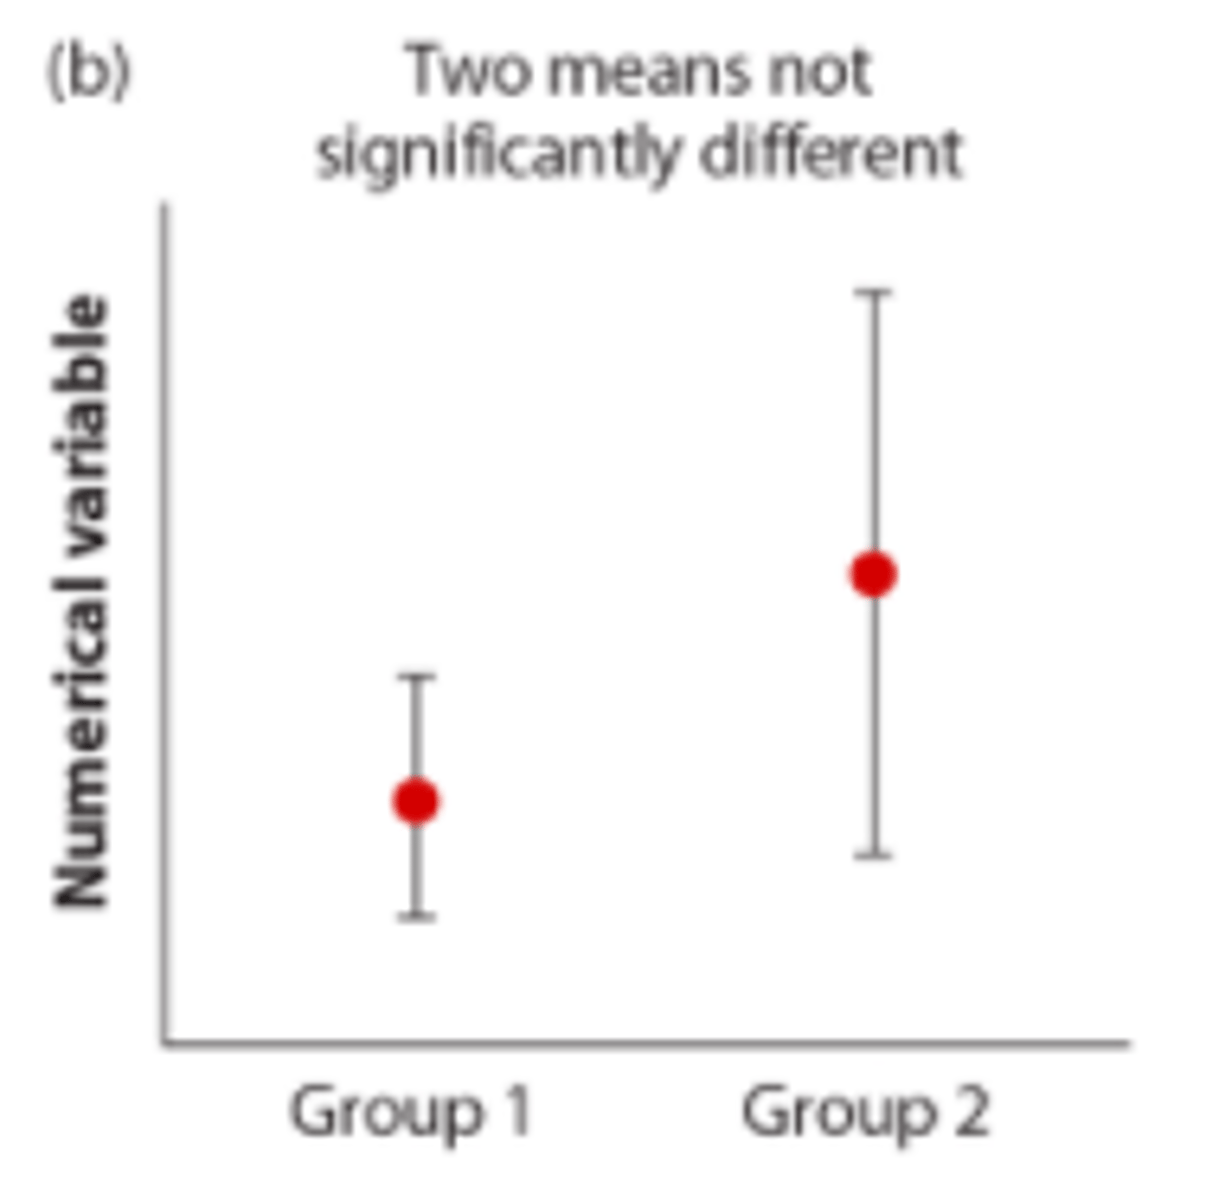
Is there a significant difference between two groups if their 95% confidence intervals overlap?
there may or may not be a statistically significant difference
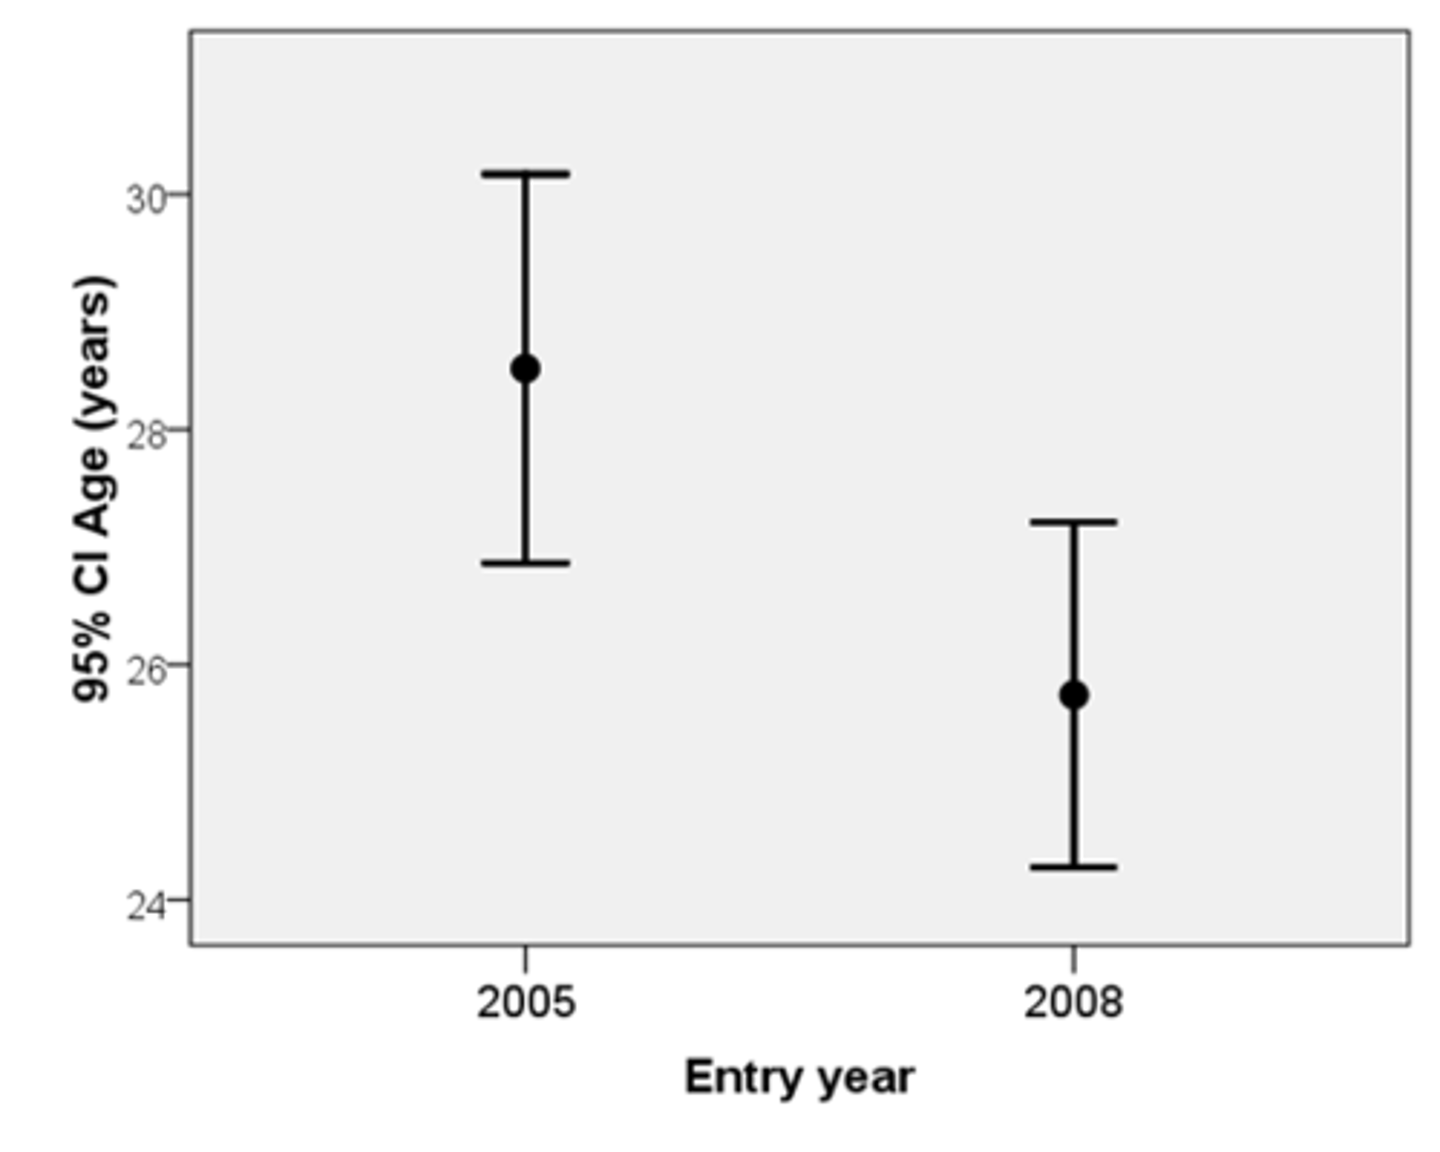
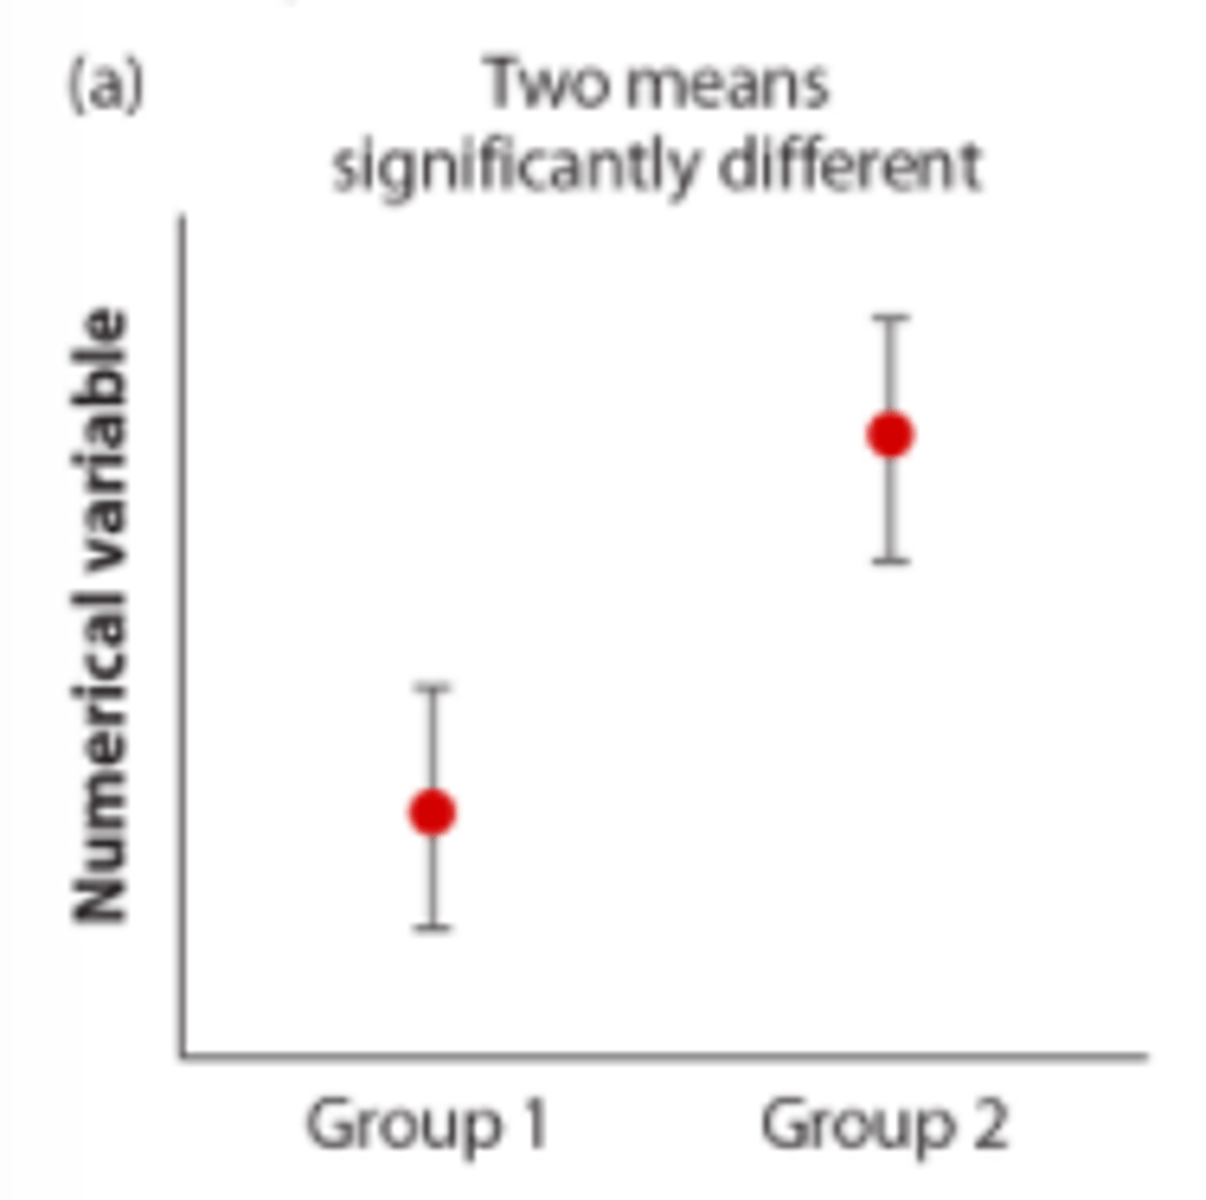
Is there a significant difference between two groups if their 95% confidence intervals do not overlap?
If confidence intervals do not overlap, there is always a statistically significant difference
If the 95% confidence interval of one group overlaps with the confidence interval of another group, are the groups statistically significantly different?
they may or may not be
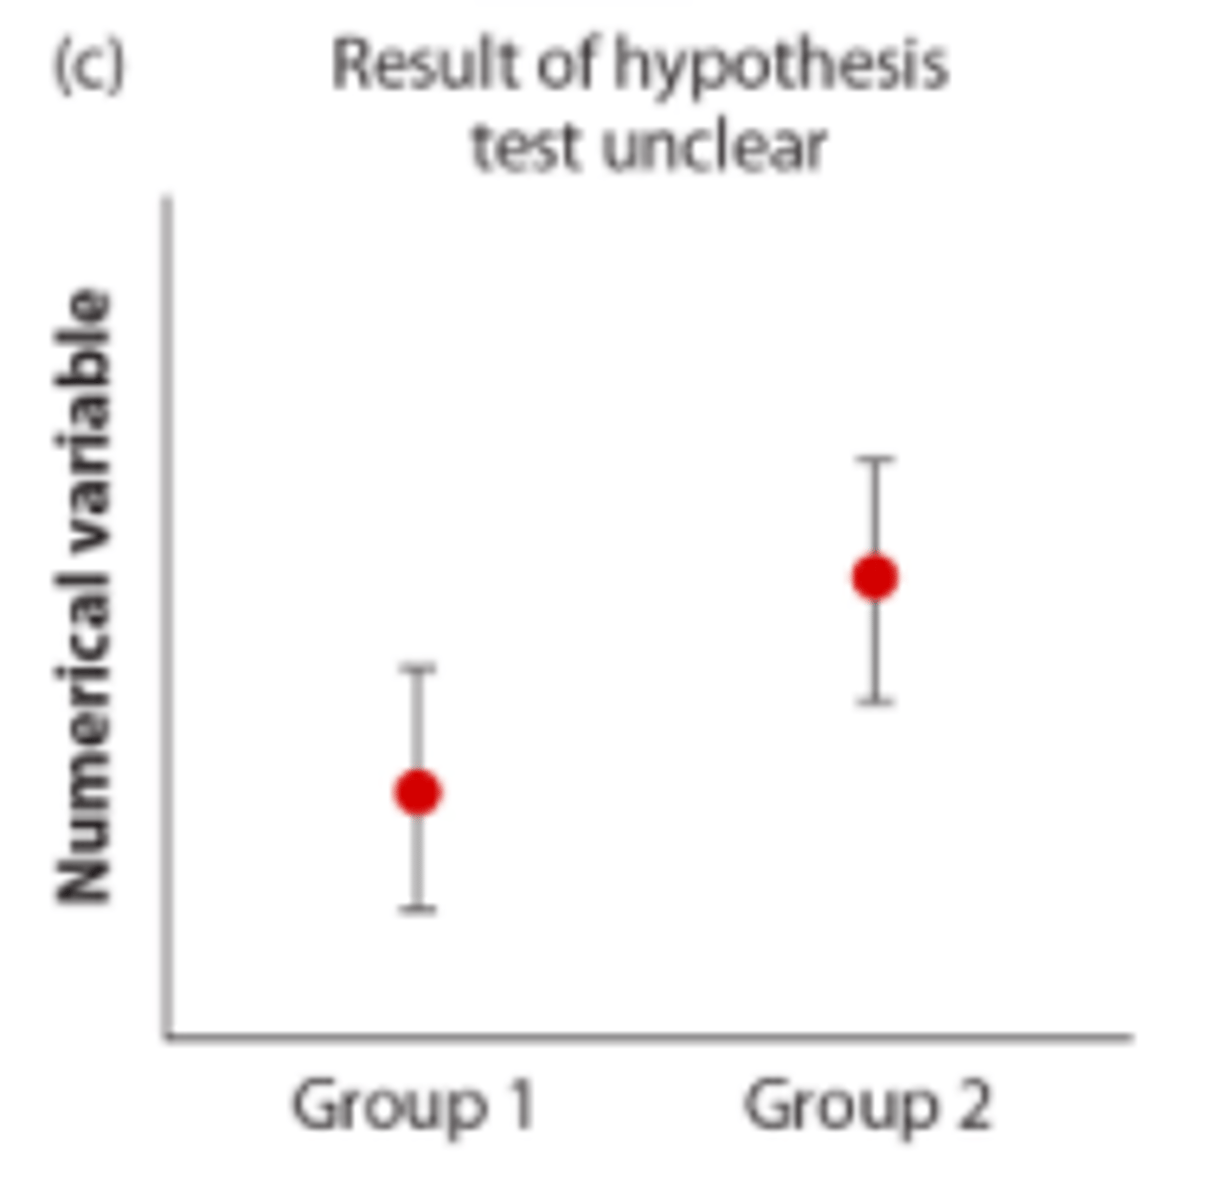
If the 95% confidence interval of one group overlaps with the mean of another group, are the groups statistically significantly different?
NO!
__ allows researchers to compare one subject or group to the other.
standardization
Experimental designs can allow you to make __ conclusions about data
causal conclusions
(because manipulation of one variable, whilst controlling all other variables can allow the researcher to conclude that any changes were the result of the independent variable!)
Why can you make causal conclusions from experiments?
because manipulation of one variable, whilst controlling all other variables can allow the researcher to conclude that any changes were the result of the independent variable!
__ variables are those that are measured/observed by the researcher
dependent
__ variables are those that are set/controlled by the researcher
independent
__ refers to the process of defining variables into measurable factors (e.g. depression or fatigue).
Operationalizing a variable
*since you are strictly defining what you are measuring, you can establish a causal relationship between the variables if you find that one exists
A __ is a measure of uncertainty in a reported value done by indicating how far the value reported might be from the true value.
confidence interval
What does a 95% confidence interval mean?
If the same experiment was run many times, we can expect our confidence interval to contain the true value 95% of the time.
__ is a type of study in which people are allocated at random (by chance alone) to either the experimental or control condition.
Randomized controlled study
A __ study is a type of survey, questionnaire, or poll in which respondents read the question and select a response by themselves without researcher interference.
self-report
Validity is equivalent to __
accuracy
(validity = are you getting the right answer?)
__ refers to the degree of confidence that the causal relationship being tested is trustworthy and not influenced by other factors
Internal validity
__ is a type of external validity which describes how well the sample used can be extrapolated to a population as a whole.
Population Validity
__ is a measure of whether or not the observed associations can be generalized from the sample to other people, organizations, contexts or time.
Ecological Validity
__ is a measure of how well a particular test correlates with a previously validated measure.
Concurrent Validity
ie Researchers give a group of students a new test, designed to measure mathematical aptitude and the results of the new test are compared to those of the old test that has been previously validated. If kids who scored high on the old test also score high on the new test, then the new test has high concurrent validity.
__ is a measure of the extent to which an assessment is able to predict something it is aiming to predict. Determining this type of validity involves testing a group of subjects for a certain construct, and then comparing them with results obtained at some point in the future.
Predictive Validity
__ validity assesses whether the variable that you are testing for is addressed by the experiment.
Construct validity
ie You might design whether an educational program increases artistic ability amongst pre-school children. Construct validity is a measure of whether your research actually measures artistic ability, a slightly abstract label.
A __ study is a type of research design where a researcher seeks to understand what kind of relationships naturally occurring variables have with one another.
correlational study
__ is a qualitative method for studying human social phenomena.
ethnography
A __ is a gathering of deliberately selected people who participate in a facilitated discussion
focus group
__ studies include watching and recording the actions of participants.
Observational Studies
*Can occur in natural setting or behind a one-way glass.
*This can volve recording the frequency or duration of events.
What is the main strength and the main weakness of observational studies?
Strength:
researcher can view how people behave rather than relying on self-report.
Weakness:
they do not allow the researcher to explain causal relationships
What 3 conditions must an experiment have in order to establish cause and effect?
1. The independent & dependent variables must be related in some way
2. The cause must come before the effect
*we must first establish a baseline before exposing subjects to the independent variable (cause) to see the dependent variable (effect) results
*ie if we're studying economics and we want to know if inflation causes unemployment we first have to make sure inflation starts before unemployment rises
3. The cause must be isolated
*we must ensure that no outside, unknown variables are actually causing the effect
The __ group is the group which is exposed to an independent variable or condition.
Experimental Group
The experimental group is exposed to the __ variable
independent variable
The __ group is not exposed to the independent variable
control group
The phenomenon that your perception of how effective you think a treatment will be influences how effective the treatment actually is.
Placebo Effect
__ studies are those that explore a single case or situation in great detail.
Case Studies
What is the major advantage and major disadvantage of case studies?
Advantage: get a much deeper understanding of the case
Disadvantage: findings from case studies cannot be generalized to larger population because causes are not randomly selected and no control group is used.
Why can't the findings from case studies be generalized to the larger population?
because causes of events/diseases/actions are not randomly selected and no control group is used
__ are standard sets of question given to a group of subjects
surveys
Surveys yield __ information on a wide variety of things
surface information
A __ is an example of a survey where people say what they do or how they feel.
Self-Report
Self-reports are limited in their accuracy because of the __
Social Desirability Bias
(the tendency of survey respondents to answer questions in a manner that will be viewed favorably by others.)
__ is the tendency of survey respondents to answer questions in a manner that will be viewed favorably by others.
social desirability bias
__ are the techniques used in lifespan research
developmental designs
__ is a type of observational study that analyzes data from portion of the population (who vary in age, gender, and other demographic measures), or a representative subset, at one specific point in time
Cross-Sectional Study
In a cross-sectional study, respondents are measured how many times?
only once!
*these studies look at a portion of the population or a representative subset only at one specific time point
__ research begins with a group of people who are of the same demographic measures and measuring them repeatedly over time.
Longitudinal Research
What is the major advantage and major disadvantage of longitudinal research?
Advantage: can compare a person's measurement to when they were younger or when they are older
Disadvantage: subjects can drop out over time and it's expensive
__ research combines aspects of cross-sectional and longitudinal research
Cross-Sequential Research
In a __ study the participant does not know whether they are receiving the treatment or placebo.
Blind Study
In a __ study neither the researchers nor the participants know who is getting the treatment vs placebo.
Double-Blind Study
A __ study is where people are randomly allocated into treatment and placebo groups to determine the efficacy of an intervention/treatment
Randomized Controlled Trial
What is the purpose of a randomized controlled trial?
random allocation to treatment and placebo groups allows research to better determine if an intervention/treatment is efficacious because there is no bias in who gets treatment and who does not
__ is a study that compares patients who have a disease or outcome of interest with patients who do not have the disease or outcome, and looks back retrospectively to compare how frequently the exposure to a risk factor is present in each group to determine the relationship between the risk factor and the disease.
Case-Control Study
__ is an epidemiological technique that maps connections between individuals to study the spread of diseases in a population.
Social Network Analysis
__ is a qualitative technique used to examine the text and images involved in human communication.
Content Analysis
A strong positive correlation exists when __
r > 0.7
An r value of +1 indicates a __
perfect positive correlation
An r value of -1 indicates a __
perfect negative correlation
An r value of 0 indicates a __
no correlation exists between the variables
What is positive correlation?
as one variable increases, so does the other
What is negative correlation?
as one variable increases, the other decreases
Surveys have poor __ validity
internal
Why do surveys have poor internal validity?
because we can't manipulate the independent variable
internal validity = whether the observed change in the dependent variable is corresponding to a change in the independent variable and not by other variables.
Through __ we can minimize the effects of the variables we are not studying, which improves __ validity
Through randomization we can minimize the effects of the variables we are not studying, which improves external validity
(because if we know that the only two variables interacting with each other are the independent and dependent variable then we can establish a causal relationship that likely applies to the general population)
__ occurs when every member of the population does not have equal likelihood of being in research sample
Sampling Bias
What is the difference between random selection and random assignment?
Random Selection = sample is selected randomly
Random Assignment = subjects selected in a non-random manner but are randomly assigned into groups.
T/F: in random assignment, subjects are not selected randomly but are randomly assigned to experimental or control group
True -> you use random assignment in drug trials because you need to make sure you're studying the people with the disease, but you don't want to bias your data (ie you don't want to put all the mildly sick people in the experimental group and have them all get better because that's not an accurate representation of the effectiveness of a drug)
If a confounding variable caused an effect → the relationship between dependent and independent variable is known as __.
spurious
ie There is a relationship between ice cream consumption and number of drowning deaths → but this can also be explained by the fact that the season influences both variables → during the summer, warmer temperatures lead to increased ice cream consumption and people swimming more. Thus there is a spurious relationship between ice cream consumption and number of drowning deaths
A __ variable is an outside influence correlates with both the dependent and independent variable.
confounding variable
A confounding variable correlates with __
both the independent & dependent variable!
ie There is a relationship between ice cream consumption and number of drowning deaths → but this can also be explained by the fact that the season influences both variables → during the summer, warmer temperatures lead to increased ice cream consumption and people swimming more. Thus there is a spurious relationship between ice cream consumption and number of drowning deaths
Random errors occur due to __
the precision of the equipment being used
Systematic errors occur due to __
how well the equipment was used or how well the experiment was controlled
__ occurs when researchers intentionally or unintentionally influence the results, leading to results that confirm the researcher's expectations.
Experimenter Bias
__ refers to how the order or placement of survey/questionnaire questions can potentially impact the result
Question-Order Bias
A __ is a summary statistic that represents the center point or average of a dataset.
measure of central tendency
(includes mean, median, and mode!)
What are some measures of central tendency?
mean, median, mode
__ is the average of a set of data, calculated by adding up all of the individual values and dividing by the number of values present.
Mean
__ is not a good measure of central tendency when there is an outlier
mean
(because outliers can massively impact/skew the mean of a data set)
The mean of a data set is not a good measure of central tendency when __
when there is an outlier
(because outliers can massively impact/skew the mean of a data set)
The __ is the midpoint of a set of data.
Median
The __ (a measure of central tendency) is least influenced by the presence of outliers in a data set
Median
The median is not useful for __
data sets with very large ranges
How can you determine if outliers are present in a set of data without actually know the data points?
compare the mean and median
if they are far apart from each other, then outliers must be present because median is not skewed by outliers and median is very easily skewed by outliers
What percentage of data falls within 1 standard deviation of the mean?
68%

What percentage of data falls within 2 standard deviations of the mean?
95%
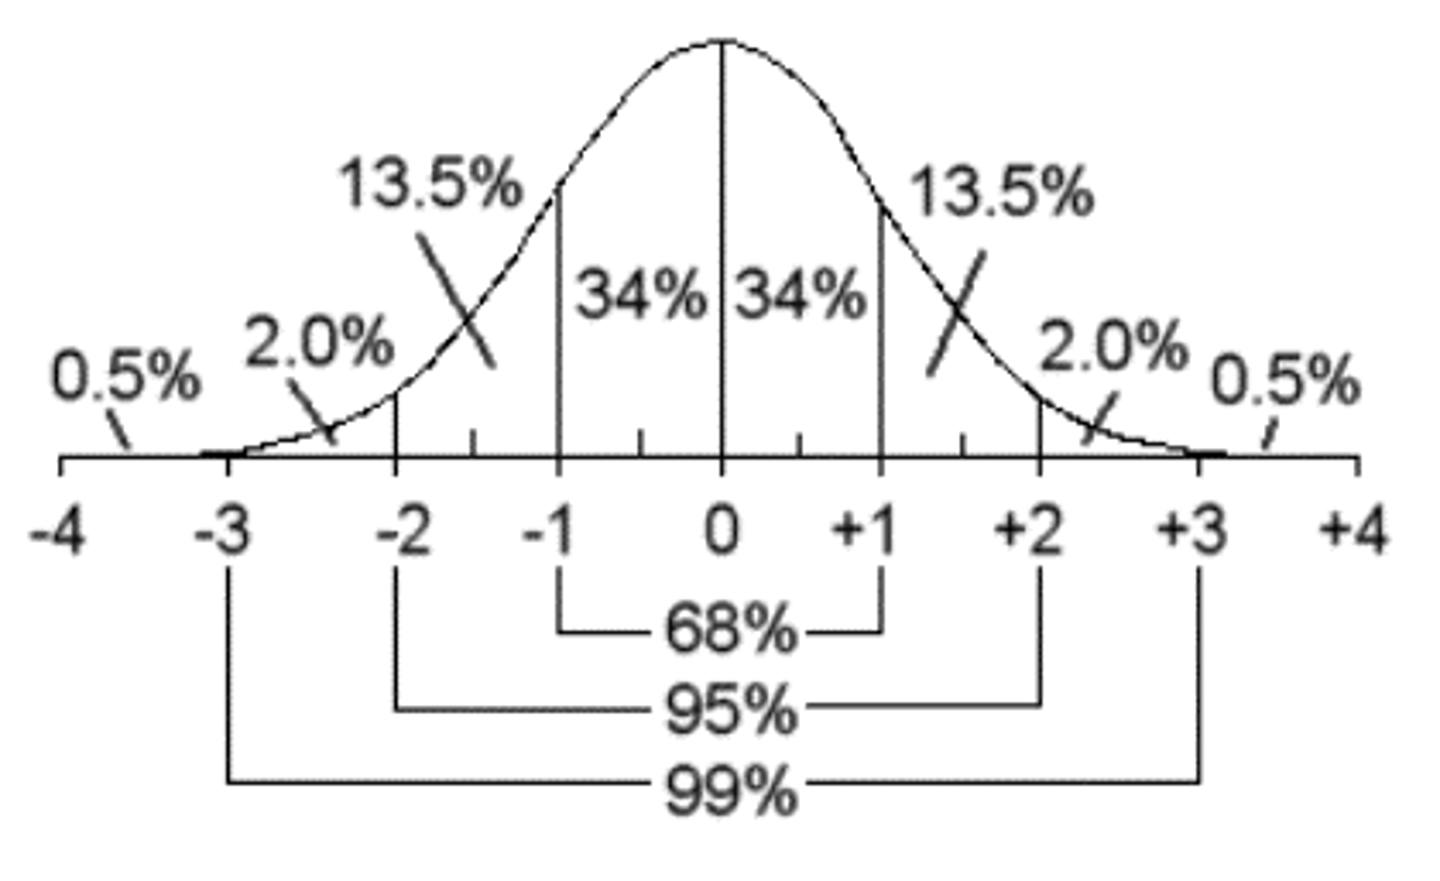
What percentage of data falls within 3 standard deviations of the mean?
99.6%

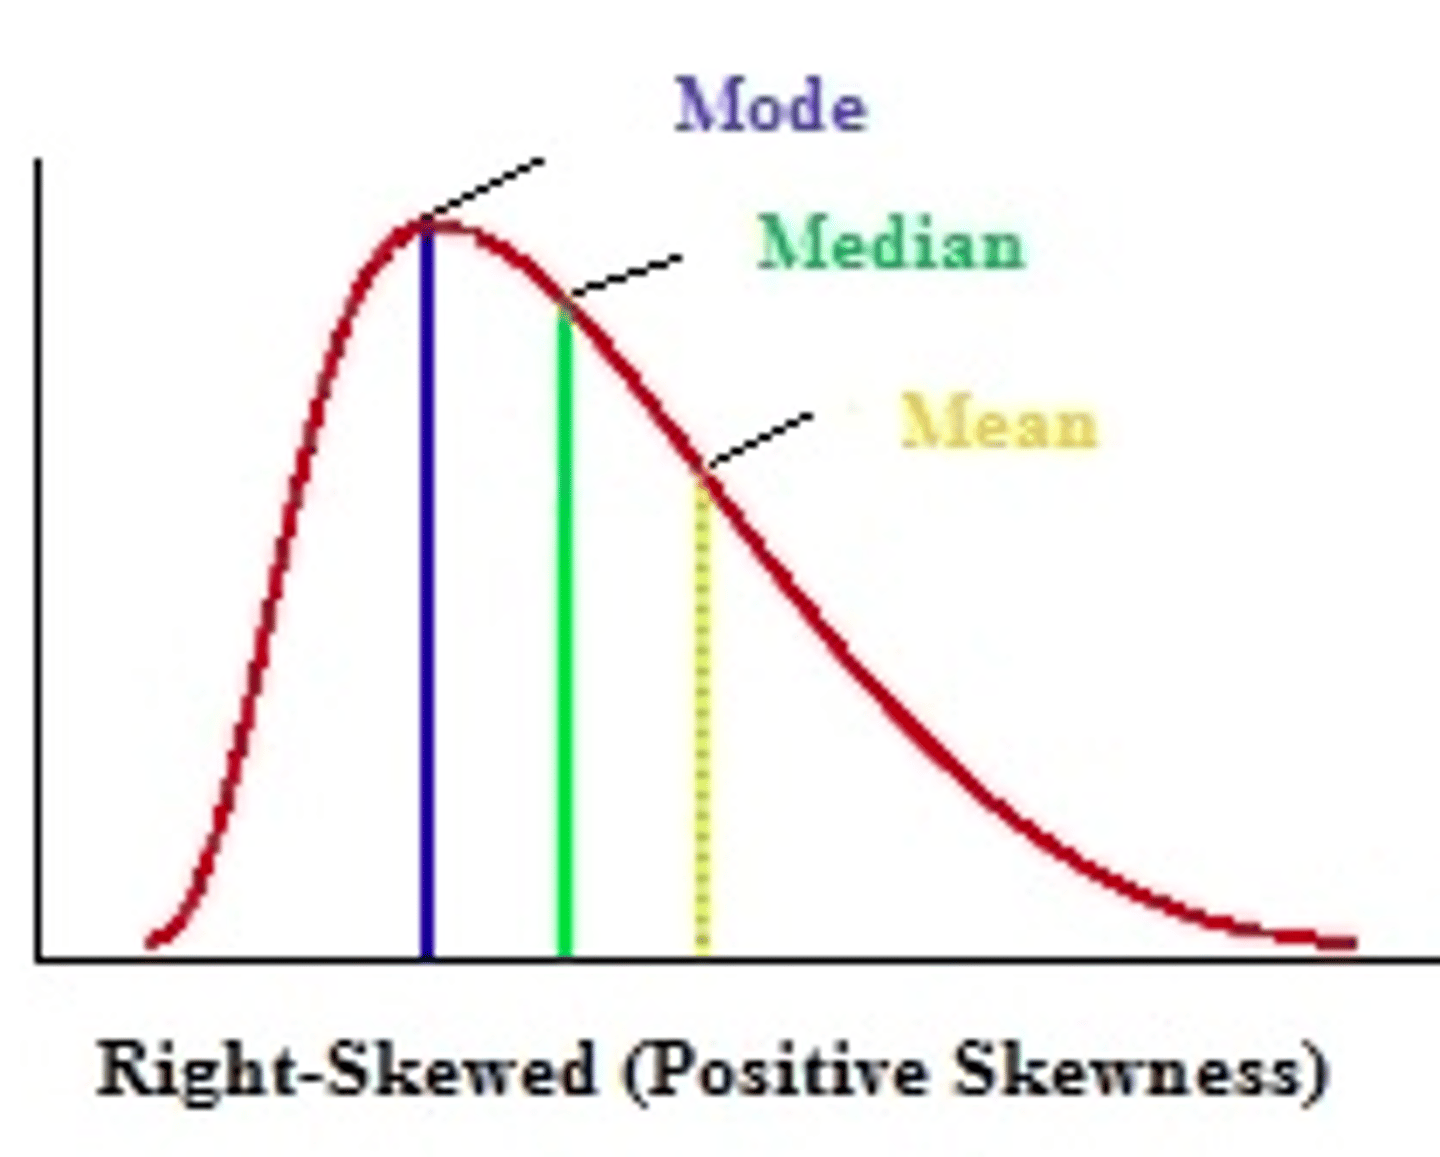
__ is the data value or interval which appears most often in a data set.
Mode
__ is a data distribution that is symmetrical and resembles a bell curve
normal distribution

The majority of data lie within __ SD of the mean
3 standard deviations

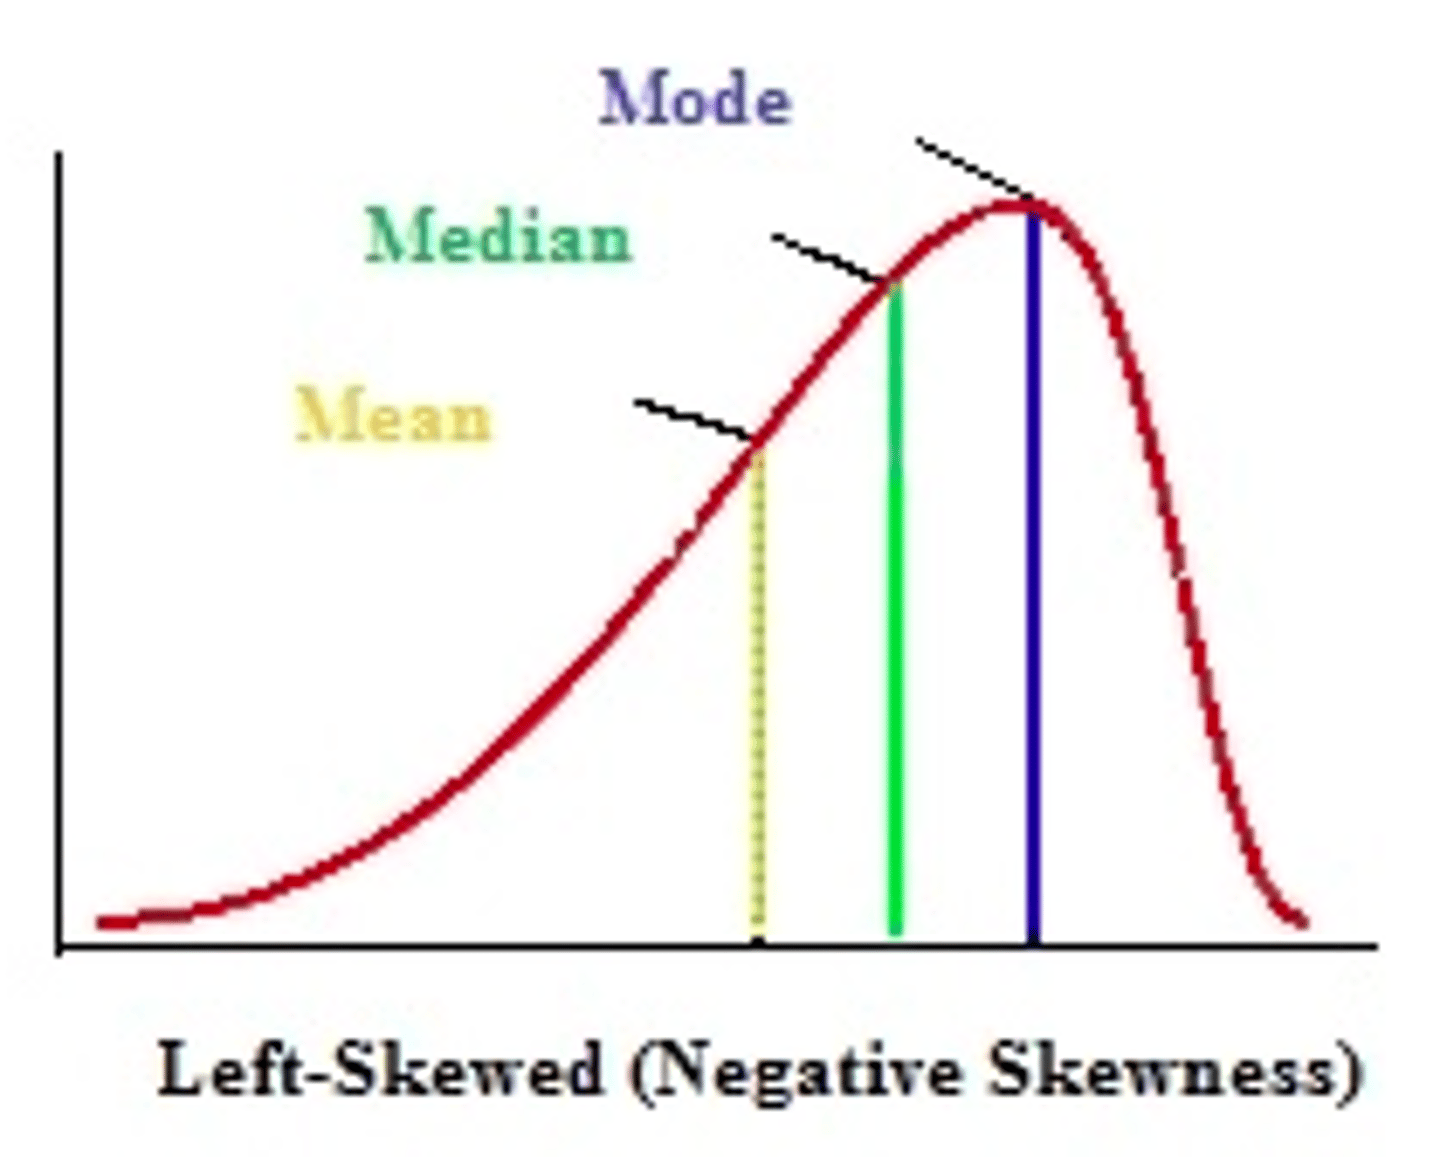
When data is __ skewed the tail is on the left
negatively

What does a curve where data is negatively skewed look like?
negatively skewed = left skewed

Data is skewed __ when the mean is lower than the mode, which occurs due to __
Data is skewed negatively (left) when the mean is lower than the mode, which occurs due to presence of outliers

A positively/negatively skewed graph is skewed to the left
left skewed = negatively skewed
When data is __ skewed the tail is on the right
positively