SCM 352 EXAM 2
0.0(0)
Studied by 2 peopleCard Sorting
1/91
Earn XP
Description and Tags
Last updated 10:12 PM on 10/30/22
Name | Mastery | Learn | Test | Matching | Spaced | Call with Kai | Chat |
|---|
No analytics yet
Send a link to your students to track their progress
92 Terms
1
New cards
1. Make-to-order (MTO, Custom) goods and services
generally produced and delivered as one-of-a-kind or in small quantities, and are designed to meet specific customers’ specifications. (ships, weddings, custom jewelry, estate plans, buildings, and most surgery.)
2
New cards
1. Assemble-to-order (ATO, Option) goods and services
are configurations of standard parts, sub assemblies, or services that can be selected by customers from a limited set. (Ex: Dell computers, Subway sandwiches, machine tools, and travel
agent services.)
agent services.)
3
New cards
1. Make-to-stock (MTS, Standard) goods and services
goods and services are made according to a fixed design, and the customer has no options from which to choose. (appliances, shoes, sporting goods, credit cards, online Web-based
courses, and bus service.)
courses, and bus service.)
4
New cards
2. [four types of processes]
5
New cards
2. Projects
are large-scale, customized initiatives that consist of many
smaller tasks and activities that must be coordinated and completed to finish on time and within budget.
(Legal defense preparation, construction, custom jewelry, consulting, building airplane, custom software development, cruise ships.)
smaller tasks and activities that must be coordinated and completed to finish on time and within budget.
(Legal defense preparation, construction, custom jewelry, consulting, building airplane, custom software development, cruise ships.)
6
New cards
2. Job shop processes
are organized around particular types of general-purpose equipment that are flexible and capable of customizing work for
individual customers.
(Many small manufacturing companies are set up as job shops, as are hospitals, legal services, commercial printing, and some restaurants.)
individual customers.
(Many small manufacturing companies are set up as job shops, as are hospitals, legal services, commercial printing, and some restaurants.)
7
New cards
2. Flow shop processes
are organized around a fixed sequence of activities
and process steps, such as an assembly line, to produce a limited variety of similar goods or services.
[Characteristics: Little or no setup time, dedicated to small range of goods that are similar, similar sequence of process steps, moderate to high volume. Many option-oriented and standard goods are produced in flow-shop settings.]
ex: cars, appliances, insurance policies, checking account statements, cafeterias
8
New cards
2. A continuous flow process
creates highly standardized goods or services, usually around the clock in very high volumes.
Characteristics: not made from discrete parts, very high volumes in a fixed processing sequence, high investment in system, 24/7 continuous operation, automated, dedicated to a small range of goods or services.
Characteristics: not made from discrete parts, very high volumes in a fixed processing sequence, high investment in system, 24/7 continuous operation, automated, dedicated to a small range of goods or services.
9
New cards
3. [product-process matrix]
10
New cards
4. [Customer-routed services and provider-routed services]
11
New cards
4. Customer-routed services
are those that offer customers broad freedom to select the pathways that are best suited for their immediate needs and wants, from many possible pathways through the service delivery system.
Examples: include searching the Internet, museums, health clubs, and amusement parks.
Examples: include searching the Internet, museums, health clubs, and amusement parks.
12
New cards
4. Provider-routed services
constrain customers to follow a very small number of predefined pathways through the service system.
Ex: logging into bank account, newspaper dispenser
Ex: logging into bank account, newspaper dispenser
13
New cards
5. [utilization analysis and bottleneck]
14
New cards
5. Utilization (U)
is the fraction of time that a workstation is being used. Utilization can be computed in two ways,
1. Utilization (U) = (Resources Used) / (Resource Availability)
2. Utilization (U) = (Demand Rate) / (Service Rate × Number of Servers)
1. Utilization (U) = (Resources Used) / (Resource Availability)
2. Utilization (U) = (Demand Rate) / (Service Rate × Number of Servers)
15
New cards
5. Throughput
is the output rate of a process.
16
New cards
5. Bottleneck
is the work activity that limits throughput of the entire process.
(something with the lowest "output/per time"
(something with the lowest "output/per time"
17
New cards
6. [Flowchart versus value stream map]
18
New cards
6. process map (flowchart)
describes the sequence of all process activities and tasks necessary to create and deliver a desired output or outcome. A process map can include the flow of goods, people, information, or other entities, as well as decisions that must be made and tasks that are performed. Process maps document how work either is, or should be, accomplished, and how the transformation process creates value.
19
New cards
6. process boundary
marks the beginning and end of a process.
20
New cards
6. value stream map (VSM)
shows the process flows in a manner similar to a
traditional process flowchart or service blueprint. However, VSM is different from the others because it highlights value-added versus non-value-added activities, and include costs associated with value-and non-value added activities.
traditional process flowchart or service blueprint. However, VSM is different from the others because it highlights value-added versus non-value-added activities, and include costs associated with value-and non-value added activities.
21
New cards
6. elimination of non-value-added activities
in a process design is one of the most important responsibilities of operations managers.
ex:
* overproducing
• waiting for service or work to do
• not doing work correctly the first time
• inventory sitting idle in the warehouse
ex:
* overproducing
• waiting for service or work to do
• not doing work correctly the first time
• inventory sitting idle in the warehouse
22
New cards
7. [Little's Law Computation]
23
New cards
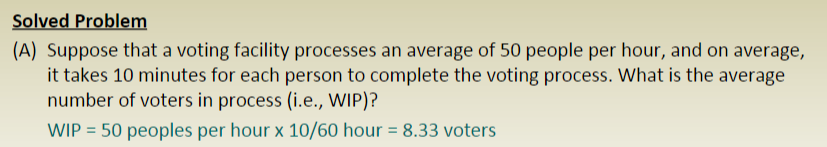
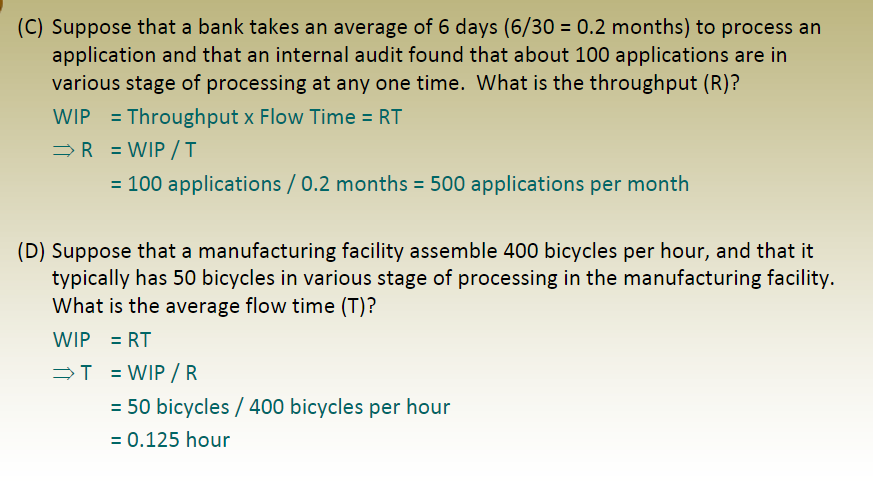
7. Little's Law
simple formula that explains the relationship among flow time (T), throughput (R) and work-in-process (WIP).
Work-In-Process (WIP) = Throughput (R units/time) × Flow time (T time); WIP = R * T
Flow Time is the average time to complete one cycle of a process (time/unit).
Cycle Time is the interval between two successive outputs (time/unit).
Work-In-Process (WIP) = Throughput (R units/time) × Flow time (T time); WIP = R * T
Flow Time is the average time to complete one cycle of a process (time/unit).
Cycle Time is the interval between two successive outputs (time/unit).
24
New cards
7. calculation of WIP
throughput (R units/time) * Flow time (T time)
25
New cards
7. more calculations of WIP
R = WIP/T ; T = WIP/R
26
New cards
8. [Types of layouts, pay close attention to product layout versus process layout]
27
New cards
8. Facility layout (four types)
refers to the specific arrangement of physical facilities. A good
layout should support the ability of operations to accomplish its mission. If the facility layout is flawed in some way, process efficiency and effectiveness suffers.
In manufacturing, facility layout is generally unique, and changes can be accomplished without much difficulty.
For service firms, however, the facility layout is often duplicated in hundreds or thousands of sites. This makes it extremely important that the layout be designed properly, as changes can be very costly.
28
New cards
8. Product layout (1)
is an arrangement based on the sequence of operations that are
performed during the manufacturing of a good or delivery of a service
(low skill labor + specialized machines; high volume, MTS)
Examples: winemaking industry, credit card processing, Subway sandwich shops, paper
manufacturers, insurance policy processing, and automobile assembly lines.
Advantages include lower work-in-process inventories, shorter processing times, less material
handling, lower labor skills, and simple planning and control systems.
Disadvantages include that a breakdown at one workstation can cause the entire process to
shut down; a change in product design or the introduction of new products may require
major changes in the layout, limiting flexibility.
29
New cards
8. process layout (2)
consists of a functional grouping of equipment or activities that do similar work.
(high skill labor + general purpose machines; low volume, flexibility, MTO)
Examples: legal offices, shoe manufacturing, jet engine turbine blades, and hospitals.
Advantages of process layouts include a lower investment in equipment, and the diversity of jobs inherent in a process layout can lead to increased worker satisfaction.
Disadvantages include high movement and transportation costs, more complicated planning and control systems, longer total processing time, higher in-process inventory or waiting time, and higher worker-skill requirements.
30
New cards
8. cellular layout (3)
the design is not according to the functional characteristics of
equipment, but rather by self-contained groups of equipment (called cells), needed for producing a particular set (family) of goods or services.
Group technology, or cellular manufacturing, classifies parts into families so that efficient
mass-production-type layouts can be designed for the families of goods or services.
• Cellular layouts are used to centralize people expertise and equipment capability.
31
New cards
8. Fixed Position Layout (4)
A fixed-position layout consolidates the resources needed to manufacture a good or deliver a service, such as people, materials, and equipment, in one physical location.
* The production of large items such as heavy machine tools, airplanes, buildings,
locomotives, and ships is usually done in a fixed-position layout.
* The production of large items such as heavy machine tools, airplanes, buildings,
locomotives, and ships is usually done in a fixed-position layout.
32
New cards
9. [Flow blocking and lack of work delays]
33
New cards
9. Flow-blocking delay
occurs when a work center completes a unit but
cannot release it because the in-process storage at the next stage is full. The worker must remain idle until storage space becomes available.
cannot release it because the in-process storage at the next stage is full. The worker must remain idle until storage space becomes available.
34
New cards
9. Lack-of-work delay
occurs whenever one stage completes work and no
units from the previous stage are awaiting processing.
units from the previous stage are awaiting processing.
35
New cards
10. [Computation - cycle time, minimum # of workstation, assembly line efficiency]
36
New cards
10. Cycle time
Cycle time, CT = A/R
A = available time to produce the output
R = output or demand forecast in units, adjusted for on-hand inventory if appropriate, or orders released to the factory
Both A and R must have the same time units of measure (hour, day, week,
month...)
A = available time to produce the output
R = output or demand forecast in units, adjusted for on-hand inventory if appropriate, or orders released to the factory
Both A and R must have the same time units of measure (hour, day, week,
month...)
37
New cards
10. Min # of workstations required
Min # of workstations required = Sum of task times/Cycle time = sum of t/CT
38
New cards
10. Assembly Line Efficiency
sum of t / (N * CT)
N = number of workstations; CT = cycle time
N = number of workstations; CT = cycle time
39
New cards
11. [Throughput, cycle time, flowtime, assembly line balancing]
40
New cards
11. Throughput formula
amount of parts or objects/time
41
New cards
11. cycle time formula
time required / per part
42
New cards
11. flow time
is the average time to complete one cycle of a process (time/unit)
43
New cards
11. assembly line balancing
Assembly line balancing is a technique to group tasks among workstations so that each workstation has (ideally) the same amount of work.
44
New cards
12. [Longest task time first and shortest task time first assignment rules]
45
New cards
12. Longest task time first
chosen because shortest task time is easier to fit in a line
46
New cards
12. shortest task time first
chosen because it minimizes idle time
47
New cards
13. [Time series data – trend, seasonal, cyclical and random error]
48
New cards
13. time series
is a set of observations measured at successive points
in time or over successive periods of time
A time series pattern may have one or more of the following five characteristics:
1. Trend
2. Seasonal patterns
3. Cyclical patterns
4. Random variation (or noise) & Irregular (one time) variation
in time or over successive periods of time
A time series pattern may have one or more of the following five characteristics:
1. Trend
2. Seasonal patterns
3. Cyclical patterns
4. Random variation (or noise) & Irregular (one time) variation
49
New cards
13. trend
moves in a predictable manner
50
New cards
13. seasonal patterns
are characterized by repeatable periods of ups and downs over
short periods of time, usually within a year.
short periods of time, usually within a year.
51
New cards
13. cyclical patterns
are regular patterns in a data series that take place over long periods of time, usually more than a year.
52
New cards
13. random variation
(sometimes called noise) is the unexplained
deviation of a time series from a predictable pattern, such as a trend, seasonal, or cyclical pattern. Because of these random variations, forecasts are never 100% accurate.
deviation of a time series from a predictable pattern, such as a trend, seasonal, or cyclical pattern. Because of these random variations, forecasts are never 100% accurate.
53
New cards
13. irregular variation
is a one-time variation that is explainable. For example, a hurricane can cause a surge in demand for building materials, food, and water.
54
New cards
14. [computation - forecast techniques such as simply moving average, exponential smoothing]
55
New cards
14. simply moving average
forecast is an average of the most recent “k” observations in a time series. MA methods work best for short planning horizons
when there is no major trend, seasonal, or business cycle pattern.
SMA = sum of (A_t....A_(t-k+1))/k
A = observed value
F = forecast
when there is no major trend, seasonal, or business cycle pattern.
SMA = sum of (A_t....A_(t-k+1))/k
A = observed value
F = forecast
56
New cards
14. exponential smoothing
is a forecasting technique that uses a weighted average of past time-series values to forecast the value of the time series in the next period. The forecast “smoothes out” the irregularfluctuations
in the time series.
Ft = At-1 + (1-)Ft-1
in the time series.
Ft = At-1 + (1-)Ft-1
57
New cards
15. [BIAS, MAD, MAPE and MSE (description and computation) at least 5 questions]
58
New cards
15. forecast error
is the difference between the observed value (A) of the time
series and the forecast (F), i.e., Et = At – Ft.
series and the forecast (F), i.e., Et = At – Ft.
59
New cards
15. BIAS
the sum of (At - Ft) / n
60
New cards
15. Mean Absolute Deviation Error (MAD)
MAD = | (At - Ft) | / n
61
New cards
15. Mean Absolute Percentage Error (MAPE)
MAPE = sum of [|(At - Ft)| / At] / n
62
New cards
15. Mean Square Error (MSE)
MSE = sum of (At - Ft)^2 / n
63
New cards
16. [PMI & NMI indices – description and computation]
64
New cards
16. PMI
is a composite index based on the diffusion indexes for the following five indicators at equal weights:
• New Orders (seasonally adjusted) 20%
• Production (seasonally adjusted) 20%
• Employment (seasonally adjusted) 20%
• Supplier Deliveries (seasonally adjusted)20%
• Inventories 20%
• New Orders (seasonally adjusted) 20%
• Production (seasonally adjusted) 20%
• Employment (seasonally adjusted) 20%
• Supplier Deliveries (seasonally adjusted)20%
• Inventories 20%
65
New cards
16. NMI
beginning in June 1998, ISM began calculating for the non-manufacturing sector. ___ is a composite index based on the diffusion indexes for the following four indicators at equal weights:
• Business Activity (seasonally adjusted) 25%
• New Orders (seasonally adjusted) 25%
• Employment (seasonally adjusted) 25%
• Supplier Deliveries 25%
• Business Activity (seasonally adjusted) 25%
• New Orders (seasonally adjusted) 25%
• Employment (seasonally adjusted) 25%
• Supplier Deliveries 25%
66
New cards
17. [ABC inventory analysis]
67
New cards
17. ABC INVENTORY (80/20 rule or Pareto)
• ABC inventory (80/20 rule or Pareto) analysis gives managers useful information to identify the best methods to control each category of inventory. A vital few SKUs represent a high percentage of the total dollar inventory value.
• ABC analyses of on-hand inventory and usage (sales) can be used to check if the firm is stocking the correct items.
• ABC analysis is simple but is a vital inventory management tool.
• “A” items account for a large dollar value but relatively small percentage of total items.
• “B” items are between A and C.
• “C” items account for a small dollar value but a large percentage of total items.
68
New cards
18. [types of inventories]
69
New cards
18. raw materials
component parts, subassemblies, and supplies are inputs to manufacturing and service-delivery processes.
70
New cards
18. work-in-process (WIP)
inventory consists of partially finished products in various stages of completion that are awaiting further processing.
71
New cards
18. finished goods
inventory is completed products ready for distribution or sale.
72
New cards
18. Maintenance, Repair, and Operating (MRO)
supplies are items used in operations but do not become parts of the finished goods, such as lubricants and cleaning supplies.
73
New cards
18. Cycle inventory (order or lot size inventory)
is inventory that results from purchasing or producing in larger lots than are needed for immediate consumption/sale.
74
New cards
18. Safety stock
inventory is an additional amount of inventory that is kept over and above the average amount required to meet demand.
75
New cards
19. [Economic Order Quantity (EOQ) model – purpose, assumptions and computation]
76
New cards
19. Economic Order Quantity (EOQ)
The Economic Order Quantity (EOQ) model is a classic economic model that minimizes total cost, which is the sum of the inventory-holding (carrying) cost and the ordering (setup) cost.
77
New cards
20. [EOQ computation – EOQ, annual ordering cost, annual holding cost, total annual cost]
78
New cards
20. EOQ annual ordering cost
# of orders per year x cost per order
79
New cards
20. EOQ annual holding cost
average inventory x annual holding cost per unit
80
New cards
20. EOQ total annual cost
annual inventory holding cost + order cost
81
New cards
20. When does AHC and AOC equal
AHC (annual holding cost) and AOC (annual ordering cost) equal when you ORDER AT THE EOQ QUANTITY
82
New cards
21. [Inventory turnovers]
83
New cards
21. Inventory Turnovers or Inventory Turnover Ratio
• how many times inventory “turns” in an accounting period
• faster is better, suggesting the firm generates more revenue per $ in inventory investment
formula = cost of revenue / average inventory
• faster is better, suggesting the firm generates more revenue per $ in inventory investment
formula = cost of revenue / average inventory
84
New cards
22. [Basic relationship of Quantity Discounts model with classic EOQ model.]
85
New cards
22. Classic eoq model assumption
1. Only a single item (SKU) is considered
2. Demand must be known & constant
3. Delivery time is known & constant
4. Replenishment is instantaneous
5. Price is constant (i.e., no quantity discounts)
6. Holding cost is known & constant
7. Ordering cost is known & constant
8. Stockouts are not allowed
2. Demand must be known & constant
3. Delivery time is known & constant
4. Replenishment is instantaneous
5. Price is constant (i.e., no quantity discounts)
6. Holding cost is known & constant
7. Ordering cost is known & constant
8. Stockouts are not allowed
86
New cards
22. EMQ model
it is the same as EOQ model assumption except we relax the instantaneous replenishment assumption by allowing usage during production or partial delivery
(NOT RESPONSIBLE FOR EMQ MODEL CALCULATIONS)
(NOT RESPONSIBLE FOR EMQ MODEL CALCULATIONS)
87
New cards
22. Quantity discount model relationship with EOQ model
If we relax the constant price assumption which allows quantity discount. this transitions from EOQ to quantity discount model.
88
New cards
23. [Continuous review versus periodic review inventory systems.]
89
New cards
23. continuous review system
is costly to conduct but requires less safety stock
(we review our inventory level continuously; more expensive to administer)
(we review our inventory level continuously; more expensive to administer)
90
New cards
23. Periodic Review System
reviews physical inventory at specific points in time, hence, requires higher level of safety stock
(we review inventory once every week; less expensive to administer)
(we review inventory once every week; less expensive to administer)
91
New cards
24. [What is cross-docking?]
92
New cards
24. cross docking
• Incoming shipments are sort and transfer to outgoing trucks without storing
• Feasible only if the final destination of the goods is known
• Cross-docking equipment
Automatic identification devices - bar coding & RFID, Software packages, Materials-handling equipment, Warehouse space
• Feasible only if the final destination of the goods is known
• Cross-docking equipment
Automatic identification devices - bar coding & RFID, Software packages, Materials-handling equipment, Warehouse space