Basics (Returns, Assets, Data)
1/89
There's no tags or description
Looks like no tags are added yet.
Name | Mastery | Learn | Test | Matching | Spaced | Call with Kai |
|---|
No analytics yet
Send a link to your students to track their progress
90 Terms
Investors don’t like risk but want higher returns what does this lead to them looking for?
They look for best trade off ( risk vs return)
What is diversification?
Reducing risk by combining assets
In portfolio formulas what does total weights add to up?
1
As number of assets increases what risk remains?
only systematic (market) risk remains
What are the types of financial securities?
Direct and indirect investment
What is a direct investment?
When the financial assets are bought directly
What is an indirect investment?
when financial assets are held indirectly through a managed fund.
Examples of direct investments
Money market instruments,Capital market instruments and derivative instruments
What is a money market instrument?
Short-term debt securities with maturities less than one year.
What is a capital market instrument
Common stock (equity), and debt securities with a maturity longer than one year.
What is a derivative instrument?
Securities whose payoff depends upon the price of another asset. For example, an option is the right but not the obligation to buy or sell an asset at an agreed price at some future date.
Examples of alternative assets
Infrastructure.
Commodities
Currencies
Collectibles
Examples of money market securities
Treasury bills Certificates of deposit, commercial paper, and floating rate notes.
What is a treasury bill?
Short-term zero-coupon bonds issued by the government which pays the face value of the bond at maturity
The bonds are issued at a discount to the face value and so he investor knows the return of the T. Bill when buying the bill. In nominal terms, T bills are risk-free
In the UK how often are bills issued at?
1-month, 3-months, and 6-months maturities
In the UK what is the minimum denomination to sell?
£500,000 (U.K. Debt Management Office).
Examples of capital market securities
Stocks and bonds
What is a stock?
Ordinary share issued by the company
What are bonds?
Debt securities issued by companies or governments
What do you pay at the end of the life of the bond?
Regular coupon payments and the face value of the bond at the end of the life of the bond
Formula for return
Payout/Price
What is an arithmetic mean?
A simple average
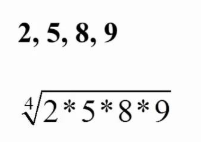
What is a geometric mean
A special type of average used to find the central tendency of positive numbers
Multiply all n numbers and take n-th root of product
Which of arithmetic and geometric returns better reflect long-term investment performance?
Geometric
What is risk measured by?
Variance or standard deviation
Examples of indirect investments
Retail funds, pension funds,Insurance companies and hedge funds, Private equity funds and sovereign wealth funds
Why are Benchmarks of major asset classes and investment styles important
-Provides information on how well a given asset class or style has performed over some historical period
-Benchmarks are used to evaluate the performance of fund managers. The benchmark is used as a passive alternative trading strategy that the fund manager could have followed.
-Benchmarks are used in the developing of index funds and Exchange Traded Funds
-Benchmarks are used in asset allocation decisions.
Which organisations provide indexes?(Provide both local indexes, regional, and global indexes)
MSCI, FTSE, S&P, Morningstar, LSEG Datastream
What is the advantage of local indexes?
The same methodology is used across markets
In emerging markets what do S&P/IFC provide?
Investable indexes that represent the market which is actually available to international investors.
How do global indexes differ from local indexes?
Coverage of each market and the weights that are used.
In some global markets which weights are used?
Free float market cap weight
What is a free float market weight cap?
Proportion of the market value weights that are available to international investors
Why do international investors not always have access to the full market value?
Cross holdings, government ownership, restrictions on foreign holdings.
What do data providers do?
Provide bond indexes for local and global bond markets
How often is the data updated when Dimson, Marsh and Staunton(2002) (DMS) construct annual returns for 16 countries since 1990?
Once a year
What do Dimson, Marsh and Staunton(2002) (DMS) construct annual returns on?
equity, government bonds, Treasury Bills, inflation, and currencies for 16 countries since 1900.
What is the formula for return on asset?
What is the formula for return on a stock?
return can be given by (pt+1 + dt+1)/pt, where dt+1 is the dividend (if any) at time t+1, pt and pt+1 are the stock price at time t and t+1
What form can return come in the form?
capital gain or loss and via dividend income.
What is the T.Bill
Closest thing to a risk-free asset in nominal terms
Over a monthly return horizon, it is risk-free in nominal terms
Formula for future value when $1 investment in a risky asset at the start of the sample period to the end of the sample period, with reinvesting dividends
1*(1+R1)*(1+R2)*(1+R3)*……*(1+RT) where R1 to RT are the corresponding monthly returns.
Compounded Monthly return of asset formula
Compounded return = (FV/Value at time 0)1/T – 1
What is the compounded return
geometric mean return of the asset and is commonly reported in financial publications.
What does a longer sample period mean?
The greater is the gap between the market index and Treasury Bills (and government bonds)
What does DMS show across the markets they cover?
equity has outperformed both government bonds and Treasury Bills over long horizons.
What do equity returns depend on?
Depend upon both dividends and capital gains (losses)
What do DMS(2002) point out that over annual (and shorter) intervals are the main driver of returns?
capital gains (losses)
What do DMS(2002) point out that over long horizons are the main driver of returns?
Dividends
What is the UK equity example
A £1 investment in U.K. equity, with dividends reinvested, between 1900 and 2000
grew to £16,160 (annualized return 10.1%).
A £1 investment in U.K. equity, with dividends paid out, between 1900 and 2000 grew
to £149 (annualized return 5.1%).
What does the $1 investment in equity with dividends reinvested or paid out which is more profitable
Dividends reinvested
Formula to get real return from nominal and inflation return
Real return = (1+nominal return)/(1+inflation return) – 1
How has inflation in most developed markets been since 1980
Relatively low since the 1980s, although spiked in a number of countries in the early 2020s.
What does DMS(2012) point out about inflation?
-For many countries, annual inflation has been large(e.g Germany 1923 annual inflation 209 billion%,Italy 1944 annual inflation 344%
-There can be periods of deflation, when prices fall. This occurred during much of the 1920s in the U.K. and U.S.
How do bonds perform in periods of deflation and periods of high inflation in comparison to equity?
In times of deflation and outperform equity but perform poorly
In times of high inflation and underperform equity
Which equities provide the best hedge against inflation?
Gold
Does gold perform well in times of crisis?In general and recent terms
Gold performs well in times of crisis and some commentators have advocated gold during the recent covid-19 pandemic.
What does DMS(2012) point out about gold performance between 1900-2011 compared to other asset classes
Gold has performed poorly in real terms compared to other asset classes in terms of average real returns and volatility.
How do we calculate excess returns on market index?
Subtracting the Treasury Bill return from the market index returns.
What is the average market excess return known as?
historical equity premium
What does the historical equity premium do?
Plays a critical role in many financial applications such as the cost of equity capital estimation, discount rates in investment appraisal
How do we examine whether the average excess market returns are significantly positive or do stocks significantly outperform risk-free bonds?
Conducting a statistical test of the hypothesis that the average excess market return is equal to zero.
What does the sampling distribution tell us?
How precise the estimate is measured
How is uncertainty of an investment captured?
By standard deviation of the sampling distribution or it’s standard error
What are the statistical assumptions?
-the excess market returns are independently and identically distributed (iid)
-the standard error of the average excess market returns is SE(rm) = σ(rmt+1)/√T
What does the standard error tell us?
How volatile the estimate is and captures sampling variation
rm= 0 What is this known as and what is other option
null hypothesis (H0) alternative hypothesis is usually that rm ≠ 0
What is a two-tailed test for alternative hypothesis
Allows positive or negative values
What is a one-tailed test for alternative hypothesis
rm > 0 or rm < 0
Why do we use a statistical test( for example t statistic) to examine the null hypothesis?
To judge whether the average excess market returns are different from zero due to sampling variation (accept null) or due to a real difference (reject null).
Formula of t statistic
(Estimate - Value of estimate under the null)/Std error of estimate
What does a larger T statistic in comparison to critical values from t-distribution lead to?
Rejection of the null hypothesis
If |t| is > 1.96 What do we do?
Reject the null hypothesis at the 5% significance level
If |t| is > 1.64 What do we do?
Reject the null hypothesis at the 10% significance level
When do we reject the null hypothesis of the p value of t statistic?
If it is below significance level (1%, 5%, 10%).
If we assume a 5% significance level If the p value < 0.05, and the t-statistic is positive what do we do?
We reject the null hypothesis and the coefficient is significantly positive.
If we assume a 5% significance level If the p value < 0.05, and the t-statistic is negative what do we do?
We reject the null hypothesis and the coefficient is significantly negative
What does a significantly positive average excess return mean?
The market return has a significantly higher average returns than risk-free bonds.
What does a significantly negative average excess return mean?
The market returns have a significantly lower average returns than risk-free bonds.
What is the 95% confidence interval
Place where we can be 95% certain that the average excess market return lies in that interval.
Size of estimation error
What does DMS(2002) show about long-run equity premium
Long-run equity premium is significantly positive in nearly every developed equity market between 1900 and 2000
What is regression analysis?
Statistical relationship between different variables to decide whether one group of variables help explain another
What is linear regression
Relation between a variable that you want to explain (dependent variable) on a group of variables (independent variables) that you
think will help explain the dependent variable
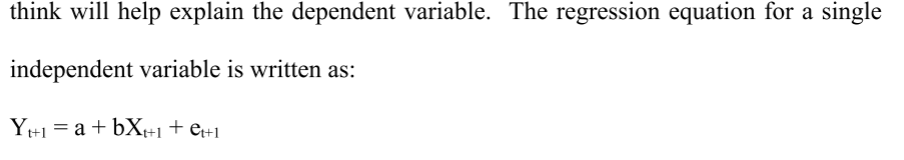
What is the regression equation for a single independent variable and what does is the value of the time?
Yt+1 = a + bXt+1 + et+1
where Yt+1 is the value at time t+1 of the dependent variable, Xt+1 is the value at time t+1
Yt+1 = a + bXt+1 + et+1 What does a and b stand for?
-The b term is the regression slope coefficient and tells us how much the Y variable will change for a 1 unit change in the X variable.
- The a term is the constant and is given by the average value of Yt+1 minus b*average value of Xt+1. The constant captures the part of Y that is not explained by the X variable.
What does the R² from the regression analysis and what does it lie between?
-Lies between 0 and 1 and is the proportion of the total variation in Y that is explained by X.
-It is equal to the squared correlation between the observed values of Y and the predictions produced by the regression equation.
Issues with regressions
-Correlation in variables does not mean causation
-Data mining as researchers can often seek for X variables that have a significant relation with the Y variables without any clear reason
What is the regression equation estimated by?
Ordinary Least Squares (OLS). OLS estimates a and b to minimise the sum of the squared residual terms (et+1). Under OLS, the E(et+1) = 0 and is independent of the X variables E(et+1Xt+1) = 0. OLS also derives the sampling distribution of a and b which allows us to examine different hypotheses
Key assumption about Ordinal Least Squares (OLS)
Residuals et+1 are normally distributed with a constant variance (homoscedastic), and no serial correlation (autocorrelation is 0).
What is an autocorrection?
The correlation over time between the residuals i.e. are the residuals in one month correlated with the residuals in the previous month