Week 8 - Bayes Classifier, Logistic Regression, ROC and Confusion Tables
 Call Kai
 Learn
Learn Practice Test
 Spaced Repetition
 Match
Match Flashcards
 Knowt Play
1/8

There's no tags or description
Looks like no tags are added yet.
Name | Mastery | Learn | Test | Matching | Spaced | Call with Kai |
|---|
No analytics yet
Send a link to your students to track their progress
9 Terms
Bayes Classifier
Try to find a function that approximately represents
𝑓l(𝑥) ≈ ℙ( 𝑦 = 𝑙 | 𝑥).
Now 𝑓l(𝑥) ∈ [0,1] provides an estimate on the probability that the data sample 𝑥 is labelled 𝑦 = 𝑙
Logistic Regression
A popular choice for the probability function is the logistic function (sigmoid)
f(x) = 1/(1 + e^-x)
Likelihood Function
Aim to maximise the probability of observing the training data assuming our ML model is correct
Optimal parameters are such that l(a0, a1) ≈ 1 and suboptimal parameters are such that l(a0, a1) ≈ 0

Advantages of K-Nearest Neighbours
Does not assume that our model, 𝑓(𝑥), takes a certain parametric structure.
Since there are no parameters, no need to optimize.
Can represent complex boundary conditions.
Disadvantages of K-Nearest Neighbours
Arbitrarily chooses a metric for closeness (the Euclidean norm ||. ||.). Depending on the units and scale of the data this may not be the best metric.
Arbitrarily chooses 𝑘 ∈ ℕ, the size of the neighborhood.
Only considers what is occurring locally around data point where global properties may be important.
A lot of online computation is required to make each prediction (we are required to compute 𝑁k(𝑥0)).
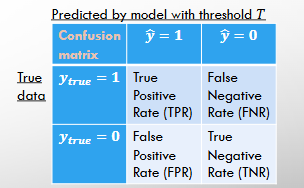
Confusion Matrix
TPR = number of correctly predicted positive labels / number of truly positive data
FNR = number of incorrectly predicted negative labels / number of truly positive data
FPR = number of incorrectly predicted positive labels / number of truly negative data
TNR = number of correctly predicted negative labels / number of truly negative data
Sensitivity and Specificity
Unlike regression models, classification problems are interested in measuring class-specific performance
Sensitivity = TPR = percentage of positive cases correctly identified
Specificity = TNR = percentage of negative cases correctly identified
ROC Curves
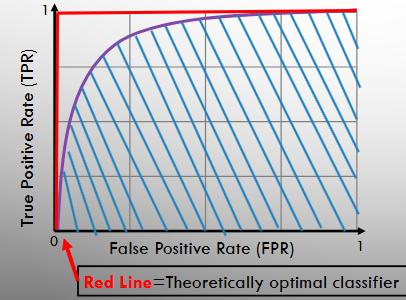
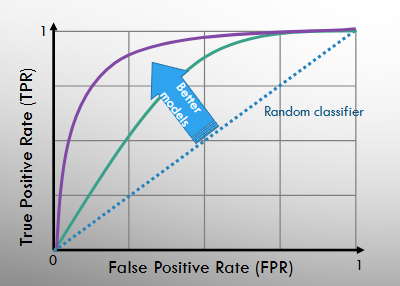
The performance of a classification model is done by plotting a Receiver Operating Characteristic (ROC) curve
Given a classification model for different threshold values, we plot the TPR vs FPR to get the ROC curve
We would like to find a classifier that has TPR = 1 and FPR = 0
AUC (Area Under the ROC Curve)
Provides a metric for the performance of a classifier over all thresholds
Theoretically the best classifier has an AUC of one