Fishing
1/20
Earn XP
Description and Tags
Name | Mastery | Learn | Test | Matching | Spaced | Call with Kai |
|---|
No analytics yet
Send a link to your students to track their progress
21 Terms
categories of commercial fishing
artisanal-subsistence fishing
recreational fishing
commercial-macro scale fishing
BUT economy drives commercial fishing, so economy might dictate it anyway (fuel prices)
fishing conflicts
many national/international conflicts over fishing
what belongs to who, socal especially (populations oscillate in phases b/s temp can change so much), CA current makes norcal + above perpetually cold
provinces along wc (south to north)
panamic, callifornia, oregonian, aleutian
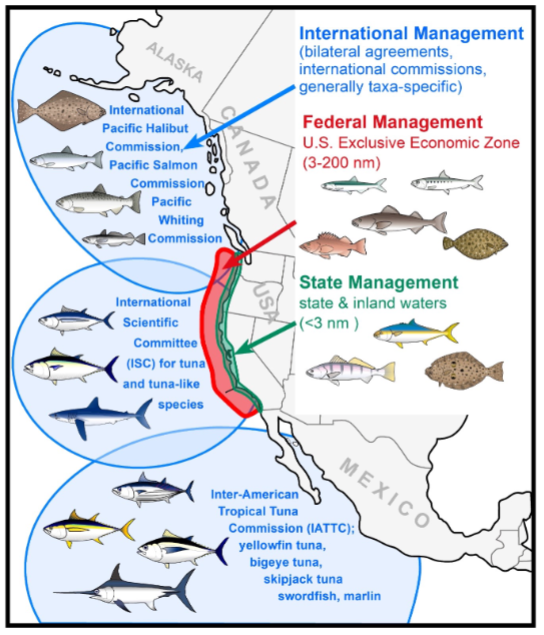
management
state: <3 nautical miles offshore
federal: 3-200 nm
international: rest
history of fishing in CA
fishing increased after marine mammals fished out, sardine fishery was one of the biggest in the world before it collapsed, now it’s mostly hake
rockfish
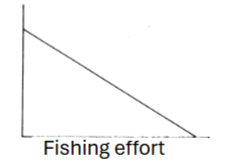
inverse relationship between stock size and catch
historically lots of rockfish
crashed in 1980s-90s (started to protect rockfish and once stocks went up, the fisheries are starting to regain
how to manage fisheries so you can catch them and also have a large stock?
target biomass —> use the 40% rule
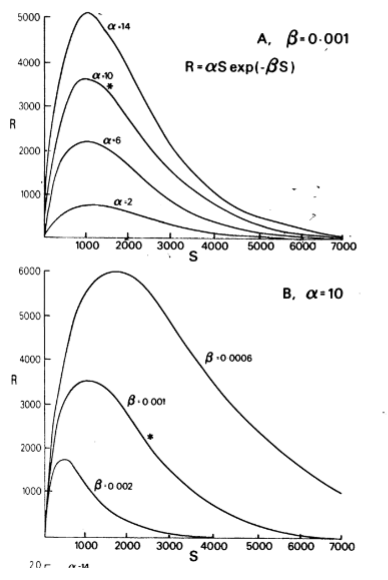
ricker recruitment curve
strong density dependence, increasing geometrically over a certain range of stock densities. potential dd mechanism = cannibalism of young by adults
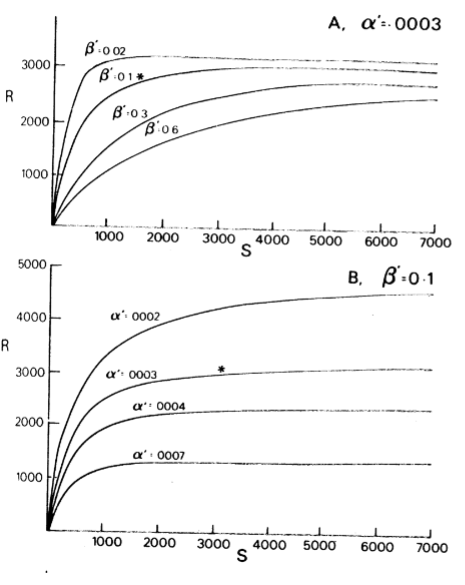
beverton-holt recruitment curve
Implies an arithmetically progressive reduction in the recruitment rate as
stock density increases. A ceiling of recruit abundance is imposed
by available food or habitat (resources limitation)
recruitment
ecological definition: settlement + recruitment can have a gap, but mostly in CA terms exactly same
fisheries literature: recruitment means accessible to fishery (sized based), try to have a few years where fish can reproduce before fishery
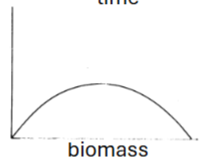
logistic curve
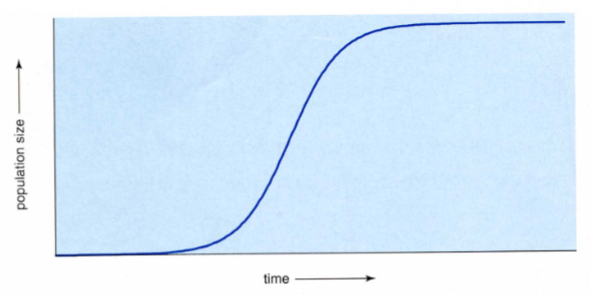
maximum sustainable yield
right half is not helping the fishery
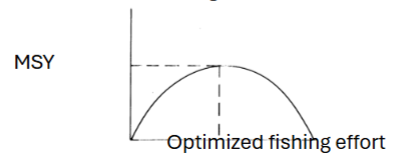
surplus yield
CPUE
catch per unit effort
the easiest way to measure effort is # of people fishing
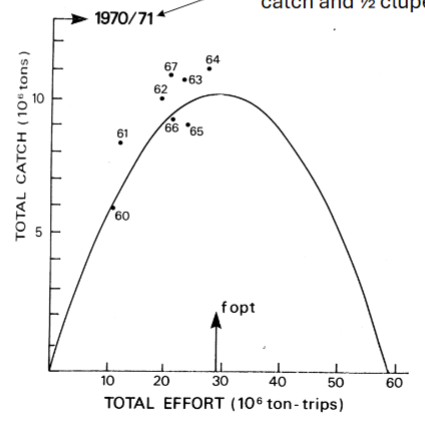
msy-schaefer model fitted for peruvian anchovy
no data on the right side b/c it would be too dangerous to fish
but then how do we predict the curve? need to be able to predict the future
msy model issues
regime shifts (oceanographic variation)
annual + recruitment + spatial variability
need to overshoot MSY to predict it
need to switch target if fish populations low
data is expensive to collect
single species management doesn’t work
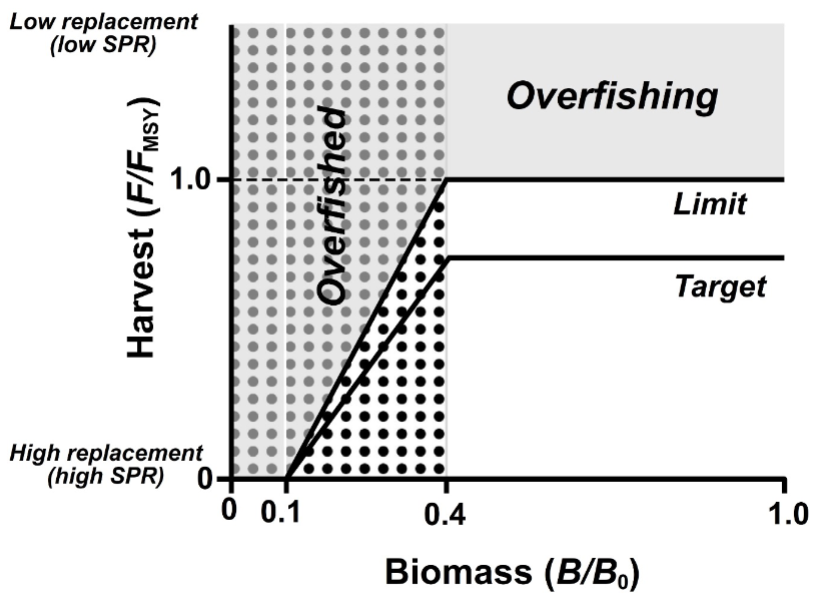
40% rule
fisheries management set a target (40%) and a limit
if stock falls below 40% —> adjust fishing
if stock falls below 10% —> close fishery
get the first dots, if we get all the dots then yay but any more is overfishing
MLMA
establishment of MPAs in CA
MLPA
have to manage fisheries in ecosystem
prop 132
gill net ban (but CA is still the only state that allows gill nets in federal waters)
soupfin sharks
started being caught in WWII for fish oil, fished out by the end of the war, after gill net closure they came back (!!)
same w/ leopard sharks and giant black sea bass