Single-samples t-tests
1/11
There's no tags or description
Looks like no tags are added yet.
Name | Mastery | Learn | Test | Matching | Spaced | Call with Kai |
|---|
No analytics yet
Send a link to your students to track their progress
12 Terms
When are single samples t-tests used? (1)
When comparing a sample mean/given value to a population mean/constant, when you don’t know the population standard deviation
Kurtosis (3)
Platykurtic: flatter peaks, shorter, thinner tails and fewer extreme outliers (t-distribution)
Mesokurtic: normal
Leptokurtic: taller peaks, fatter tails, and more extreme outliers
Relationship between sample size and t-distribution?
As sample size increases → t-distribution approaches normal distribution (mesokurtic) from more platykurtic distribution
Required info (4)
Known population mean/constant
N = sample size
X̅ = sample mean
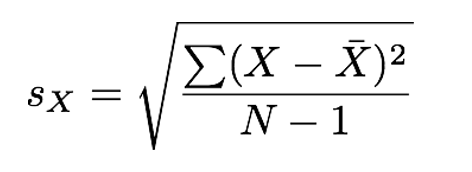
∑(X−X̅)² = sum of squares (if not provided with estimated population standard deviation)
Step 1 (1)
Estimate population standard deviation (by just calculating the sample standard deviation)
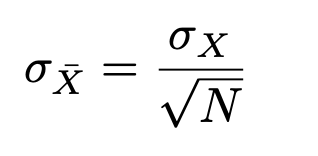
Step 2 (1)
Estimate standard error (estimated population standard deviation / square root of sample size)
Step 3 (1)
Calculate t-obtained ( (sample mean - population mean) / standard error )
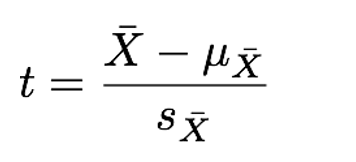
What does the t-obtained indicate? (1)
How many standard error units the sample mean is away from the population mean
Step 4 (1, 1→2, 1)
Compare t-obtained to t-crit
Find t-crit, using:
df = N-1
Significance (usually alpha = .05)
Is t-obtained greater than t-crit.? If so, then p < .05 → likely statistically significant
Assumptions (2)
Normality
Independence of observations
Capital S vs lowercase s?
Capital when actual population level value, lowercase when estimated population level value
What is Bessel’s correction?
N-1 in sx (estimated population standard deviation) formula: corrects for samples underestimate standard deviation of populations