Research Methods 2
1/8
There's no tags or description
Looks like no tags are added yet.
Name | Mastery | Learn | Test | Matching | Spaced | Call with Kai |
|---|
No analytics yet
Send a link to your students to track their progress
9 Terms
What is a histogram?
reports how many times a group of values appears in a dataset
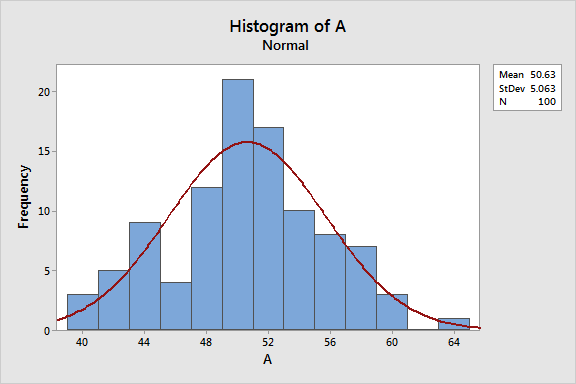
What is a frequency distribution? What does a normal distribution look like+ alternative name?
A smooth curve drawn by connecting the peaks of each bar in a histogram
Gaussian distribution: bell-shaped curve with a peak at the mean
Three measures of central tendency?
mean, median, mode
Why can’t we rely on descriptive statistics alone?
even two identically treated groups will have variability in their descriptive statistics by random chance
What are inferential statistics?
statistics that allow us apply data from sample results to larger populations
What is a t-test and what does it produce?
a test that determines the probability that both samples come from the same population
produces a p-value: value between 0 and 1 indicating the likelihood that difference in data occurs by random chance
What p-value makes results statistically signfiicant?
If p < .05 → results are statistically significant
what does a p-value of 0.44 mean?
assuming the treatment has no effect, there is a 44% chance of seeing a difference like this due to random sampling
what is the correlation coefficient?
r