HSCI 310 Quiz 2
1/99
Earn XP
Description and Tags
Measuring and Valuing Costs: Numerator and denominator
Name | Mastery | Learn | Test | Matching | Spaced | Call with Kai |
|---|
No analytics yet
Send a link to your students to track their progress
100 Terms
Cost-effectiveness Thresholds
(k) should represent what is expected to be given up (to afford the more costly alternative)
need this to compare to QALY to know if intervention is affordable
no explicit threshold but over-time we can see a pattern/range (general guide)
Nominal
no order and no numeral values (ex. categories such as gender, race, or hair color)
used for labeling variables without quantitative value.
Ordinal
order but still no numeral values (ex. rating scales, rankings)
Cardinal
numerical values with measurable differences, allowing for mathematical operations (ex. height, weight or QALY). + ORDER
Consequences of k too high or low
include inefficient resource allocation and potential neglect of cost-effective interventions.
HIGH: more treatments (more likely available ~ approved) BUT consequence is we would pay more for the same treatments cause no cap
little reason to maintain a threshold that is higher than the balance of evidence suggests, despite the obvious stakeholder interest in doing so.
LOW: less treatments (which reduce health outcome b/c people miss out on cost-effective treatments — some health care will be restricted when it need not be.
Do threshold change over time?
Yes, thresholds can evolve based on new evidence, economic conditions, and healthcare priorities and of course inflation — BUT THERE IS A GENERAL TRENDLINE
Thresholds: Cost-effectiveness and affordability
rarely both are achieved simultaneously in healthcare decision-making. Often, an intervention may be cost-effective but still unaffordable, leading to difficult choices about resource allocation. (SYSTEM IS MESSED UP)
Other aspects of value for thresholds
would be:
increase in utility (well-being) but not improving health
effects treatment has on everyone inolved (caregivers, family, individual)
productivity (societal, get back to work)
Cost-consequence Analysis (CCA)
is a form of economic analysis that compares the costs and consequences of different health interventions, presenting the outcomes in a disaggregated format.
“CEAs may present an array of output measures alongside cost and leave it to the decision-makers to form their own view of the relative importance of these… useful approach, even if the analyst then goes on to value the outcomes relative to one another”
3 fundamental assumptions in economic evaluation
people using this approach ignore three key problems:
1) Congruence of objectives: analysis assumes decision makers value what the analysis measures (too complex ex. QALY)
CCA more closely meet the needs of decision makers (simple but thats the problem academically)
2) Funnelling outcomes into one (QALY): reducing complex outcomes to a single number loses info
CCA avoids this, keeps outcomes separate
3) Meaningfulness to decision makers: complex techniques are hard for decision makers to use
Does Economist = decision maker
NO! just shows results via analysis (academic)
Multiple Alternatives
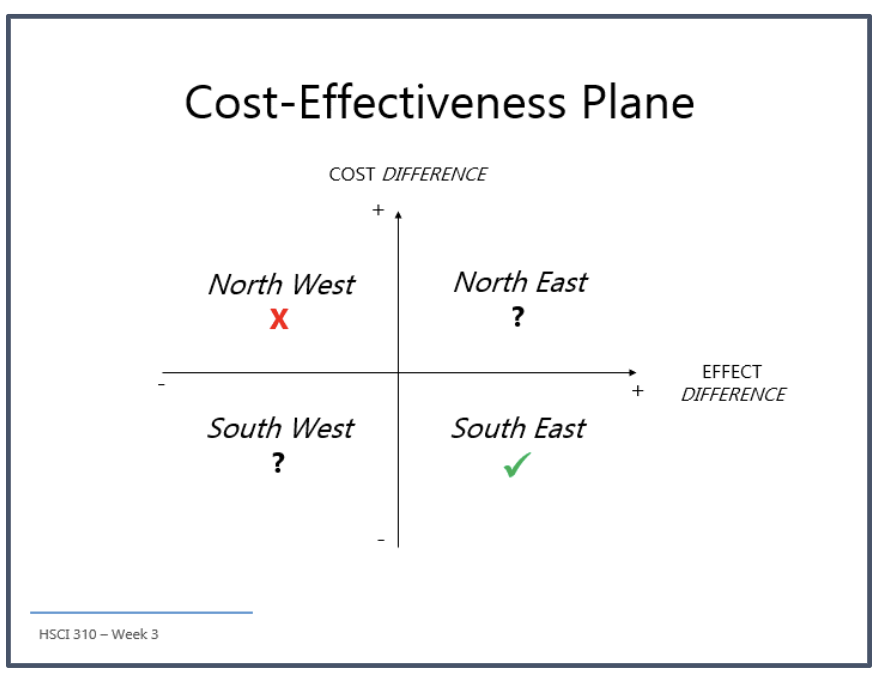
‘either/or’ decisions: incremental ratio, cost-effectiveness plane
cant have more than 2 things compare
>2 alternatives (which are more realistic): trial-based analyses and decision models, combinations, sequences or options
for combinations of drugs etc.

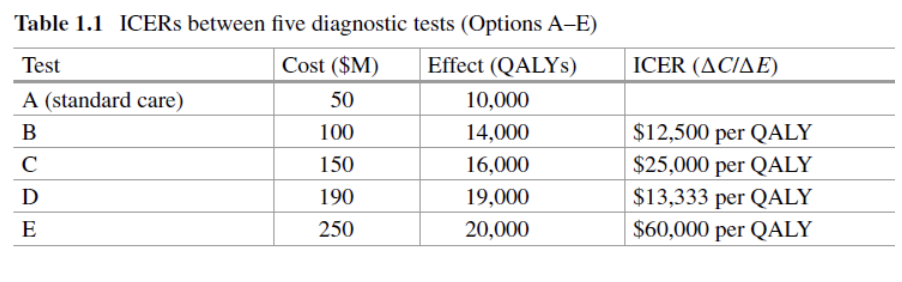
Which treatment is best? (multiple alternatives)
don’t need to test them all to each other
C b/c more QALY b/c lower cost use of incremental analysis for cost-effectiveness comparison
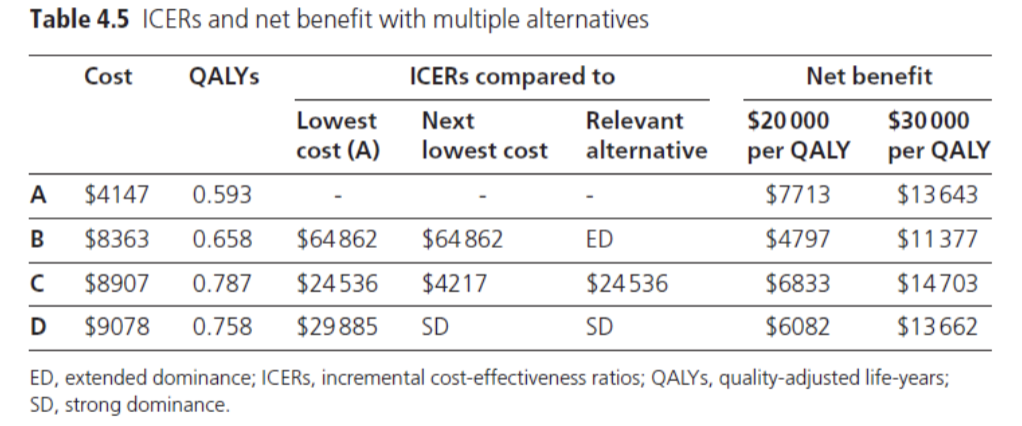
Should D be considered cost-effective? (λ = $50K/QALY)
No. D is dominated by C
(D will never be cost-effective b/c it needs to be best under threshold)
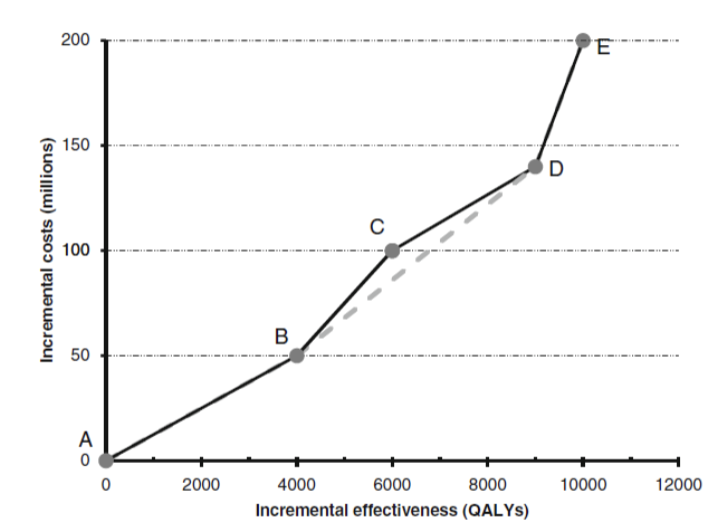
Extended Dominance
if a combination of two options is less costly and more effective than others
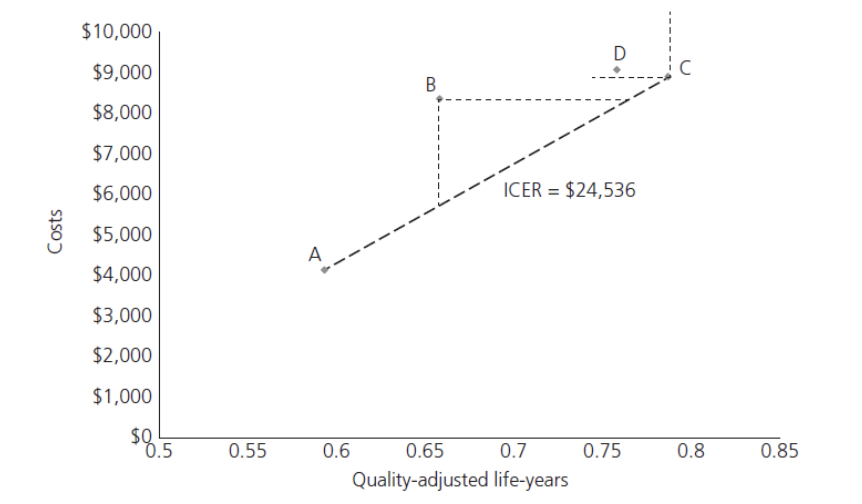
What does this show
B and D are most north west = they are dominated
Whats the best?
cancel out C b/c its the most north west from the slope
C = extendedly dominated
keep excluding one until you only get one treatment left —> B lowest cost per QALY
Guidelines and Appraisal
for evaluating health interventions and making informed decisions based on cost-effectiveness and effectiveness.
includes: critical appraisal, reporting standards (CHEERS II), Guidelines for conduct (CDA, NICE) ~ reference case, rationale?
CHEERS II report standards
its not a quality assessment (study could be terrible)
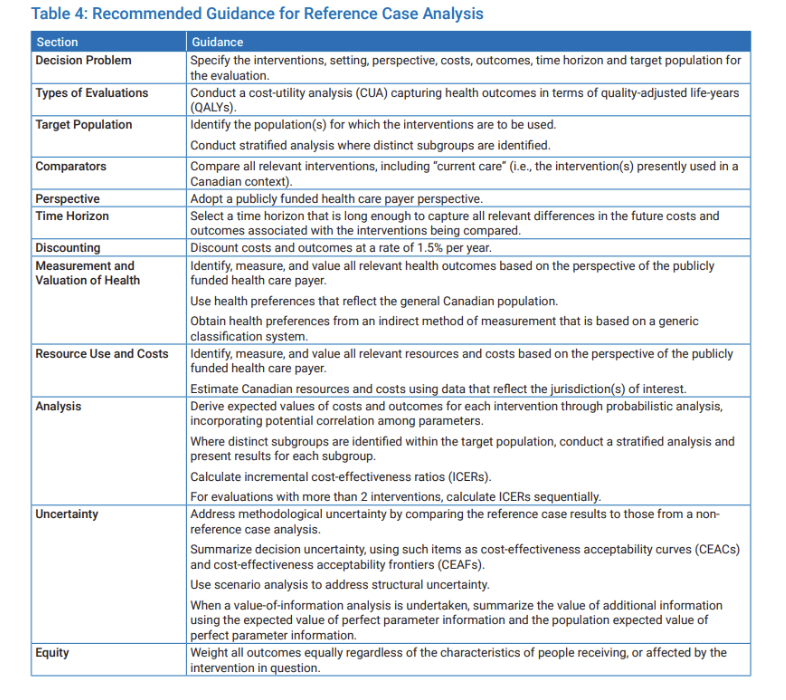
Reference case
idea is to ensure some form of standardization (for similar methods)
not saying that this is the best method but it is all for consistency
Why do we need guidelines for studies
economic evaluations have two main problems: poor data quality and reporting standards & weak evidence supporting methods
guidlelines for conducting evaluations are unlikely to help develop better methods (may even discourage it)
guidelines for reporting evaluations are more helpful because they encourage providing detailed information without stifling methodological innovation.
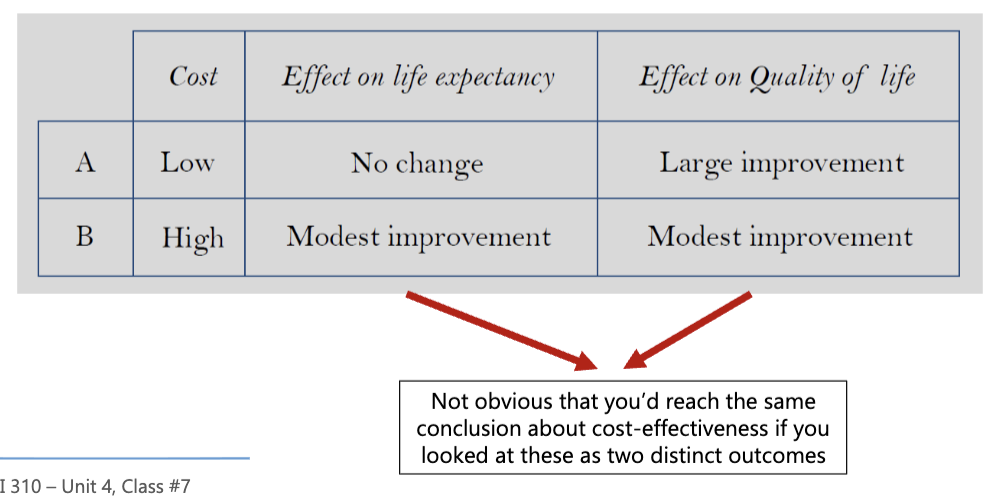
What needs to be considered when measuring/valuing costs: community based exercise program, life-saving drug treatment for infants, intervention for a condition that affects working age adults
must consider:
time period of treatments we are interested in cost (longterm vs shortterm)
people affected, staff (wage), productivity
how often drugs taken, side effects
location (rent), technology (buy), cost of drug storage
shouldn’t considered: production cost/resources, shouldn’t fund private sector or include costs not directly related to the intervention.
Economical Perspectives
such as individual, societal, and healthcare provider viewpoints, which influence the assessment of costs and benefits in health economics.
ex. traditions of welfare economics, societal perspective, international guidelines
Societal perspective
estimate all costs (and benefits) associated with the change in practice
consisders productivity and overall impact on the community, including indirect costs such as lost productivity and long-term health outcomes.
welfare interlinked
(no best perspective)
Perspective: CDA 2006 vs CDA 2017
Perspective: NICE
Perspective: HIQA
CDA: publicly funded health care system (only public healthcare costs) —> adding additional analyses (decision makers to decide to try to be more broad)
NICE: cost-effectiveness, NHS + social services costs only (dont add patient, carer, or productivity)
HIQA: cost-utility analysis, publicly-funded and societal care system in Ireland (HSE)
One value issue
to simplify factors to make 1 value is possible but very hard to do economically
Evidence-based Health Economics
If you think measuring health outcomes is hard, you might hope costing is easier. But even there, progress has been limited, and the results are still unsatisfactory
due to variability in methods and data availability, evidence-based health economics aims to provide a rigorous framework for evaluating the economic impact of health interventions using systematic reviews and robust data analysis.
Analysis of Cost Data in RCTs
Even though all 45 trials collected cost data per patient, most failed to report it properly. They didn't show how much the costs varied (80% failed), often didn't run proper statistical tests (44% failed), and over a third (64%) drew conclusions that were not supported by the results they actually presented.
This highlights the importance of rigorous methodologies in costing data collection within randomized controlled trials to ensure accurate and reliable economic evaluations.
what does this show
that economic evaluations has very complicated outcomes and costs
highlighted above are the 3 stage processes
Cost Estimation: 3-stage process
1) identification of the range of resource us —- cost-intervention
what resources are needed, staff, people, technology, etc.
2) determine the quantity of use — how often using resources
3) valuation of health services — now what’s the new cost (total)
how much will be allocated to that
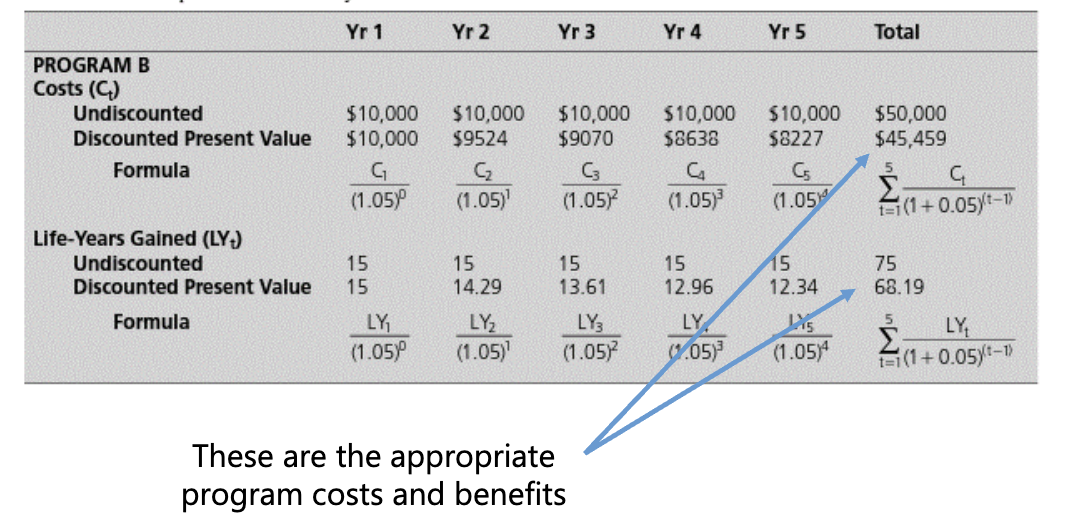
Cost Estimation Equation
Total cost for patient i = Σj (Resourceij x Unit costj)
Resourceij is the amount of resource j used by patient i
Unit costj is the unit cost for resource j
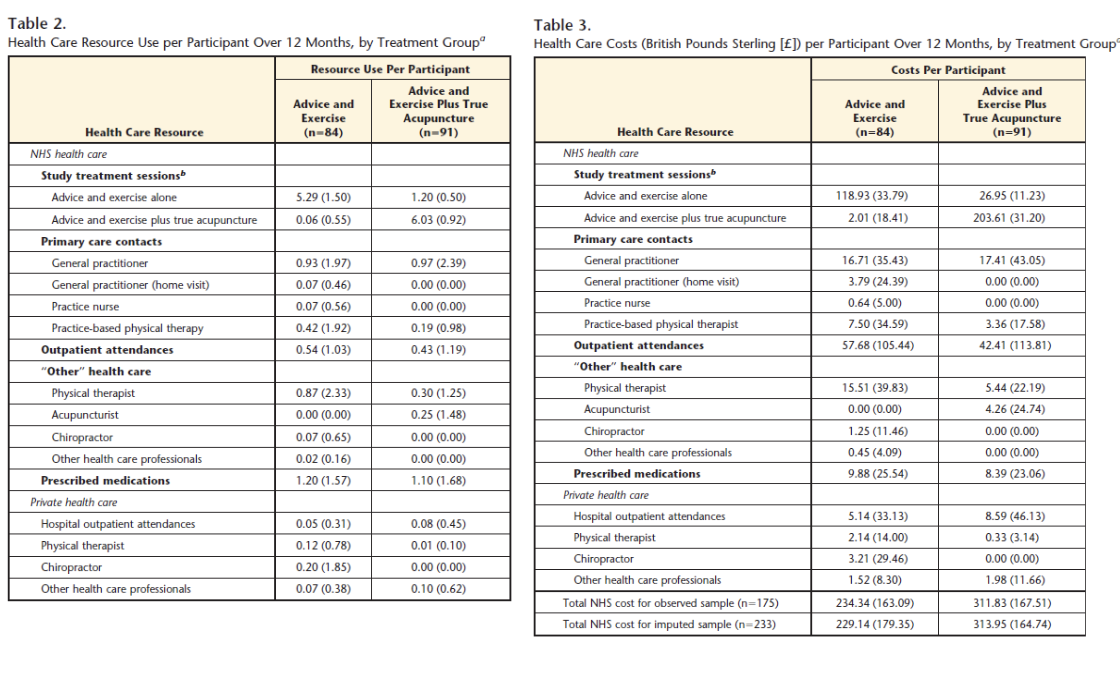
What does this acupuncture paper show
gives a sense of resources that they know were input
recognize how they split home visit GP and office GP
separate due to cost difference
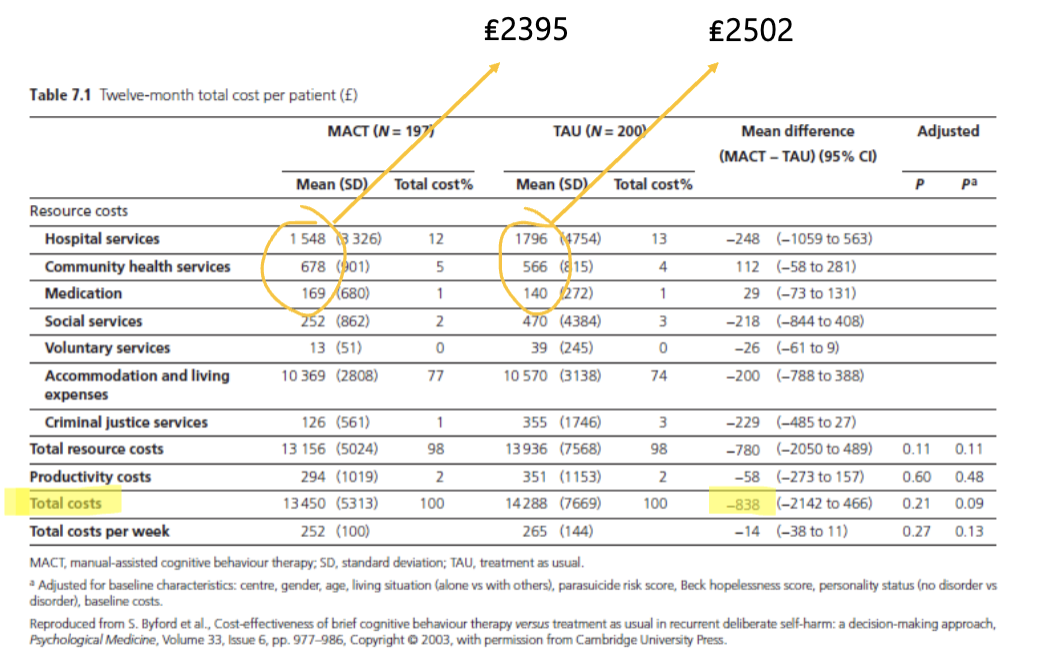
what does this show
more generalized categories
healthcare persepctive only top 3
societal perspective shows (broader) a bigger gap
(note that national guidelines make it clear which perspective to use)
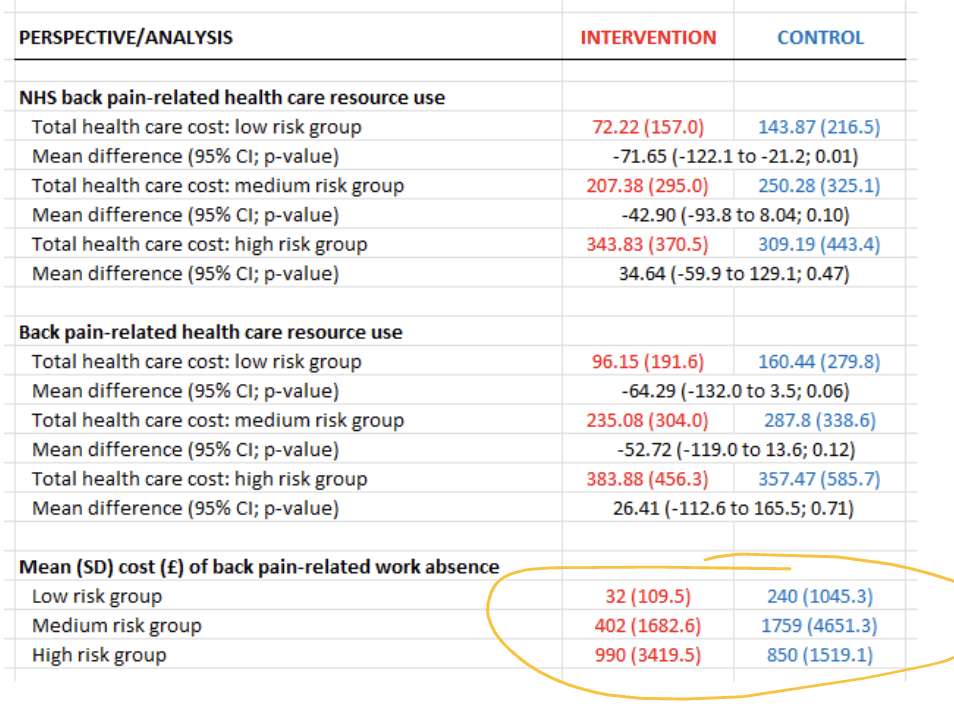
what does this show
very different productivity perspective
differs from first chunk at the top where they are sorta similar
Perspectives: many alternatives
MoH (healthcare), other ministries, ‘government’, employer (only US), agency, patient (rare — considers out of pocket costs), …, etc
Perspectives: Practical considerations ~ Broad vs Narrow
prudent/wise to be broad (but at what cost?)
making complex better but is it possible to maintain
Related Costs: how long for? disease-specific or generic?
How long is a big decision — do you expect there to be difference amongst the groups over time?
This relates to whether costs are evaluated in a disease-specific context or generically across populations
ex. how many times you see GP for a specific illness versus general health issues
Disease-specific vs Generic
← (upper circle) specific: tailored to a particular disease; generic: applicable to a broader population. goof for when you don’t want much variation
← (bottom circle) generic: applicable to multiple diseases or conditions, considers possible side effects (for comparison), good to be aware of
could make a cloudy estimate — complicates for respondent
Related Costs: non-health care costs?
nothing is straightforward in economic evaluation
Related Costs: possible dilemma
extend life vs money
not cost-effective if keeping them alive only causes more costs (expensive treatment)
Related Costs: learning effects
impact of prior experience or education on future health-related decisions and costs. This can lead to variations in treatment adherence and utilization of healthcare resources.
Related Costs: market conditions, patents, etc.
Factors influencing healthcare pricing and accessibility
What is the time period for tracking: hospital, other health care agencies, patient/family/friends
important to consider for follow up and evaluation of healthcare outcomes, including the timing of interventions and resource utilization.
hospital = short-term
other health care agencies = medium-term
patient/family/friends = long-term.
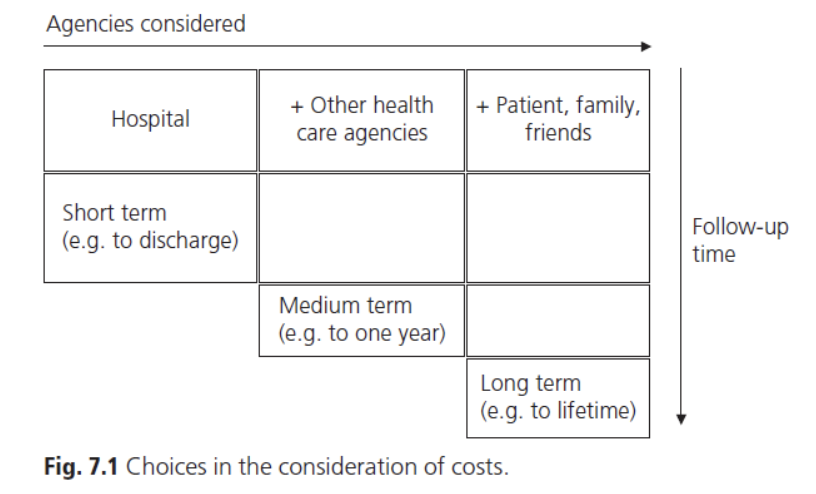
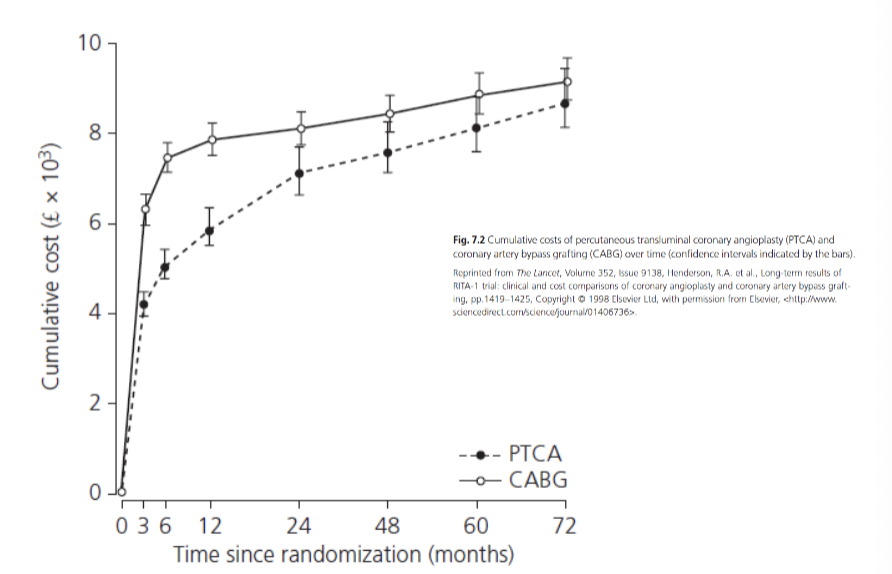
what does this show
allows us to track cost and differences between groups
helps decide when to stop study
shouldn’t stop at 12 months
2 years okay to stop but could still miss info (but change has slowed)
Issue with: Unrelated Future Costs
These are costs that arise due to unintended consequences of healthcare interventions, often resulting in increased spending on long-term care for chronic conditions.
ex. the costs of caring for people with dementia or kidney failure after preventing their deaths from a heart attack
YES: more accurate but complicated, interest in incremental cost and treatment, probability estimates possible outcomes down the line (inaccurate to assume they don’t have further issues)
NO: disadvantage, life saving treatments, focuses on cost and QALY; intervention becomes more expensive could make the intervention less likely to be cost-effective despite initial benefits
NICE CDA: Unrelated Future Costs
yes add
Where do we draw a line: Unrelated Future Costs
Generations? just gets messy
ex. The full opportunity cost of life extension includes all the resource consumed by the survivor less the resources produced by the survivor
Methods of Data Collection (2 main)
Decision modelling vs Trial-based evaluations
(Note: can’t just add economists at the end of study — should be involved with design and study collection)
Decision modelling
synthesize data from various sources (primary studies, reviews, opinion, etc.)
Trial-based evaluations (adv and dis)
Can mix and match for study:
self-report methods
Adv: easily gather individual info
Dis: recall of past history can be inaccurate
medical charts / case notes
Adv: could carry some useful info
Dis: multiple doctors involved so notes can vary (no consistency and might not even be helpful)
routinely-collected data
Adv: could be very accurate
Dis: but not always, could be wrong time frame or information might not be relevant to the study
Methods of Data Collection: Issues to consider
Under-researched area’s are less glamorous and hard to study but equally important
protocol-driven costs
are people using more healthcare b/c they ate in a study
length of recall period (+biases)
inaccurate timeline of treatment that was big in person life
primary consistency
lots of decisions to be made (many differences) making it hard to compare
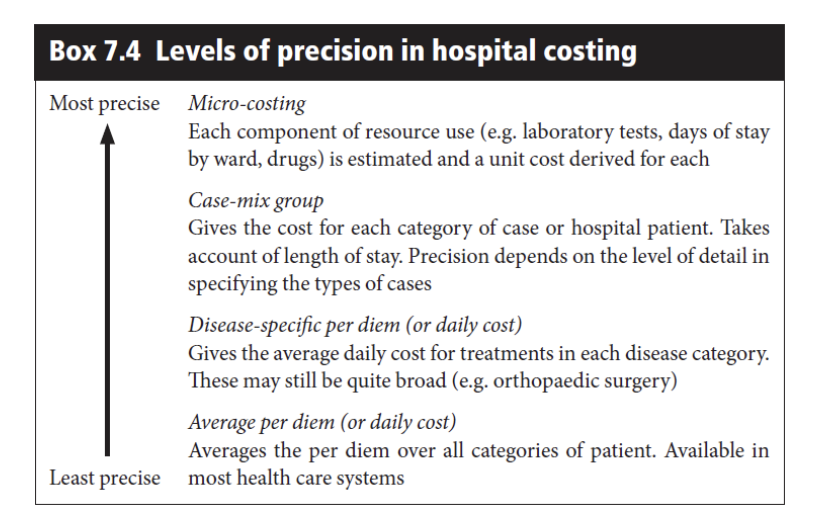
what is costing
how precise do you need the costs to be in terms of capturing all relevant expenditures and evaluating financial outcomes? (time consuming)
two extremes but there are layers between
Precise/Accurate: top-down costing
Makes use of routinely available data. This approach utilizes existing financial records and health data to estimate costs effectively. — more crude/simple
Precise/Accurate: Bottom-up (or micro) costing
Involves detailed tracking of all costs associated with healthcare services at the individual level, including direct expenses like personnel time and indirect costs such as overhead. This method provides a comprehensive view of resource utilization. — EXTREMELY PRECISE
primary data collection, you yourself is responsible for all the data
complex and expensive
gold standard? — no b/c need to balance accuracy
How Precise/Accurate: top vs bottom costing
shows there are groups in between
Productivity changes: higher healthcare costs for individuals to lose fewer work days
challenges whether healthcare system perspective (ignores productivity b/c not cost effective) or societal perspective (which include individual productivity) should be used
Absence from work activities (loss to society) — short-term and future
Components: consumptions activities (individ) + benefit for other (taxation)
wider considerations:
fluidity in the labour market
opportunity cost (emplyment foccus?)
programs for people unlikely to be in work activities (seniors dont contribute)
tacitly accepting different priorities?
W and WE don’t apply
Productivity changes: Approaches to estimation
The methods through which productivity changes due to healthcare interventions are assessed. This may involve analyzing the impact of health improvements on work absenteeism, efficiency, and overall economic output.
Human capital approach, friction cost method (presenteeism, equity, double counting (us panel) ← national guidelines that say productivity is already considered in utility so don’t do again WRONG )
Human capital approach (productivity)
The Human Capital Approach is an economic theory that evaluates productivity by estimating the potential output increase based on health improvements and education investments in the workforce. It focuses on how health status affects labor productivity and economic growth.
absence matters 0 or 100 — CRUDE
friction cost method (productivity)
A technique for estimating productivity losses due to health-related absences by calculating the costs associated with decreased work output, taking into account factors like presenteeism and opportunity costs. — REALISTIC
absence doesn’t matter if replacible (4 days of loss vs all days gone)
presenteeism (productivity changes)
The phenomenon where employees are physically present at work but perform at reduced efficiency due to health issues, leading to lost productivity. This can negatively impact overall workplace performance and economic output.
Discounting
a process that enables a comparison between the value of a commodity consumed in the future with the value of that same commodity consumed now
things in the future what cost vs benefit in todays society
why is discounting important?
many treatments have different time profiles for costs and benefits, e.g.,screening vs heart transplant
allowance needs to be made for differential timing of costs and benefits
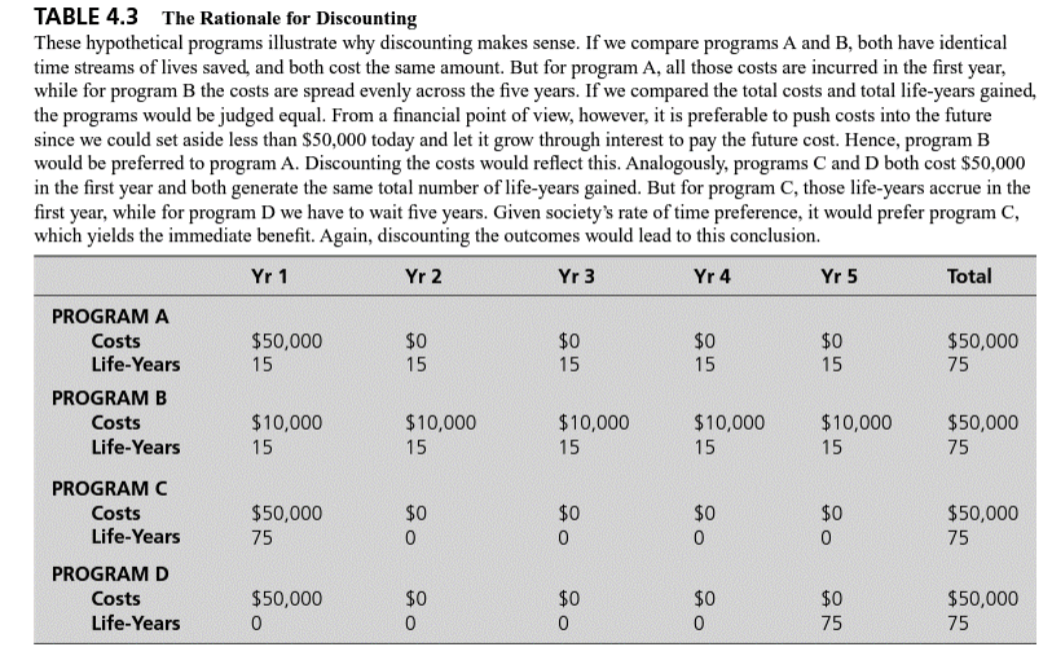
what is this trying to show
varies in cost-benefit but end price is the same
“what is todays’s cost of spending # per yr vs spending upfront”
C already has discount value ~ already today’s value
Key issues with discounting
applies to costs and effects
relevant to any study longer than one year
differential discount rates? (less of a issue now)
keenly debated issue
national guidelines
(don’t worry about where the discount value comes from focus on what the guideline want me to do)
CDA: discounting 2006 → 2017 vs NICE: discounting 2022
2006: discount the costs and health outcomes that occur beyond one year to present values at the (real) rate of 5% per year
2017: discount costs and outcomes that occur beyond one year should be discounted to present values at a rate of 1.5% per year
2022: NICE recommends a discount rate of 3.5% for both cost and health benefits.
Choice of study design
“... comparative analysis of alternative courses of action in terms of both their costs and consequences”
consider circumstance/context: within condition to across conditions (QALY needed ~ generic/standardized)
M&V of Outcomes: single outcome
intermediate outcomes aren’t ideal
monetary outcomes? (difficult in practice)
life years? (pretty crude)
A) better life
B) survival
(which is valued more $$$ or QoL or live longer)
CDA expectations for study guidelines/questions
must be meaningful, worded well
can’t be vague and not specific
any difference should be included
(UK values consistency aims for similarities — WE LIKE)
M&V of Outcomes: QALY (quality-adjusted life years)
mortality and morbidity
quality-weighting survival
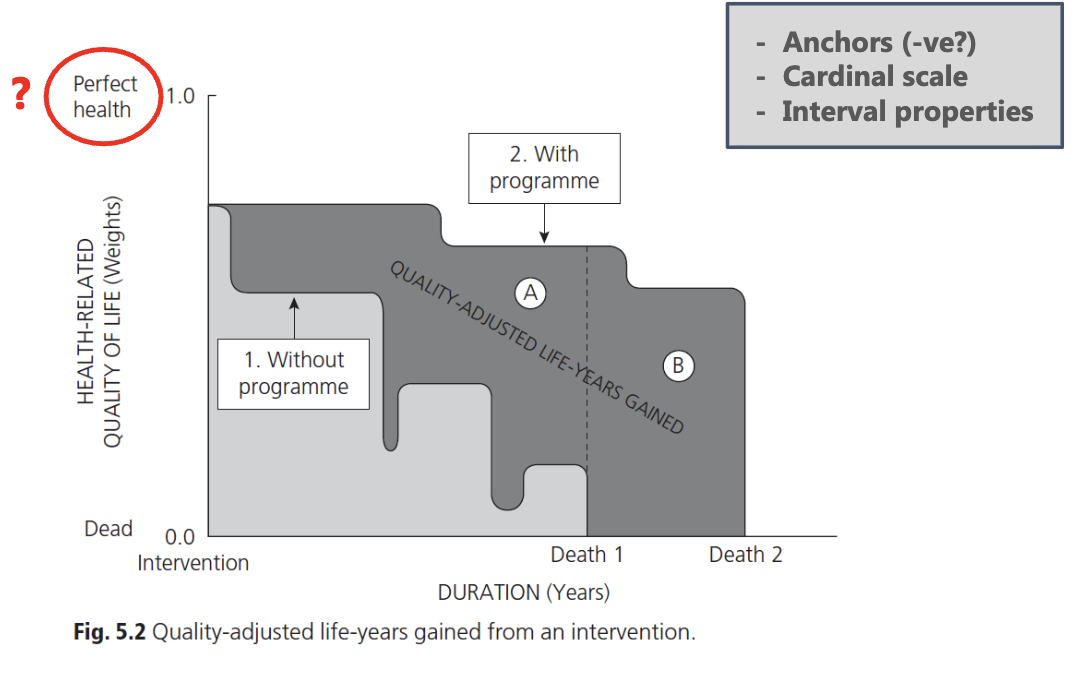
what does this describe?
cardinal scale: shows how predictable QALY can be w/o program/control group
A: purely quality associated
B: survival associated
Perfect health not a good term b/c it is misleading and not proper use FULL HEALTH
interval vs ratio
differ in what zero means:
interval interprets 0 as a point on a scale, while ratio interprets 0 as the absence of the quantity being measured.
life years (LY)
Survival is relatively straightforward (dead or alive)
trial-based evaluations
decision models
quality-adjusted (QA)
quality of life — hard to measure
health-related quality of life
preference-based measures
What is: Health status/HRQoL/subjective health
asking people to self-report (physical, mental, pain)
which aspects should be included: descriptions
Subjective wellbeing
happiness, life satisfaction
reflection that there’s more to being happy than your level of health
does QALY go beyond health economists
yes, it incorporates quality of life and other factors, considering both the quantity and quality of life in evaluating health interventions.
Condition-specific QoL measures
narrow assessment of a dimension (or dimensions) of health for a condition
no cross-condition comparison
generally, not helpful for QALYs
Examples: Asthma Quality of Life Questionnaire (AQLQ), Dermatology Life Quality Index (DLQI), Arthritis Impact Measurement Scale (AIMS), Dementia Quality of Life (DEMQoL)
Generic outcome measures
broader assessment of QoL/HRQoL — anyone can complete it than generic
enables cross-condition comparison
can be insensitive (being less sensitive is to be expected)
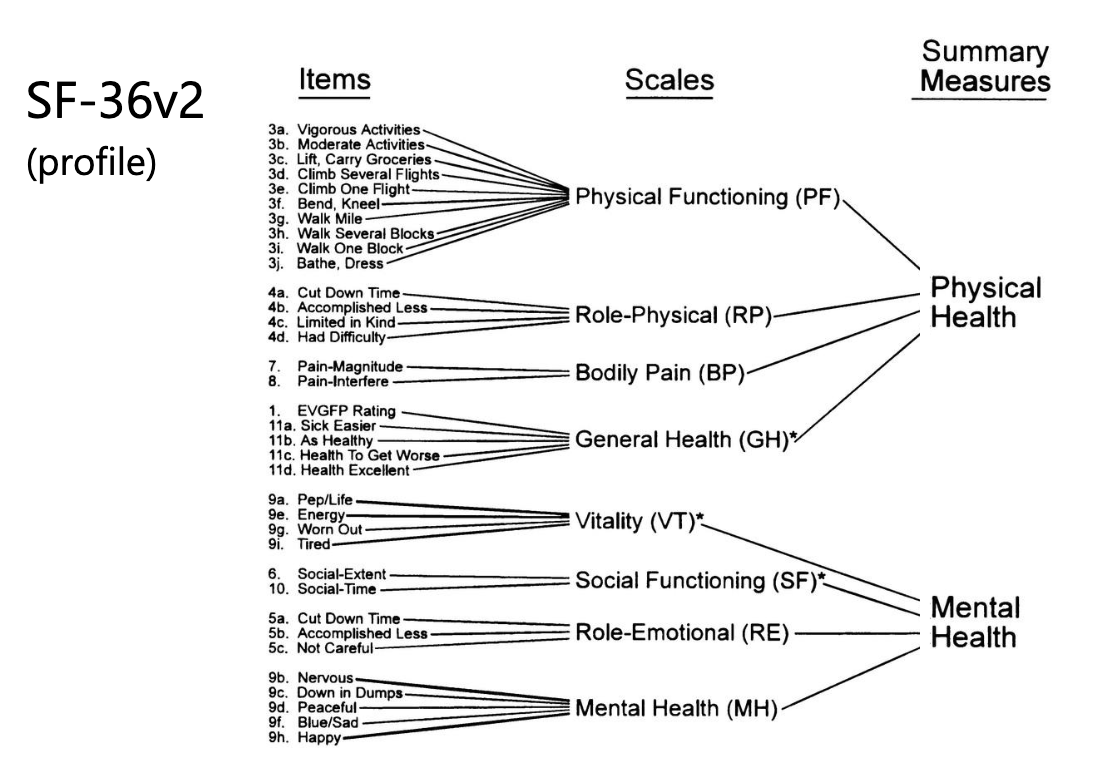
Examples: Nottingham Health Profile (NHP), SF-36v2, Quality of Wellbeing Scale (QWB), EQ-5D-3L, EQ-5D-5L, Health Utilities Index (HUI) Mark 3, etc.
Profile vs Index Scores
Profile scores assess multiple dimensions of health e.g., SF-36v2
captures multiple dimensions/domains — not helpful for QALYs
Index (single value) scores condense this information into a single value, allowing for easier comparison. — summarize ECONOMIST LIKE (easy descion making)
trade-off: comprehensive coverage and the ability to derive a single value
can incorporate preferences
Estimating QALYs: Index Scores
Direct measurement of values: ‘direct’ elicitation from an individual, own health or hypothetical scenarios
This method utilizes various instruments to evaluate health outcomes and convert them into quality-adjusted life years (QALYs), often allowing for more generalized comparisons in healthcare.
Indirect measurement: ‘off the shelf’ scores, separation of description and valuation to derive a single value representing quality of life, typically using a standardized approach.
Direct Preference Measurement
Methods to derive index scores: standard gamble & time trade-off, scales (rating, category, VAS), discrete choice experiments
Beyond the QALY: willingness-to-pay (CBA), wellbeing and capabilities?
Desirable Properties
Sacrifice = determining the strength of preference should involve some kind of sacrifice — give something up
Uncertainty = health outcomes & decision-making are uncertain in the real world
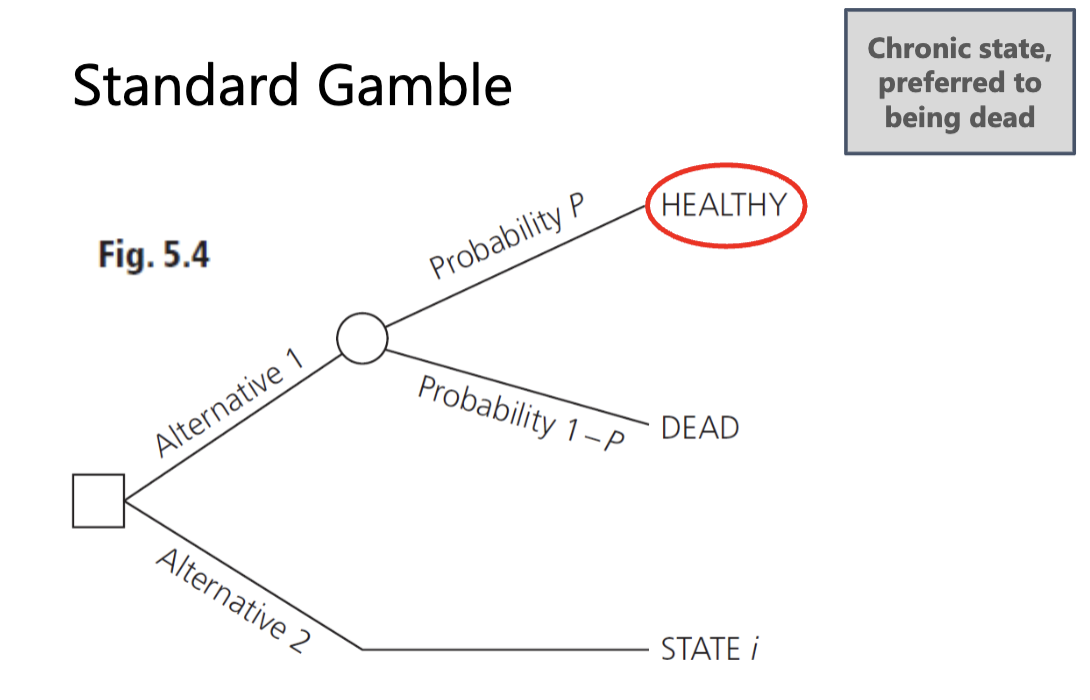
what is standard gamble and what does this show
standard gamble = method for measuring preferences by presenting a choice between a certain outcome and a risky one
tends to produce higher values (compared to TTO) b/c easier to avoid immediate death
The probability (P) is varied until the individual is indifferent between the two alternatives (where P = P* ). The preference score or health STATE i is P*.
props and visual aids
temporary health states
states WTD
there is a point of indifference that would indicate end of exercise
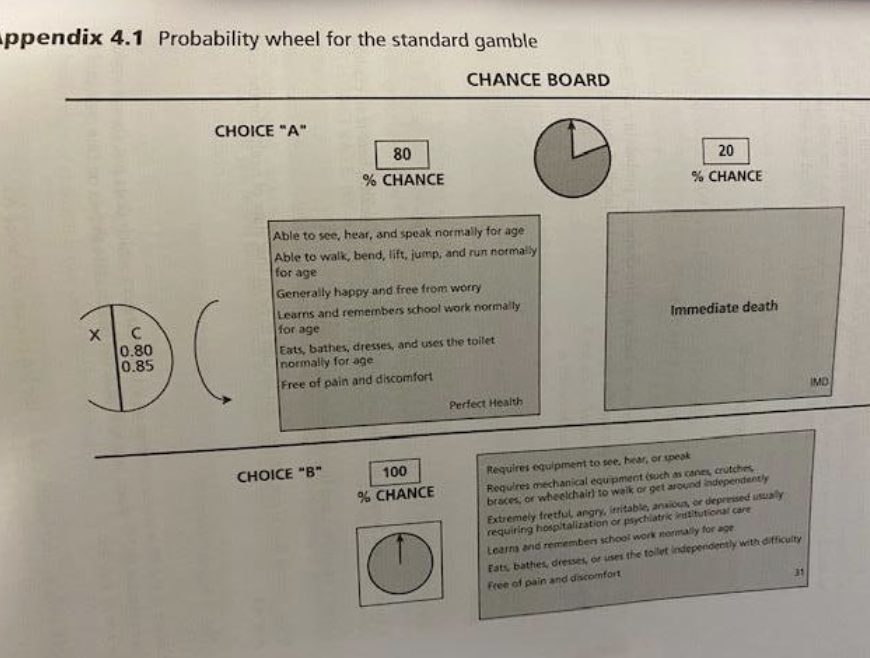
Standard Gamble: Adv vs Dis
Adv: strongest theoretical foundation, both desirable properties
Dis: unrealistic uncertain outcome, artificial risk, cognitively challenging
Gold standard? — no
what is a Time Trade-Off
A method used to assess preferences for health outcomes by determining how much time individuals are willing to trade off to avoid a less desirable health state. — chronic state is preferred to being dead
Here, x is varied until the respondent is indifferent between the alternatives. The preference score for health state i is, hi = x/t.
there is a point of indifference that would indicate end of exercise (can’t go in past so no negative)
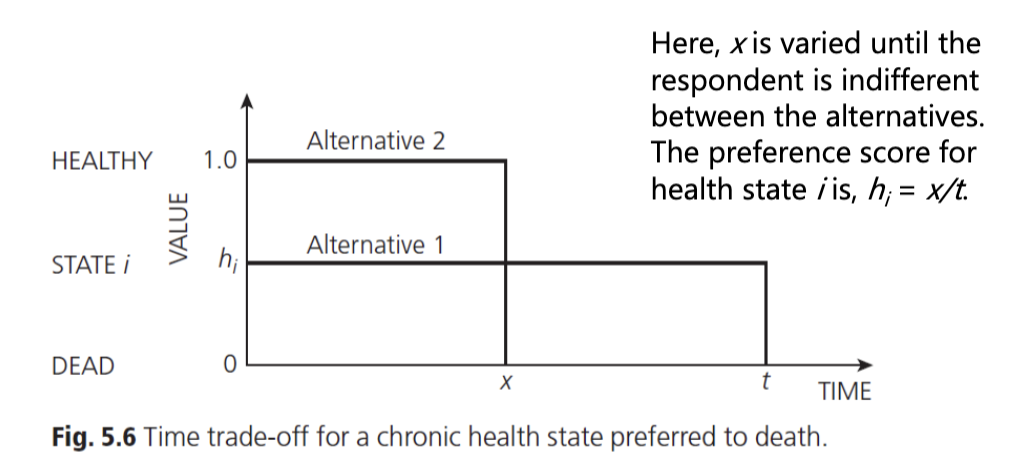
Time Trade-off: Adv vs Dis
Adv: decision context: quality and quantity, no probability
Dis: desirable properties not clearly established (sacrifice but no uncertainty), unrealistic
Standard Gamble vs Time Trade-off
TTO is simpler’ alternative to SG
theoretically weaker
avoids probabilities
ariants (lead time TTO, props, scripts, etc.)
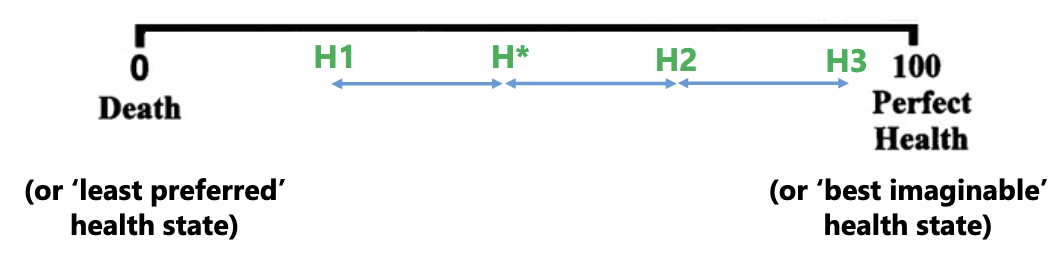
Scales (rating, category, VAS)
Ranking & placing on a scale e.g., consider five health states
need to focus on intervals (many variants, thermometer is common)
Respondents could be asked to place health states on the line. The intervals between the states should reflect the strength of the respondent’s preferences.
extremes 0→100 no meaningful between health states; intervals represent preferences
dead is a state no events allowed (so not death)
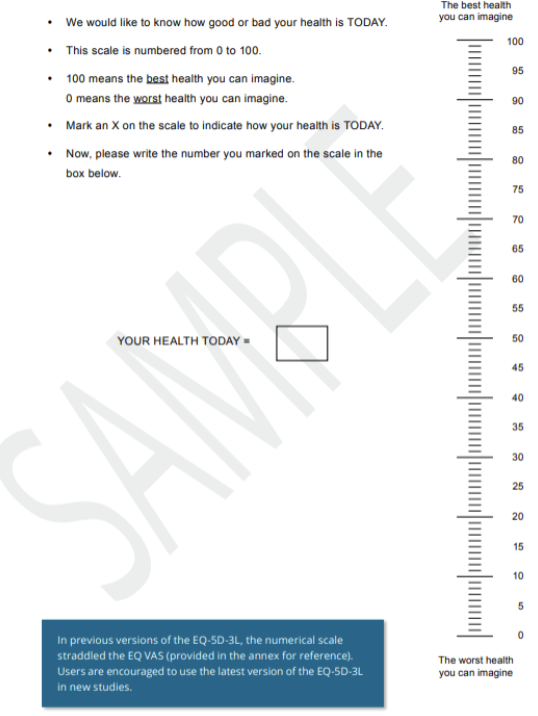
what is this?
Example of a visual analogue scale (VAS) — Used to value a respondent’s own health
This version is part of the EQ-5D instrument, developed by the EuroQol Group
Scales (rating, category, VAS): Adv vs Dis
Adv: theoretical base (although not in economics), simple to administer and complete
Dis: choiceless context, meaningful intervals, less accepted, no sacrifice or uncertainty
what are Direct and Indirect (list)
Direct: TTO, SG, VAS
Indirect: MAUI, EQ-5D, HUI
what are Indirect (MAUI)
Standardized questionnaires that measure health-related quality of life using algorithms, often incorporating utility values to estimate health status. — RECOMMENDED
(EuroQol Group (EQ-5D-3L & EQ-5D-5L), Health Utilities Index, SF-6D & SF-6Dv2; VR-12)
Scoring is based on societal preferences (political)
Components of Indirect (MAUI)
descriptive component + valuation component that together provide a comprehensive assessment of health status.
Can you compare Indirect and Direct approaches
No reason why you can’t explore indirect and direct approaches. But… costly and fundamentally different sets of values
Endless discussion in the literature about the role and appropriateness of generic preference-based HRQoL measures
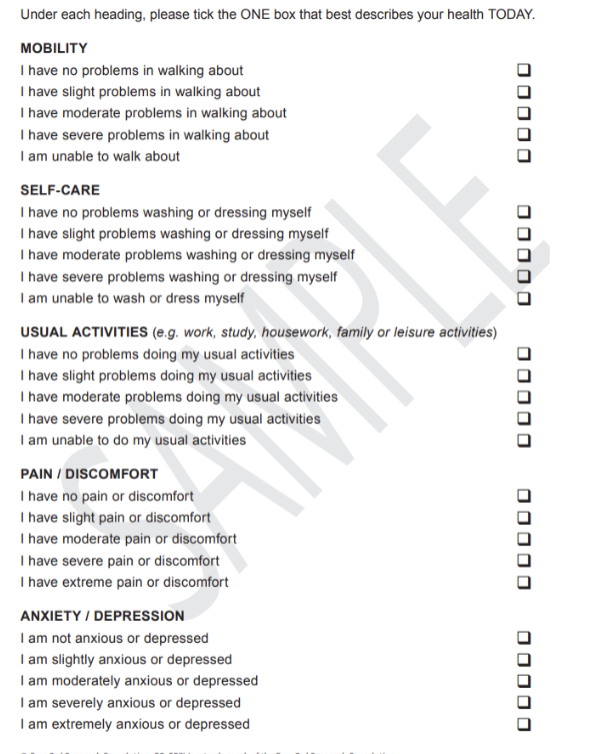
Indirect (MAUI): EQ-5D-3L & EQ-5D-5L
53 (243) and 55 (3125) health states
primarily TTO methods
profile value: 1 2 3 2 1,
index value: 0.755, most important #
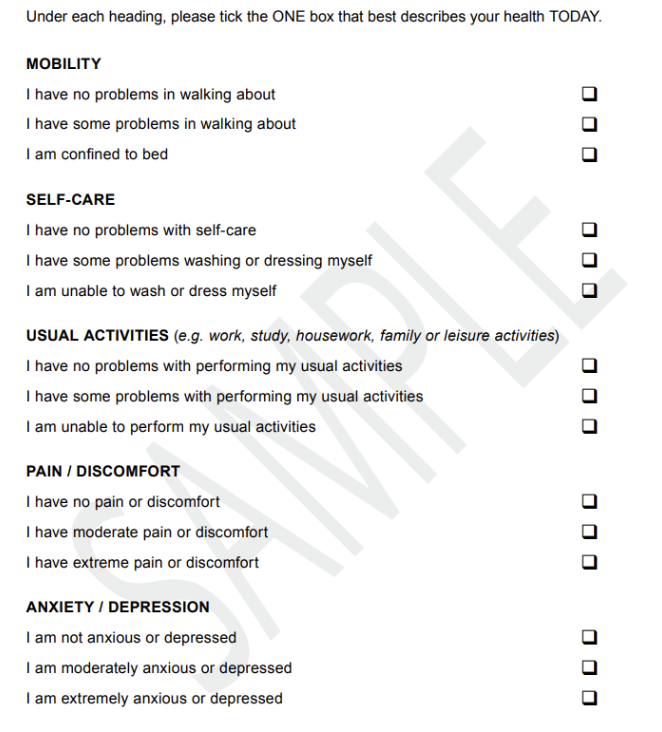
EQ 5D 3L VS 5D 5L
The EQ-5D-3L and EQ-5D-5L are standardized instruments for measuring health-related quality of life (HRQoL), where the 5L version offers greater sensitivity with five levels of health states compared to three in the 3L version, providing more detailed assessments.
3 fails survey design b/c it asks two things in one question, very definitive choices that aren’t clear and can lead to interpretation
EQ-5D-5L (predictions): Which dimensions are most valued to you?
dimensions are not valued equally (kind of the whole point)
unweighted scores (min. = 5; max. = 25) used in some contexts but nothing to do with QALY estimation
utility decrements associated with the levels of severity
11111 = 1.000* full health
Canada is the only one that doesn’t go to 1.0
dead = 0.000
55555 = ????? (negative values possible — worse than death)
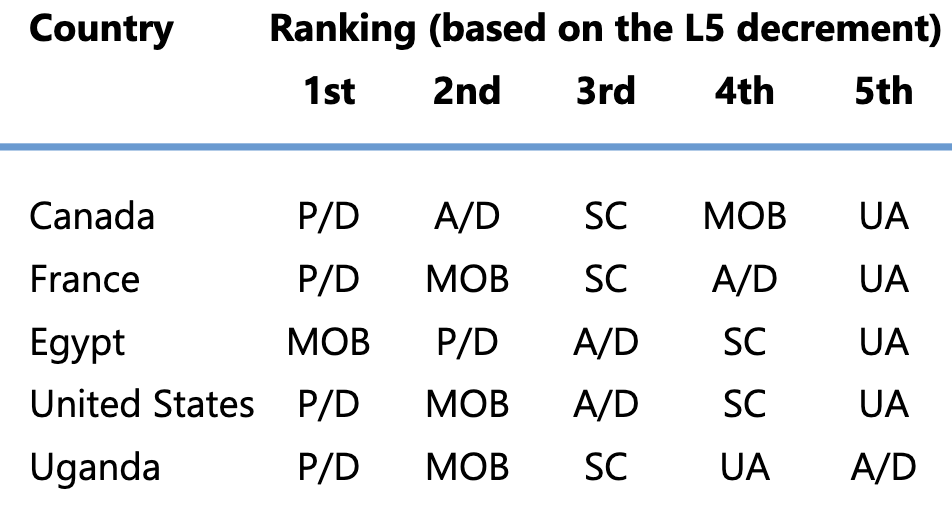
EQ-5D-5L (predictions): Which dimensions do you think are most valued by society?
Pain and discomfort on average most important, and Usual Activities is ranked last on average
Canada is the outlier to mobility with having it ranked lower — due to accessibility and help provided here
Uganda ranks anxiety and depression the lowest — due to culture and interpretation of mental health
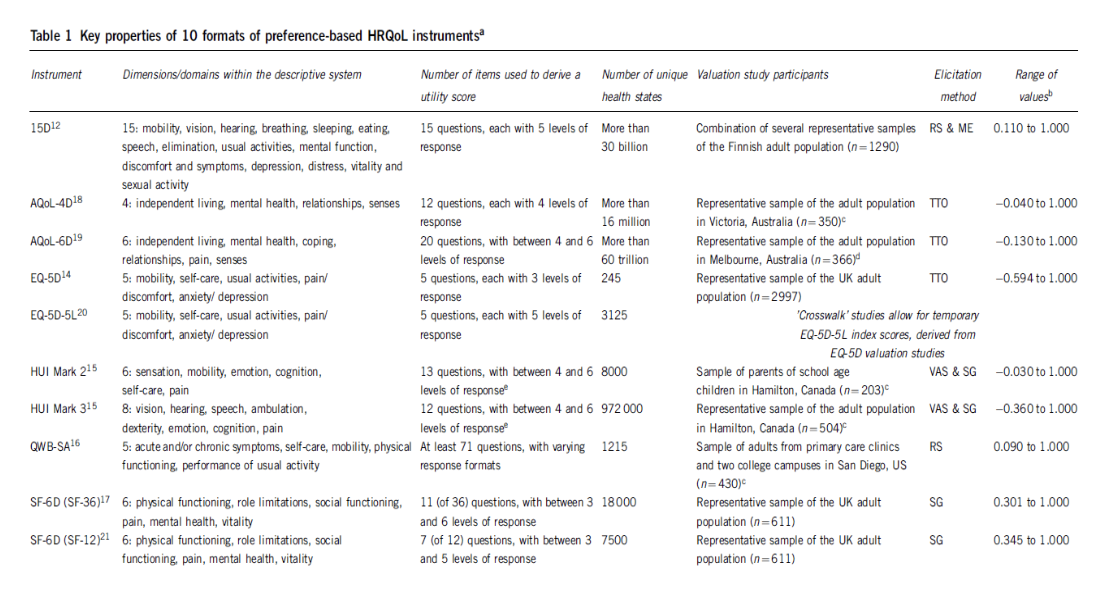
what does this show?
this is the overall summary
single resource that shows despite the various surveys used there are key values amongst them
lots of variability in values -0.59 QALY vs 0.34 lowest (some don’t rank to dead and some get worse than dead)
Indirect (MAUI): SF-6D & SF-6Dv2
derived from longer questionnaires
SG & DCE methodology
more health states (compared to EQ-5D)