Economic Growth
1/74
There's no tags or description
Looks like no tags are added yet.
Name | Mastery | Learn | Test | Matching | Spaced | Call with Kai |
|---|
No analytics yet
Send a link to your students to track their progress
75 Terms
6 Major Macroeconomic Objectives
1) Sustainable Economic Growth
2) Price Stability
3) Equitable distribution of Income
4) Improve international competitiveness
5) Improve standards of living
6) Low level of unemployment
GDP
Total value of national output of goods + services produced in an economy over a given time period (usually a year/ quarter of a year)
How to calculate GDP
Expenditure
AD (C + I + G + (X-M))
Factor Incomes
Wages (labour), rent (land), interest (in exchange for financial capital), profit (entrepreneurship)
EXCLUDES transfer payments (payments made by govt. to individuals without receiving any goods or services in return, e.g. benefits, pensions)
This would be double counting (benefits is govt. simply redistributing income)
Value of Output
Value added from each of the main economic sectors
(Sectors: Primary (e.g. farming, fishing & mining), Secondary - (construction, manufacturing), Tertiary (services e.g. tourism), Quaternary (e.g. business consultancy))
VALUE ADDED = increase in market value of goods/services during each stage of production/supply
EG: we can measure the value of wheat produced by a farmer; we can then measure the additional value as a miller turns the wheat into flour (avoids double counting)
Value added = value of production - value of intermediate inputs used in supplying a good
UK industries
De-industrialisation - Decline of manufacturing + construction
Ongoing in UK - in 2018 manufacturing contributed 10% of GDP and 8% of all jobs
In other countries (e.g. China), manufacturing account for larger percentage of national income
Services (tertiary sector)
2018 - 80% of GDP , 83% of jobs
Economic Growth
Short run economic growth (actual) is the increase in the real value of goods and services produced, measured by annual percentage change in GDP
Long run economic growth = increase in country’s productive capacity (potential output)
Nominal GDP
Monetary value of the national output of goods and services, measured at current prices
Value measure (takes into account prices + quantity)
Real GDP
Nominal GDP adjusted for changes in price level (measured in constant prices)
Volume measure (only takes into account quantity)
Limitations of GDP
Income inequality
Risk of double counting
Doesn’t take into account other quality of life measures
Dismisses informal activity (illegal/ unpaid work)
Errors given vast data collection
Quality of output ignored
Dismisses negative externalities (Green GDP)
Positives of GDP
Internationally comparable
Comparable over time
Correlates with HDI (human development index)
GNI (gross national income)
GDP plus net factor income from overseas (income earned by domestic workers abroad minus income earned by foreigners domestically)
GNI = value of everything produced by factors of production owned by a country, no matter where they are located.
Remittance money included (e.g. money sent back to families by workers abroad)
GDP per capita
GDP/ population
Avg. measure of individual incomes in economy
PPP - Purchasing Power Parity
Measures how many units of one country’s currency are needed to buy same basket of goods and services as can be bought with given amount of other currency
In high cost of living countries (Switzerland), there is downward adjustment of PPP-adjusted GNI per capita (lower purchasing power)
US experiences inflation, GBP converted to Dollars cannot buy same amount of goods, GBP is undervalued against dollar.
Exchange rate
Nominal/floating exchange rate = actual market rate at which currency can be exchanged for another
Real exchange rate - takes into account CHANGES in prices/costs
Big Mac Index
Compares prices of Big Macs in countries compared to what they should be according to nominal exchange rate
US price is $4.74, compares to other countries to see how under/overvalued local currency is against US dollar
Converting nominal to real GDP
Real GDP = Nominal GDP/ GDP deflator (new price index) x 100
Example:
• Let the nominal (money) value of UK GDP in 2016 be £1400 bn and let the price index for 2016 be 100
• In 2017, the nominal value of GDP rises to £1450 bn
• In 2017, price index rises to 103
• Therefore .......Real GDP in 2017
• = (Nominal GDP x 100/price index in 2017)
• = £1,450 bn x 100/103
• Real GDP = £1,408bn (expressed at constant 2017 prices)
Economic Wellbeing
Statistic collected by ONS
Considers personal life satisfaction/ anxiety/ stress of citizens
Median Income
Better measure than GDP per capita as it rules out outliers (small no. of rich households)
Real income and subjective happiness relationship
Subjective happiness = self-reported measure of how individuals perceive their overall happiness + satisfaction with life
Rich societies not necessarily happier than poorer ones
Easterlin Paradox
Life satisfaction does rise with average incomes up to a point, after which it plateaus (marginal gain in happiness declines)
Because we find relative income important
Inflation
Sustained increase of average price levels of goods and services over a given period of time in an economy
Deflation
Sustained decline in the general price levels over time (below 0%)
Disinflation
Fall in rate of inflation - prices rise but at a slower rate
Stagflation
Rising inflation during a recession (caused by cost-push inflation)
Hyperinflation
Period of very high rates of inflation - leads to loss of confidence in country’s economy
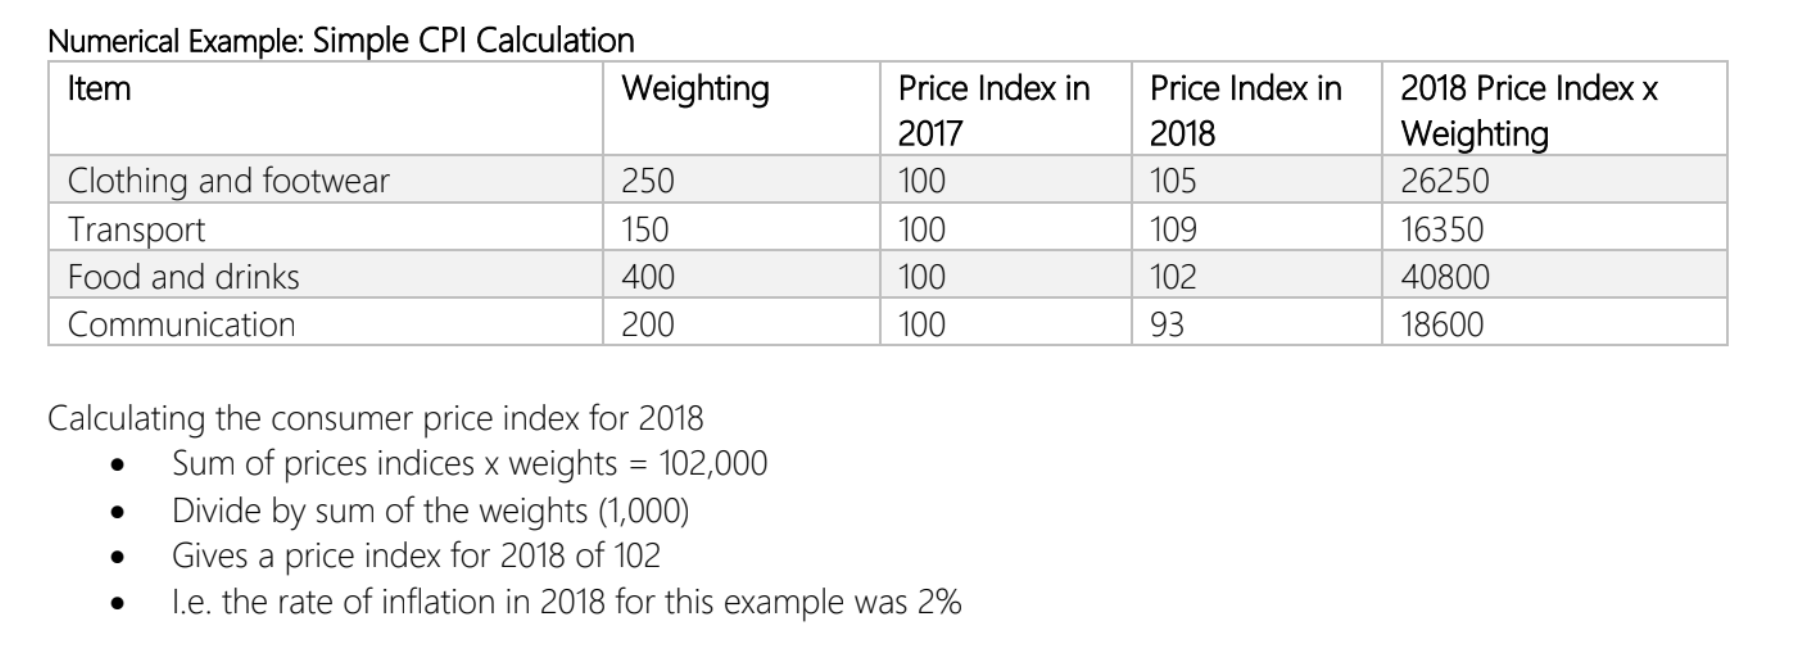
CPI
Main measure of inflation in UK
Select base year for prices
Carry out “expenditure survey” (thousands of households)- tracks what people are buying
Representative, weighted basket of over 700 goods + services used (updated yearly)
Weights according to percentage of income
Weighted basket prices converted to index prices
Percentage change is annual inflation rate
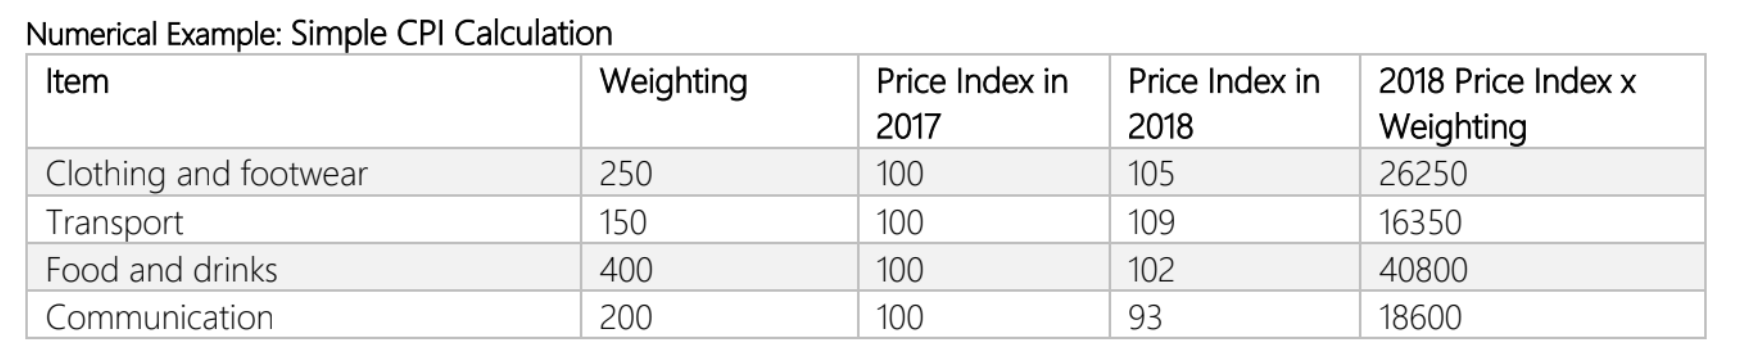
Find the CPI for 2018
Limitations of CPI for calculating rate of inflation
Not everyone follows spending patterns of average family - personal inflation rates differ
Price fluctuations of certain goods (food, energy) distorts CPI because their demand is price inelastic (avoided by CORE CPI (CPI minus prices of these goods) or PPI - producer price index, price of goods when manufactured)
Doesn’t include housing costs (CPIH does)
Basket updates too slowly
Doesn’t account for change in quality of a good
RPI
Includes cost of home ownership
Calculated arithmetically
Produces higher rate
Cost Push inflation
SRAS shifts left
Increase in cost of production for firms in economy
Passed on as higher cost of produce
Cost push inflation causes
Increase in:
Raw material prices
Wages
Business taxes
Price of imported raw material due to weak exchange rate
Demand pull inflation
AD curve shifts right
Greater pressure on existing FOPs
Price mechanism - prices of FOPs increase
Increased cost of production for firms, passed on to consumers as higher prices of products
Demand pull inflation causes
Decreased interest rates
Lower income/corporation tax
Higher consumer/business confidence
Weaker exchange rate - imports become more expensive, so less demand for them
Increased govt spending
Effects of inflation
Wage/consumer price spiral - employees bargain for higher wages (anticipating inflation) companies pass on prices to consumers, spirals
Decrease in real value of income
Erodes savings - interest rates not in line with inflation
Shoe leather cost - time, inconvenience spent trying to avoid holding cash when high inflation
Lower export competitiveness - reduces revenue from exports, bad for trade dominant countries
Consumers buy in advance to protect from higher prices, increased AD - inflation spirals further
Fiscal drag - workers dragged into higher tax brackets (but wages rise in line with inflation, no gain) but pay more tax
Inflationary noise - rate is volatile, price signaling loses value. Uncertainty means that consumption put off, leading to lower growth.
Winners + losers from high inflation
Winners
Debtors
Firms whose prices rise more than costs
Workers with bargaining power
Losers
Lower income workers, lower bargaining power
Exporting firms (become less competitive)
Retired people on fixed incomes
Evaluation of effects of inflation
Depends on:
rate of inflation
type - demand pull is better (higher growth, lower unemployment)
Stability (inflationary noise)
Anticipated or not
Duration
Growth of money supply
Leads to inflation - “too much money chasing too few goods”
Quantity theory of money
Expressed using Fisher Formula
MV = PT (M = money supply, V = velocity of money - how many times it changes hands, P = Price levels, T = Total volume of output)
V and T are constant. Assume that if M increases, P increases.
Hyperinflation often attributed to money supply
Causes of deflation
Malign - demand side deflation
Deep fall in demand in economy - cause by persistent recession/depression
High level of spare capacity
Benign - supply side deflation
AS in economy rises quicker than AD
Attributed to technological improvements
SRAS shifts outwards
Effects of deflation
Delayed spending
Reduction in GDP
Real value of debt increases
Real cost of borrowing increases (real interest rates rise if nominal do not fall in line with deflation)
Lower profit margins
Lower confidence (value of assets falls)
Exporters more competitive,
Unemployed definition
Of working age (16-64)
Willing and able to work
Actively seeking but unable to find job
Looking to start within next two weeks, has actively sought work within last 4 weeks
Claimant count
Number of recipients of JSA (job seeker’s allowance) + those who must be looking for work to claim Universal Credit (UC)
Limitations of Claimant count as a measure of UE
1) There are unemployed who do not meet criteria for benefits (have a partner in employment, have savings, are under 18)
2) Stigma around claiming - people might feel shame
3) Not internationally comparable
Advantages of Claimant count measure of UE
Inexpensive
Easy to see regional differences
Data produced monthly
Labour Force Survey method
LFS (Labour Force Survey), approach taken by ILO (International Labour Organisation)
Asks 60,000 households to classify as employed, unemployed or economically active
Unemployed = Without a job, want a job, have actively sought work in the last four weeks, and are able to start workwithin the next two weeks; or out of work, have found a job and are waiting to start it in the next two weeks
Advantages of LFS method
ILO measure so internationally comparable
More representative
Criteria is consistent - so historically comparable
Limitations of LFS
1) Only 60000 households - prone to sampling errors
2) Costly + time consuming
3) Only done quarterly, updates may be delayed
4) Doesn’t take into account under employment - those on zero hour contracts
5) Headline rate doesn’t reveal disparities (gender, race, regional etc.) which are used to reveal structural flaw in economy
Long term unemployed
Unemployed for at least one year
Labour force
No. of working age who are able, available and willing to work
Full employment
Enough unfilled job vacancies for all unemployed to take work
Economically inactive
Of working age but not working/seeking paid work (don’t count as unemployed)
Main reasons:
Student in full time education
Looking after family
Long term illness
Retired (early)
Discouraged workers
Employment rate
% of population working age in full time / part time paid work (employed / total working age population x 100)
Unemployment rate
unemployed/ economically active x 100
Under employed
People looking for extra hours
People who are over qualified - their labour is under-utilised
Cyclical unemployment
Demand deficient unemployment
Caused by weak AD in economy - reduced demand for labour
Results in contraction in national output - workers made redundant as a result
Demand for labour is derived from demand for goods and services
Cyclical employment rises quickly in recession (subject to trade cycle)
Frictional unemployment
Workers in between jobs
School leavers
Always present in labour market
Temporary, voluntary form of unemployment
Structural unemployment
Lack of suitable skills among workers for available jobs
Result of de-industrialisation / other structural changes of economy (automation, globalisation, industry decline)
Geographical immobility - workers unable to move from area of high unemployment to those with labour shortages
(cost of living, transport)
Occupational immobility - workers being unable to move between different types of jobs/sectors, because of lack of relevant skills/qualifications
REVISE DIAGRAMS FOR EACH TYPE OF UNEMPLOYMENT IN BOOK
Unemployment trap
Little financial incentive to start working because loss of welfare benefits + paying of income tax results in them being worse off
Seasonal unemployment
When seasonal workers are without jobs because of time of year
Demand for labour in industries fluctuates predictably according to time of year, weather, holidays
Real wage inflexibility
Classical unemployment
Real wages are too high, leading to excess supply of labour in labour market due to insufficient demand of employers
Minimum wages (push up wage above free market equilibrium, leading to excess workers and unemployment), collective bargaining of trade unions
Monopsony employer (single buyer of type of labour, like NHS for nurses) causes employment to be lower than free market equilibrium
Wages are “sticky downwards” (Keynesian view), are hard to adjust downward due to bargaining, pay cuts are damaging to morale
Define real wage inflexibility
Real wage inflexibility occurs when real wages fail to adjust downward to clear the labour market, causing persistent unemployment.
Negatives of long term unemployment
Longer without a job, harder it is to find way back into employment (skills worsen due to economic inactivity, motivation falls)
Leads to hysteresis (event continues even when causes of it have been removed) - total capacity of labour market falls as workers de-skill
Costs of UE
Slower long run trend rated of economic growth
Risk of deflation/ disinflation - falling AD
Increased strain on NHS, mental health poor
Increased income inequality, crime levels
Increase in relative poverty
Lower standards of living, purchasing power
Erosion of skills (depending on how long unemployed)
Tax revenue shrinks - fiscal costs to govt. (welfare spending increases) - budget deficit (divert money from elsewhere)
Firms selling luxury goods - lower revenue
Operating below PPF - decrease in confidence
Potential benefits of UE
Leads to lower cost of production for firms (paying less in wages) so more revenue (esp. if labour replaced by capital)
Higher bargaining power for firms - can reduce wages
More leisure time
Less imports (less demand for luxury goods)
At level of 3-5%, it causes lower inflation and spare capacity is needed in economy to open new firms
“Natural unemployment”
Net migration
Net total of migrants during period (citizens + non-citizens)
Policies to reduce UE
1) Macro stimulus policies - causing positive multiplier effects (firms)
Low interest rates + improving credit supply to businesses
Infrastructure investment policies
2) Cut firms’ cost of employing more workers
Lower National insurance contribution rates
Financial support for apprenticeships
3) Stronger work incentives
Higher minimum wage
Lower welfare payments - reform to system to prevent poverty trap
Increased tax-free allowance
Net migration in 1990s
0
Since when has net migration been positive?
1994
Net migration today
204,000
Benefits of migration
Increase AD
Fiscal contribution
Helps w/ demographics (countries with ageing populations)
Increase in GDP
Greater skill base in certain industries - hospitality, construction
Drawbacks of migration
Pressure on public services
Overcrowding
Congestion
Housing shortage
Social disharmony
Pushes down wages (only in low income)
Evaluation for effects of migration
Depends on:
Demographic + skillset
Ease w/ which they settle
Dynamic effects - innovation + research
Does rise in labour migration stimulate capital spending of firms + govt.?
Duration of their stay
Recession
2 consecutive quarters of negative economic growth
Boom
Rate of growth of GDP is fast and higher than long term trend
Depression
GDP falls by at least 10%
Prolonged downturn in economy
Recovery
Phase after recession - real GDP starts increasing, UE falls