EEMB 148: Midterm 2
1/74
There's no tags or description
Looks like no tags are added yet.
Name | Mastery | Learn | Test | Matching | Spaced | Call with Kai |
|---|
No analytics yet
Send a link to your students to track their progress
75 Terms
what are the two sources of phosphorus in rivers?
drainage basin (runoff)
some anthropogenic (i.e. insecticides, pesticides, fertilizer…)
what is the one additional source of phosphorus in rivers?
pacific salmon
live in the ocean, breed in freshwater (less predators, but less food)
mass breeding migrations brings organic phosphorus into rivers
death of adult salmon releases additional nitrogen and phosphorus into the system
helps to supply a nutrient poor system
promotes algae growth → feeds insects → feeds juvenile fish
what are the two major forms of phosphorus in a river?
dissolved inorganic phosphorus (PO43-)
uptake by autotrophs and bacteria
soluble reactive phosphorus (SRP)
able to pass through the cell membrane
organic phosphorus (RNA, DNA, etc.)
phosphatase enzyme (extracellular release)
index of phosphorus limitation (high conc. of enzymes = P limited)
is phosphorus a limiting nutrient in rivers? how does that effect the way bacteria and algae interact with phosphorus?
Yes. P is usually the primary limiting nutrient in freshwater (limits primary production and decomposition)
bacteria can efficiently uptake phosphorus at low concentrations, but have little storage
algae rapidly uptake phosphorus at high concentrations and can store it
how do large rivers complicate the amount of phosphorus present?
inorganic turbidity - phosphorus is adsorbed (sticks) to suspended sediments
what does sediment, light, phosphorus, and algal production look like in a turbid river?
high sediment; low light; high phosphorus; low algal production
what does sediment, light, phosphorus, and algal production look like in a clear river?
low sediment; high light; low phosphorus; low algal production
how does sediment, light, phosphorus, and algal production change where turbid and clear rivers mix?
phosphorus is able to desorb from the sediment (due to change in concentration gradient)
phosphorus become SRP which, in combination with less turbidity, can be used by algae in the river
results in algal blooms (river-reservoir interface)
what is the nutrient spiraling concept? what does it measure?
nutrients are moved downstream (TRANSPORT) and processed by the organisms in a river (CYCLED)
this combination of transport and cycling leads to SPIRALS moving down a river
spirals allow us to measure the retentiveness of a river
what is the general concept behind nutrient spiraling?
the slower the downstream movement, the more times an atom can be utilized (fuels production)
what is the spiraling length and how is it calculated?
spiraling length: the average distance traveled by a nutrient atom during one complete cycle
product of downstream velocity and time
S = V * T
S = spiraling length; V = velocity; T = time for one cycle
what are the two implications based on the spiraling length equation?
increase the velocity = longer spiraling length (moves downstream faster)
decrease the time = shorter spiraling length (moves downstream slower)
how do we measure nutrient deposition?
S = Sw + Sb
Sw = spiraling length in water (uptake length)
Sb = spiraling length in biota
what is the “in-theory” equation for Sw and how is it actually measured?
in-theory: Sw = Vw * Tw
in practice: plot flux versus distance of radioactive tracer
Fw (flux) = mass/time (g/sec)
what is kI and what does a larger kI indicate?
kI = slope of decline in flux with distance
larger kI = greater rate of decline = steeper slope
indicates MORE uptake and SHORTER spiraling length
what is the rearranged equation for spiraling length in water? what are the two major outcomes from that rearrangement?
Sw = Fw / U
Fw = flux rate
U = uptake rate
increased Fw = increased spiraling length
increased U = decreased spiraling length
what is the “in-theory” equation for Sb and how is it actually measured?
in-theory: Sb = Vb * Tb
in practice: measure the loss of a label (sample over time)
what is kb and what does a larger kb indicate?
kb = slope of decline in flux with time
larger kb= greater rate of decline = steeper slope
indicates MORE uptake and SHORTER spiraling length
how do you measure Vb?
Fb = Vb * Nb
Fb = flux rate; Vb = average velocity of biota; Nb = concentration
what is the rearranged equation for spiraling length in biota? what is the major outcome from that rearrangement?
Sb = Vb / kb
increase in biota = decreased spiraling length
which value has a larger affect on spiraling length?
the spiraling length in water
what are the four factors that affect spiraling length?
stream geomorphology
discharge
algal and bacterial biomass / growth rate
consumers
how does stream geomorphology affect spiraling length?
impacts adsorption by sediment and downstream trends (typically high to low retentiveness)
sand = travels long
course sediment = travels short
lots of organics = travels short
how does discharge affect spiraling length?
low flow = high uptake = high retentiveness = travels long
high flow = low uptake = high flux = ravels short
how does algal and bacterial biomass affect spiraling length?
lots of algae = increases uptake = decreases flux = travels short
lots of bacteria = increases uptake = decreases flux = travels short
how do consumers affect spiraling length?
sedimentary consumers = stays in one place = travels short
mobile consumer = decreases retention = travels long
what are the three size classifications for matter in a river?
CPOM
> 1mm, slowest velocity, most from leaf fall
FPOM
<1 mm to >0.45 um, intermediate velocity, most from soil organic matter
DOM
< 0.45 um, fastest velocity, most from leaching of soil/leaves, dominant form of organic matter
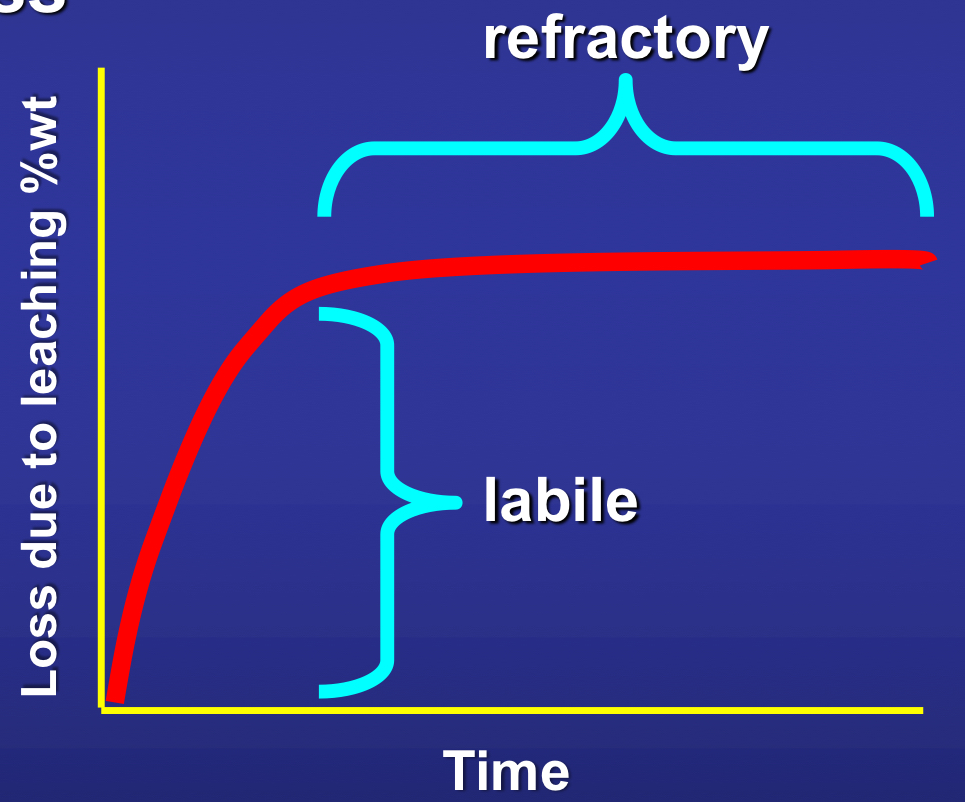
what is labile organic matter?
rapidly degraded
simple molecules (proteins, amino acids, fats, sugar, carbohydrates)
low C:N ratio
small fraction of organic matter
what is refractory organic matter?
slowly degraded
complex molecules (cellulose, lignin, organic acids)
high C:N ratio
large fraction of organic matter
what is an allochthonous source?
carbon fixed OUTSIDE the stream
leaching of DOM, erosion of POM
pulsed inputs (fall and early spring due to falling of leaves and snow/floods)
refractory
fuels respiration
bacteria and fungi colonize leaves
what kind of food chain is associated with an allochthonous source?
detrital food chain - donor control
bottom up effects
increased leaves → increased bacteria/fungi → increased detritivores → increased fish
most macrophytes enter via detrital food web
what is an autochthonous source?
carbon fixed INSIDE the stream
primary production of algae and macrophytes
POM and DOM
importance of light (canopy cover)
pulsed inputs (early spring, late fall)
labile
what is the order of the lability index?
periphyton > macrophytes > herbs vegetation > woody vegetation
what kind of food chain is associated with an autochthonous source?
grazing food chain
top down effects
increased fish → decreased grazers → increased algae
what are the two assumptions of the RCC created by Vannote et al. in 1980?
a gradient of physical conditions exist from headwaters to mouth
organism distribution is determined by organic inputs and processing of organic inputs by upstream organisms
what are the two predictions of the RCC created by Vannote et al. in 1980?
the relative importance of allochthonous, autochthonous, and downstream transport as sources of organic energy
the community composition of heterotrophs based on mechanisms to harvest organic matter
what does the RCC predict the characteristics of a head water to be?
physical: small, forested, low light, cold, low turbidity, low velocity
energy: allochthonous, P/R < 1
biota: shredders and collectors (mostly filter feeders)
fish: fusiform, cold adapted, feed on invertebrates
what does the RCC predict the characteristics of a mid water to be?
physical: intermediate size, open canopy, intermediate light, warmer, intermediate turbidity, intermediate velocity
energy: autochthonous, P/R > 1
biota: grazers and collectors (equal filter and deposit feeders)
fish: laterally compressed, variable temperature adapted, feeds on everything
what does the RCC predict the characteristics of a tail water to be?
physical: large, no canopy, high light, warmest, high turbidity, high velocity
energy: downstream transport, P/R < 1
biota: collectors (mostly deposit feeders)
fish: dorsoventrally compressed, warm adapted, fusiform filter feeding fish
what are the three general patterns predicted by the RCC?
water temperature increases downstream
particle size decreases downstream
ratio of FPOM / CPOM increases from head waters to tail waters
in the carbon budget approach, what form of carbon input dominates in most rivers?
allochthonous inputs
why are desert streams, some springs, slow rivers, and rivers with extensive floodplains exceptions to the idea that allochthonous inputs generally dominate?
desert streams: no surrounding vegetation
some springs: clear water, no particulates, light penetrates all the way down
slow rivers: accumulates organic matter and nutrients, high light and sedimentation settling on the bottom allows for the phytoplankton populations to persist
rivers with extensive floodplains: sediment drops, high nutrients combined with high light
what are the three limitations of the carbon budget approach?
no distinction between labile and refractory organic matter
indicates total input and output of organic matter, but NOT how much is useful
most organic matter transport is highly refractory
what is the general carbon budget percentages?
25% of carbon entering rivers is processed in the system
25% of carbon is stored as sediment
50% is transported to the oceans
what are the two main ways that organic matter can enter the food chain?
organisms (bacteria, fungi)
invertebrates (shredders, gougers)
what are the four stages of CPOM breakdown?
leaf fall / wetting → microbial colonization → invertebrate colonization → conversion to FPOM
what is leaching in CPOM breakdown? how much dry mass is lost in this step?
leaching: all soluble materials dissolve
typically, the first 24 hours
25% dry mass lost
what is mineralization in CPOM breakdown? how much dry mass is lost in this step?
mineralization: bacteria and fungi take dead organic and convert it into living
increases the nitrogen content
about 10 days
50% dry mass lost
what is fragmentation in CPOM breakdown? how much dry mass is lost in this step?
fragmentation: ate by organisms
fully broken down / gone in about 100 to 250 days
25% dry mass lost
how does a leaf pack work?
dry and weigh leaves
incubate
dry, re-weigh, and calculate loss
explain this graph about the decomposition rates of leaves.
early biomass that is lost is the labile components = days
late biomass that is lost is the refractory components = weeks, months
what was the first experiment researchers did on the rate of decomposition by animals versus microbes in leaf packs?
fine mesh exclusion of animals reduced the decay rates
decay rate is also vegetation species specific
thin/wide vegetation breaks down more by microbes
thick/smaller vegetation breaks down more by animals
alternative explanation: the extremely small mesh size blocked the flow of nutrients and oxygen into the system and waste out of the system
what was the second experiment researchers did on the rate of decomposition by animals versus microbes in leaf packs?
insecticide → resulted in the same curve as the first experiment meaning that the mesh bag was not an issue
alternative explanation: small difference in microbial respiration due to the dead insects decomposing and acting as fuel
what are the main primary producers in rivers?
aquatic photosynthetic organisms with chlorophyll or other photosynthetic pigments
what is periphyton?
benthic algae
what is a biofilm made up of?
bacteria, fungi, algae in a polysaccharide matrix
what is the difference between epilithic, episammic, epipelic, and epiphytic?
epilithic: rocks
episammic: sand
epipelic: mud
epiphytic: plants
what are the characteristics of bacillariophyta?
silica, bivalve, protection, binary fission
rapid reproducers (asexual) → cost of genetic diversity BUT good in a constant environment
R-selected
what are the characteristics of chlorophyta?
chlorophyll absorbs red, reflects green
rapid reproducers (sexual)
all energy into growth, none into defense
what are the characteristics of cyanophyta?
fix their own nutrients
gel coat increases surface area and grazing resistance
what are the characteristics of euglenophyta?
part animal, part plant
heterotrophic
mobile with a flagella
what are the characteristics of rhodophtya?
chlorophyll absorbs green, reflects red
deep water or shaded conditions → less competition
green light moves through water further than red light
what is the difference between submerged, floating, and emergent macrophytes?
submerged: all photosynthetic parts are underwater
floating: photosynthetic parts float above water
emergent: rooted in water and penetrate to to the surface, photosynthetic parts can be above or below
what are the three methods to estimate biomass of primary producers? what are the benefits or drawbacks to those approaches?
ash free dry mass (AFDM) (combust it, measures ALL biomass, cheap/fast BUT inaccurate for only primary production)
chlorophyll A (separate pigments based on concentration, more accurate BUT more work and less effective)
cell volume (count every algal cell, high accuracy BUT a ton of work and flow cytometry is expensive)
how can we measure productivity?
gross primary production = total energy fixed per unit time
net primary production = gross primary production - plant respiration
what is the first method to measure primary productivity? what are the two problems with this method?
light and dark chambers → O2 production / O2 consumption
light chamber allow for both photosynthesis and respiration to occur
dark chamber only allows for respiration to occur
problems:
measures community metabolism (underestimate NPP)
reduces flow rate of nutrients which decreases metabolic rates
easy, cost effective, easy labor
what is the second method to measure primary productivity?
uptake and assimilation of radioactive carbon (C14) → rate of CO2 production
assumes uptake of C14 is proportional to uptake of C12
time costly, expensive, labor intensive
what is the third method to measure primary productivity? what group does it work the best for and what group does it not work for?
changes in biomass over time
works for: macrophytes
more biomass = more productivity
more defensive features means they are harder to eat
does not work for: periphyton
constant predation of periphyton means there is no increase in biomass
all energy into growth and not into defenses
how can we measure the primary production of periphyton?
biomass change: rate change in biomass = gain - loss
gains: immigration (initial colonization), growth rate (productivity)
losses: cell death, emigration via sloughing (suffocates under other algae), scouring (abrading algae off substrates), grazing
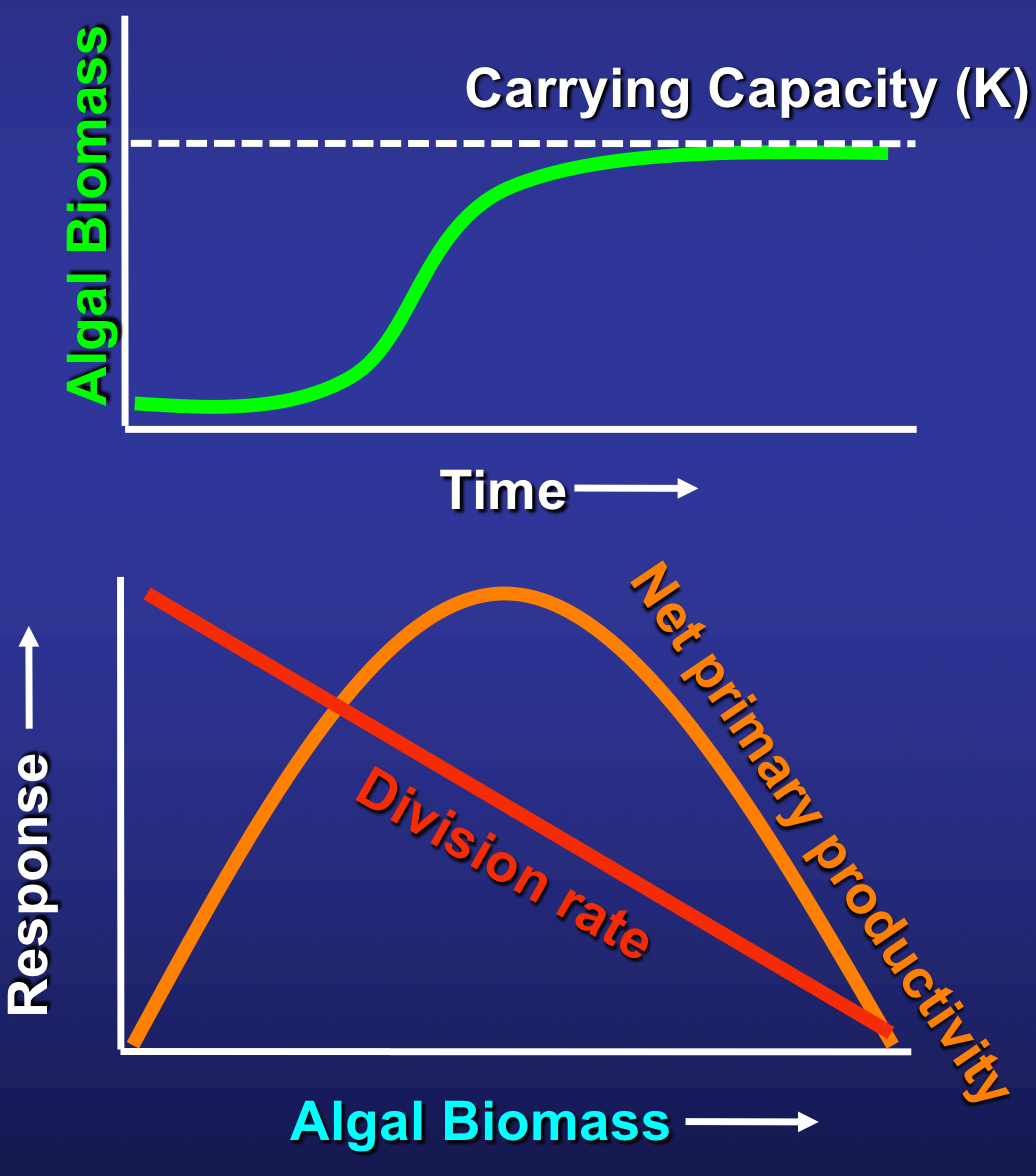
what do these two curves show?
A. logistic growth rate of algae and carrying capacity→ reaches a maximum population based on the amount of resources
B. division rate decreases over time as resources decrease
C. net primary productivity curve as there is initially a TON of resources but at some point those resources become limiting and production drops
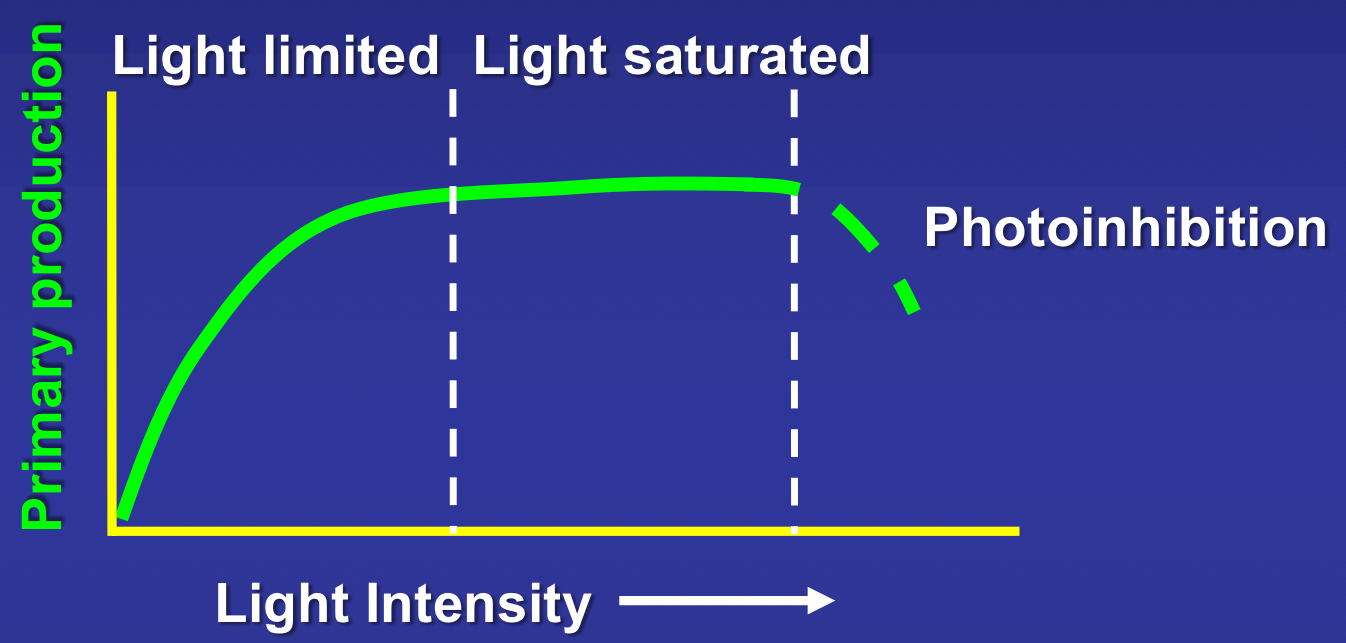
explain this light intensity graph and how it relates to primary productivity.
light limited region: low light meaning it is a critical resource controlling the amount of production
light saturated: algal cells cannot absorb any more light, fully productive
photo inhibition: light is high energy and too much light damages the cell
how do light and nutrients effect algal biomass?
rivers vary in nutrient load (high vs. low) and canopy (open and closed canopy)
what were the results from the Hill and Knight experiment exploring the effects of canopy cover on rivers?
open canopy stream was COVERED → no decrease in biomass
suggested it was nutrient limited as there was normally unlimited amounts of light allowing them to photosynthesize at maximum rates
closed canopy stream had trees CUT → biomass increased
suggested that it was light limited as there was normally plenty of nutrients to photosynthesize but they cannot be used without light
do nutrients limit algal growth? what is the first hypothesis?
if nutrient concentration is low and the delivery rate is high, then it does not affect primary productivity
no nutrient limitation as it is constantly replaced by upstream sources
do nutrients limit algal growth? what is the second hypothesis?
boundary layer may have reduced exchange and delivery rate is dependent on nutrient concentration
most algae at the bottom
not an accurate representation by sampling at the middle/top
nutrient limitation creates a curve that initially increases then plateaus