UNIT 5 APBio Final Exam
1/37
Earn XP
Description and Tags
CB 1-8: 5; 5.1-2, 5.3, 5.4-5, U5 progress check mcq
Name | Mastery | Learn | Test | Matching | Spaced | Call with Kai |
|---|
No analytics yet
Send a link to your students to track their progress
38 Terms
Humans have a diploid number (2n) of 46. Which of the following statements best predicts the consequence if meiosis did not occur during gametogenesis?
A) The gametes would get larger from one generation to the next.
B) The chromosome number would double with each generation.
C) The chromosome number would be halved with each generation.
D) The chromosome number would triple with each generation.
B) The chromosome number would double with each generation.
meiosis: 2n → n (46 to 23), n+n. meiosis doesn’t occur: 2n + 2n
In most vertebrates, the sperm cell normally contributes which of the following to the new organism?
A) Many mitochondria
B) Significant amounts of RNA
C) A haploid complement of chromosomes
D) Most of the cytoplasm of the zygote
E) Two s-x chromosomes
C) A haploid complement of chromosomes
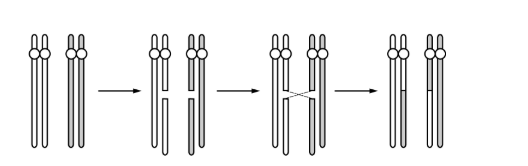
The diagram above illustrates which of the following processes?
A) Crossing-over
B) Base pair substitution
C) Duplication
D) Deletion
E) Posttranscriptional processing
A) Crossing-over
The events listed below generally take place during meiosis.
I. Synapsis occurs.
II. Crossing-over is completed.
III. Condensation of chromosomes begins.
IV. Separation of homologous chromosomes begins.
Which of the following is the correct sequence of these events?
A) I, II, III, IV
B) II, I, III, IV
C) III, I, II, IV
D) III, IV, II, I
E) IV, II, III, I
C) III, I, II, IV
If 2n = 48 for a particular cell, then the chromosome number in each cell after meiosis would be
A) 96
B) 48
C) 24
D) 12
E) 6
C) 24
Which of the following best describes the cells that result from the process of meiosis in mammals?
A) They are diploid.
B) They can be used to repair injuries.
C) They are genetically different from the parent cell.
D) They are genetically identical to all the other cells in the body.
E) They are identical to each other.
C) They are genetically different from the parent cell.
All of the following are true statements about meiosis in mammals EXCEPT:
A) It serves as a factor in bringing about variation among offspring.
B) It follows DNA replication.
C) It occurs only in reproductive structures.
D) It produces cells with the haploid number of chromosomes.
E) It produces four genetically identical gametes.
E) It produces four genetically identical gametes.
DNA replication occurs in S phase
Which of the following occurs during mitosis but not during meiosis I ?
A) The chromosomes are pulled to opposite poles of the spindle apparatus.
B) The chromatids of each chromosome are separated.
C) The nuclear envelope breaks down.
D) Both synapsis and crossing-over take place.
E) The diploid number of chromosomes is reduced to the haploid number.
B) The chromatids of each chromosome are separated.
The process depicted in the image above is best summarized by which of the following descriptions?
A) During the synthesis phase of the cell cycle, DNA molecules replicate to generate identical daughter cells.
B) Centromeres align specific gene sequences of homologous chromosomes during mitotic divisions.
C) The spindle apparatus attaches at chiasma during metaphase of mitosis.
D) During meiosis, crossing over leads to recombination of alleles between homologous chromosomes.
D) During meiosis, crossing over leads to recombination of alleles between homologous chromosomes.
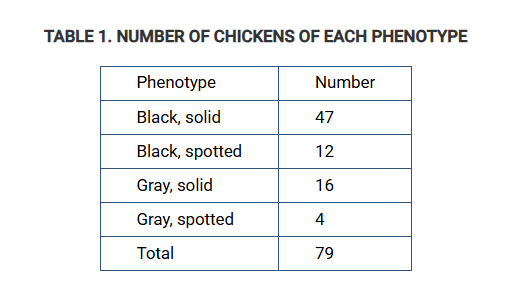
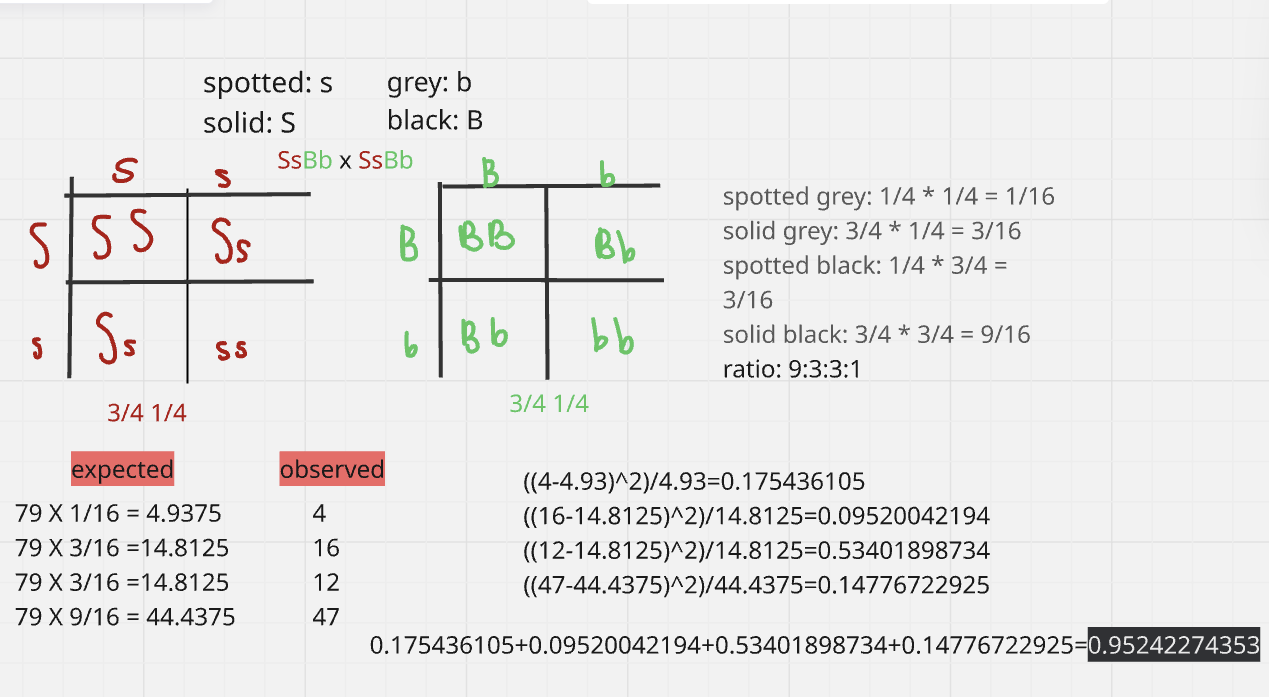
In a certain type of chicken, the allele for gray feathers is recessive to the allele for black feathers, and the allele for a spotted pattern is recessive to the allele for a solid pattern. Chickens that are heterozygous for both traits were crossed and the phenotypes for the offspring were recorded (Table 1).
To determine whether the data are consistent with the expectations for independent assortment, students performed a chi-square analysis.
Which of the following is the closest to the calculated chi-square value for the experiment?
A) -0.26
B) 0.20
C) 0.95
D) 1.25
C) 0.95
In pea seeds, yellow color (Y) is dominant to green color (y), and a round shape (R) is dominant to a wrinkled shape (r). A dihybrid cross between a true-breeding plant with yellow, round seeds (YYRR) and a true-breeding plant with green, wrinkled seeds (yyrr) results in an F1 generation of plants with yellow, round seeds. Crossing two F1 plants produces an F2 generation with approximately nine times as many plants with yellow, round seeds as plants with green, wrinkled seeds.
Which of the following best explains these results?
A)The allele pairs of each parent stay together, resulting in gametes that are identical to the parents.
B) Gene segments on sister chromatids cross over.
C) Alleles that are on nonhomologous chromosomes recombine.
D) The genes for seed color and seed shape assort independently.
D) The genes for seed color and seed shape assort independently.
9:3:3:1 ratio occurs when crossing F1 generations = independent assortment
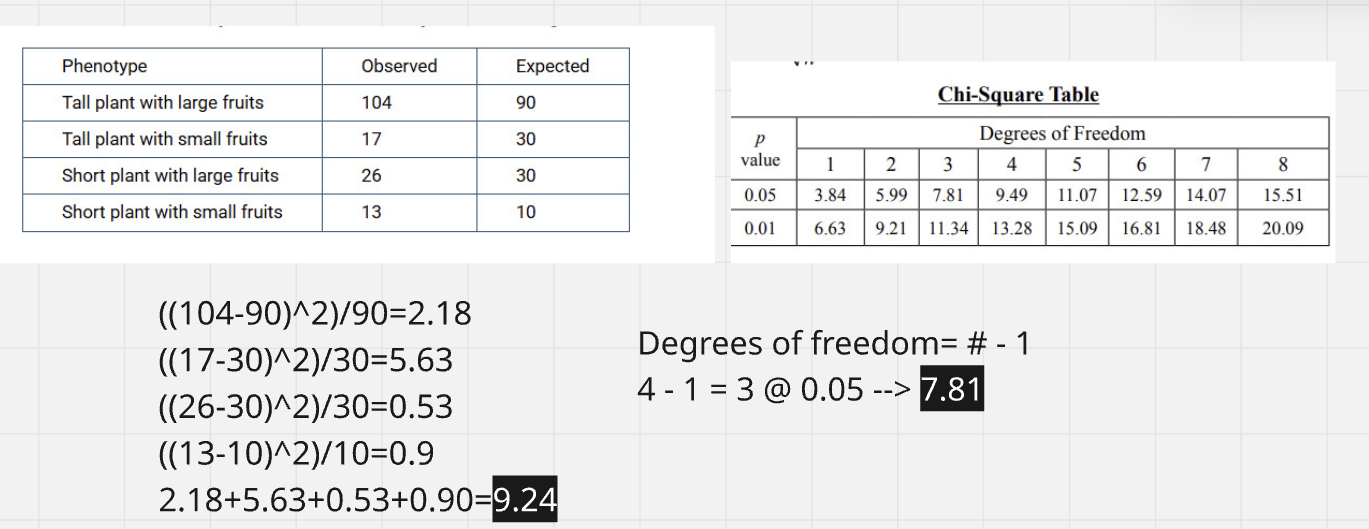
In a strain of tomato plants, short plant height and small fruit size are traits that display autosomal recessive patterns of inheritance. To investigate whether the traits segregate independently, researchers cross a pure-breeding line of tall tomato plants that have large fruits with a pure-breeding line of short tomato plants that have small fruits. The researchers observe that all the plants in the F1 generation are tall and have large fruits. The researchers cross the F1 plants with one another to generate F2 an generation. The researchers record observations for the F2 generation and will use the data to perform a chi-square goodness-of-fit test for a model of independent assortment. The setup for the chi-square goodness-of-fit test is shown in Table 1.
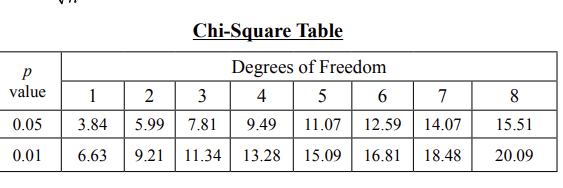
The researchers choose a significance level of p=0.05. Which of the following best completes the chi-square goodness-of-fit test?
A) The calculated chi-square value is 9.24, and the critical value is 7.82. The null hypothesis of independent assortment can be rejected.
B) The calculated chi-square value is 9.24, and the critical value is 9.49. The null hypothesis of independent assortment cannot be rejected.
C) The calculated chi-square value is 13.13, and the critical value is 7.82. The null hypothesis of independent assortment can be rejected.
D) The calculated chi-square value is 13.13, and the critical value is 9.49. The null hypothesis of independent assortment cannot be rejected.
A) The calculated chi-square value is 9.24, and the critical value is 7.82. The null hypothesis of independent assortment can be rejected.
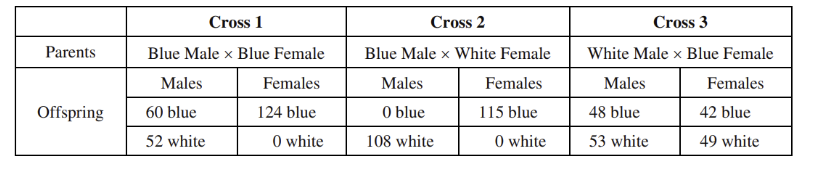
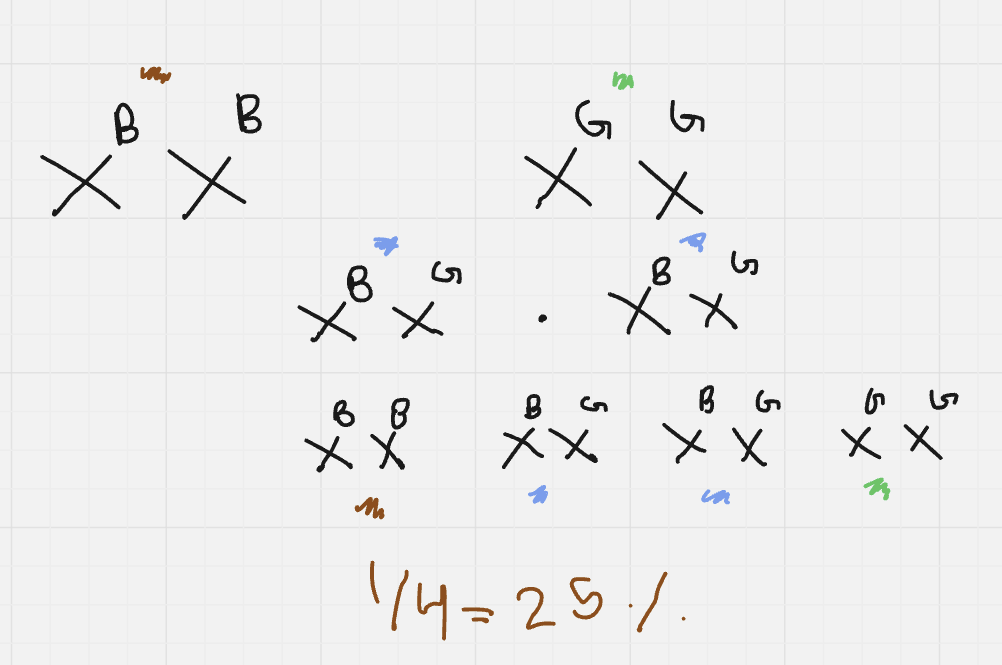
The data above represent the results of three different crosses involving the inheritance of a gene that determines whether a certain organism is blue or white. Which of the following best explains the mechanism of inheritance of the gene?
A) The allele for white is an autosomal dominant allele because a phenotype ratio of blue to white among both sexes is observed in cross 3.
B) The allele for blue is an autosomal dominant allele because an approximate phenotype ratio of blue to white is observed in cross 1.
C) The allele for white is an X-linked dominant allele because no white females are produced in cross 1.
D) The allele for blue is an X-linked dominant allele because there are no blue male offspring in cross 2.
D) The allele for blue is an X-linked dominant allele because there are no blue male offspring in cross 2.
At cross 2, there is an split with all daughters are blue and all sons are white, suggesting X-linked inheritance; C says white is recessive not dominant
Butterflies of the genus Colias live in the Rocky Mountains, where they experience a wide range of temperatures. Different variants of a particular glycolytic enzyme in the flight muscles are optimally active at different temperatures. Within the same population, some individual butterflies fly most effectively at 29°C , while others fly most effectively at 40°C. Still others can be equally active at both temperatures. Which of the following claims is most consistent with the observed butterfly behavior?
A) Butterflies that express two variants of the enzyme are active over a greater range of temperature.
B) Butterflies that are active over a wide range of temperatures produce greater amounts of the enzyme.
C) Temperature has little effect on the activity of butterflies.
D) Butterflies that are active at warmer temperatures produce more offspring.
A) Butterflies that express two variants of the enzyme are active over a greater range of temperature.
"Still others can be equally active at both temperatures”. text never mentions about enzyme quantity or enzyme concentration, so its not B.
In sheep, eye color is controlled by a single gene with two alleles. When a homozygous brown-eyed sheep is crossed with a homozygous green-eyed sheep, blue-eyed offspring are produced. If the blue-eyed sheep are mated with each other, what percent of their offspring will most likely have brown eyes?
A) 0%
B) 25%
C) 50%
D) 75%
B) 25%
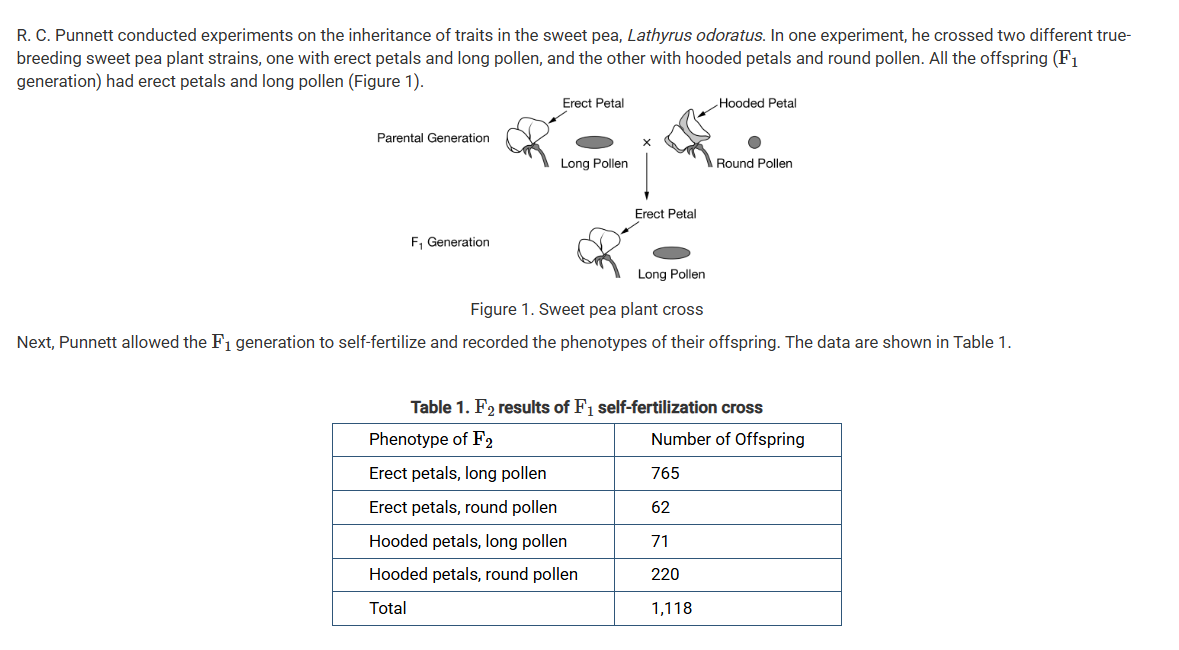
R. C. Punnett conducted experiments on the inheritance of traits in the sweet pea, Lathyrus odoratus. In one experiment, he crossed two different true-breeding sweet pea plant strains, one with erect petals and long pollen, and the other with hooded petals and round pollen. All the offspring ( generation) had erect petals and long pollen (Figure 1).
Next, Punnett allowed the F1 generation to self-fertilize and recorded the phenotypes of their offspring. The data are shown in Table 1.
Sweet pea plants have a diploid (2n) chromosome number of 14. Which of the following best explains how the sweet pea plants in the parental generation produce F1 offspring with 14 chromosomes?
A) Meiosis I and II lead to the formation of cells with 14 chromosomes. When two cells combine during fertilization, extra chromosomes are randomly broken down, leading to offspring with 14 chromosomes.
B) Meiosis I and II lead to the formation of cells with 14 chromosomes. When two cells combine during fertilization, extra chromosomes with recessive traits are broken down, leading to offspring with 14 chromosomes.
C) Meiosis I and II lead to the formation of cells with 7 chromosomes. During meiosis I, homologous chromosomes separate. During meiosis II, sister chromatids separate. Two cells combine during fertilization to produce offspring with 14 chromosomes.
D) Meiosis I and II lead to the formation of cells with 7 chromosomes. During meiosis I, sister chromatids separate. During meiosis II, homologous chromosomes separate. Two cells combine during fertilization to produce offspring with 14 chromosomes.
C) Meiosis I and II lead to the formation of cells with 7 chromosomes. During meiosis I, homologous chromosomes separate. During meiosis II, sister chromatids separate. Two cells combine during fertilization to produce offspring with 14 chromosomes.

R. C. Punnett conducted experiments on the inheritance of traits in the sweet pea, Lathyrus odoratus. In one experiment, he crossed two different true-breeding sweet pea plant strains, one with erect petals and long pollen, and the other with hooded petals and round pollen. All the offspring ( generation) had erect petals and long pollen (Figure 1).
Next, Punnett allowed the F1 generation to self-fertilize and recorded the phenotypes of their offspring. The data are shown in Table 1.
Which of the following questions would be most useful to researchers trying to determine the role of meiosis in the F2 phenotypic frequencies?
A) What is the molecular mechanism underlying the dominance of erect petals and long pollen?
B) Which phenotypes give pea plants the highest level of fitness: erect or hooded petals and long or round pollen?
C) How do the phases of meiosis differ between sweet pea plants and other organisms?
D) What is the recombination frequency between the genes for petal shape and pollen shape?
D) What is the recombination frequency between the genes for petal shape and pollen shape?

R. C. Punnett conducted experiments on the inheritance of traits in the sweet pea, Lathyrus odoratus. In one experiment, he crossed two different true-breeding sweet pea plant strains, one with erect petals and long pollen, and the other with hooded petals and round pollen. All the offspring ( generation) had erect petals and long pollen (Figure 1).
Next, Punnett allowed the F1 generation to self-fertilize and recorded the phenotypes of their offspring. The data are shown in Table 1.
How many degrees of freedom should be used when looking up the critical value for a chi-square analysis of the ratios of phenotypes observed among the offspring versus the expected phenotypic ratio assuming independent assortment?
A) 2
B) 3
C) 4
D) 5
B) 3
4 (phenotype combinations) - 1 = 3
For sexually reproducing diploid parent cells, which of the following statements best explains the production of haploid cells that occurs in meiosis but not in mitosis?
A) Separation of chromatids occurs once, and there is one round of cell division in meiosis.
B) Separation of chromatids occurs twice, and there are two rounds of cell division in mitosis.
C) Separation of chromatids occurs once, and there are two rounds of cell division in meiosis.
D) Separation of chromatids occurs twice, and there is one round of cell division in mitosis.
C) Separation of chromatids occurs once, and there are two rounds of cell division in meiosis.
Which of the following best explains a distinction between metaphase I and metaphase II?
A) The nuclear membrane breaks down during metaphase I but not during metaphase II.
B) Chromosomes align at the equator of the cell during metaphase II but not during metaphase I.
C) The meiotic spindle is needed during metaphase I but not during metaphase II.
D) Homologous pairs of chromosomes are aligned during metaphase I, but individual chromosomes are aligned during metaphase II.
D) Homologous pairs of chromosomes are aligned during metaphase I, but individual chromosomes are aligned during metaphase II.
In anaphase I of meiosis, cohesion between the centromeres of sister chromatids is maintained while homologous chromosomes migrate to opposite poles of the cell along the meiotic spindle as represented in Figure 1.
A compound that prevents the separation of the homologous chromosomes in anaphase I is being studied. Which of the following questions can be best answered during this study?
A) Will the cells produced at the end of meiosis still be genetically identical to each other in the presence of this compound?
B) Will the long-term development of the individual be affected by this meiotic error?
C) When do the centrosomes start to move apart during meiosis I as compared to meiosis II ?
D) Is there a pattern to the movement of homologous chromosomes in the presence of this compound?
D) Is there a pattern to the movement of homologous chromosomes in the presence of this compound?
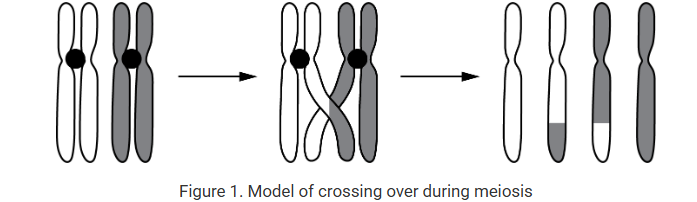
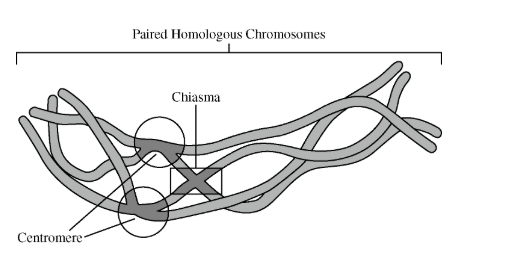
A model of crossing over during gamete formation is shown in Figure 1.
Based on Figure 1, which of the following questions could best be addressed?
A) Does synapsis of homologous chromosomes in the parent cell contribute to an increase in genetic diversity in the daughter cells?
B) Do sister chromatids separate and form diploid daughter cells?
C) Do chromatids from nonhomologous chromosomes rearrange to produce identical daughter cells?
D) Does synapsis of nonhomologous chromosomes produce daughter cells that are identical to the parent cell?
A) Does synapsis of homologous chromosomes in the parent cell contribute to an increase in genetic diversity in the daughter cells?
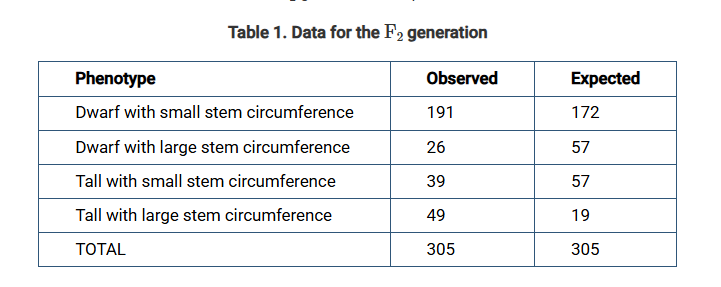
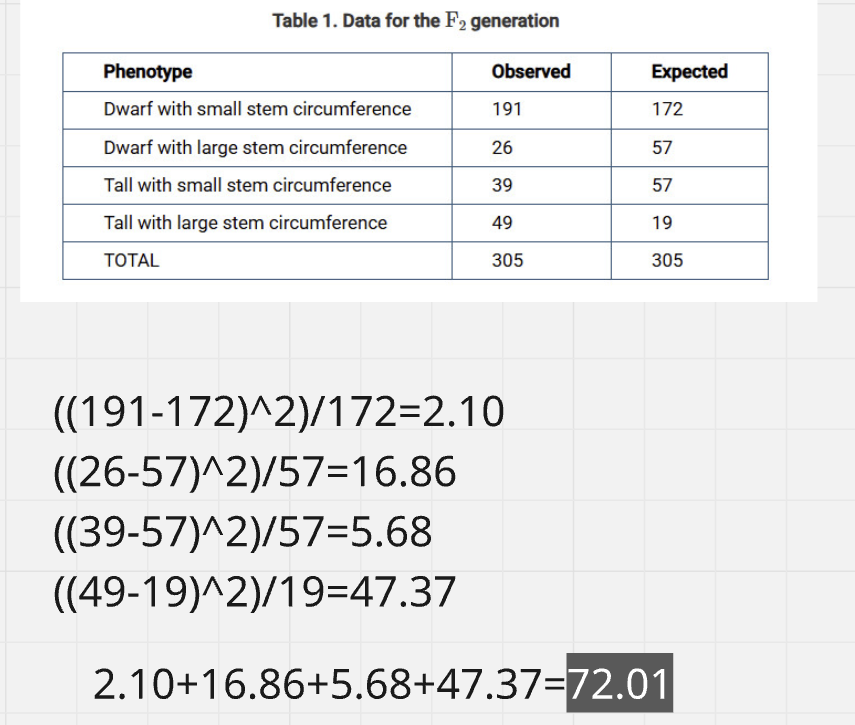
Researchers performed a dihybrid cross with coffee bean plants to investigate whether the inheritance of two traits (height and stem circumference) follows Mendel’s law of independent assortment. The data for the F2 generation are presented in Table 1.
Which of the following is closest to the calculated chi-square value for the data presented in Table 1?
A) 8.35
B) 72.01
C) 98.00
D) 2,546.00
B) 72.01
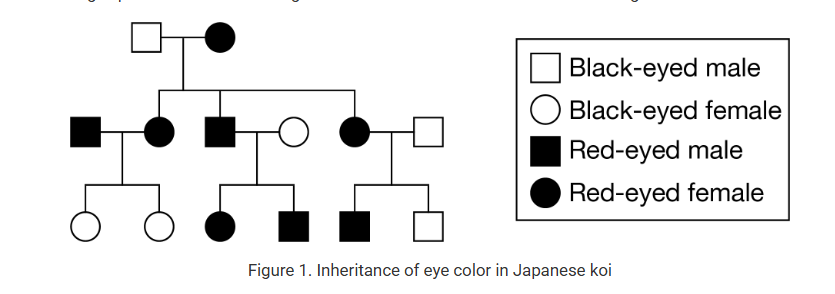
Researchers hypothesized that red eye color in Japanese koi, a type of fish, is due to a mutation. To study the inheritance of red eye color in koi, the researchers conducted breeding experiments over several generations. The results are summarized in Figure 1.
Based on the data in Figure 1, which of the following is the best prediction of the mode of inheritance of red eyes in Japanese koi?
A) The allele for red eyes is inherited in an autosomal dominant pattern.
B) The allele for red eyes is inherited in an autosomal recessive pattern.
C) The allele for red eyes is inherited in an X-linked recessive pattern.
D) The allele for red eyes is inherited in an X-linked dominant pattern.
A) The allele for red eyes is inherited in an autosomal dominant pattern.
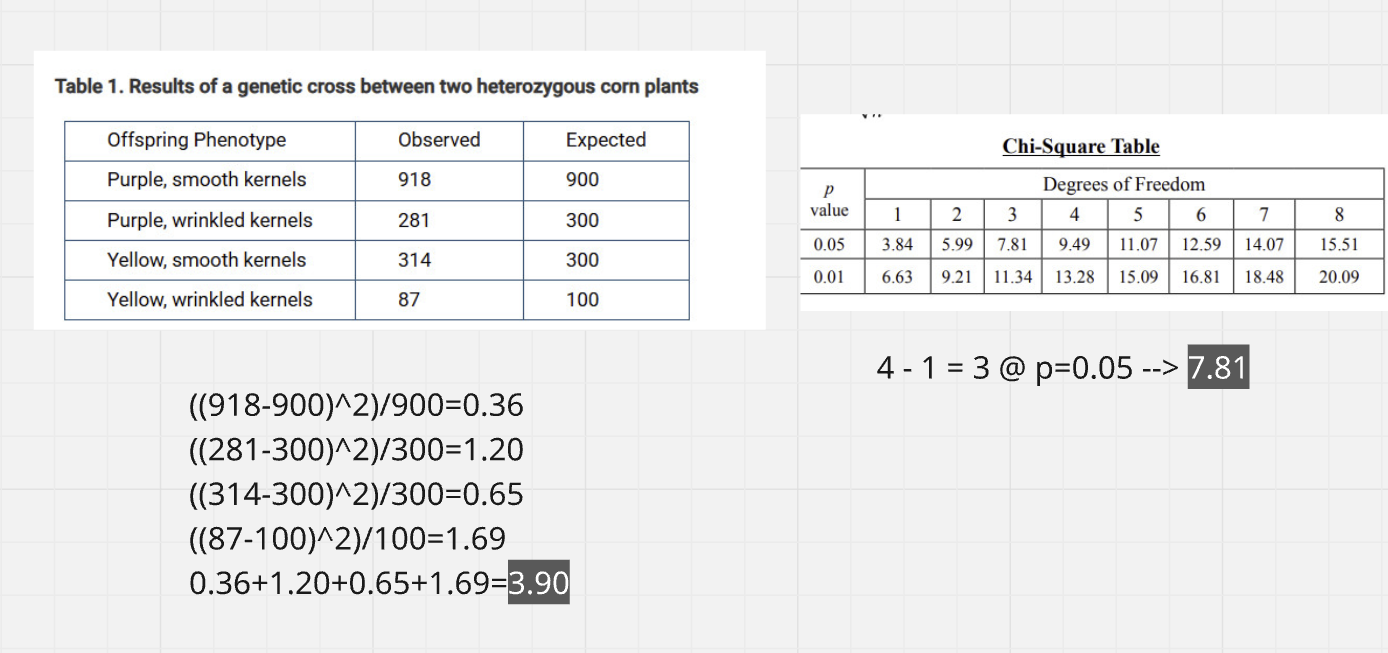
In corn plants, purple kernel color is dominant to yellow kernel color, and smooth kernels are dominant to wrinkled kernels. Researchers carried out a genetics experiment to investigate whether the genes controlling kernel color and kernel texture segregate independently. In their experiment, the researchers crossed two corn plants that were each heterozygous for both kernel color and kernel texture. The results of the experiment are presented in Table 1.
Using a significance level of p=0.05, which of the following statements best completes a chi-square goodness-of-fit test for a model of independent assortment?
A) The calculated chi-square value is 0.66, and the critical value is 0.05. The null hypothesis can be rejected.
B) The calculated chi-square value is 0.66, and the critical value is 3.84. The null hypothesis cannot be rejected.
C) The calculated chi-square value is 3.91, and the critical value is 5.99. The null hypothesis can be rejected.
D) The calculated chi-square value is 3.91, and the critical value is 7.82. The null hypothesis cannot be rejected.
D) The calculated chi-square value is 3.91, and the critical value is 7.82. The null hypothesis cannot be rejected.
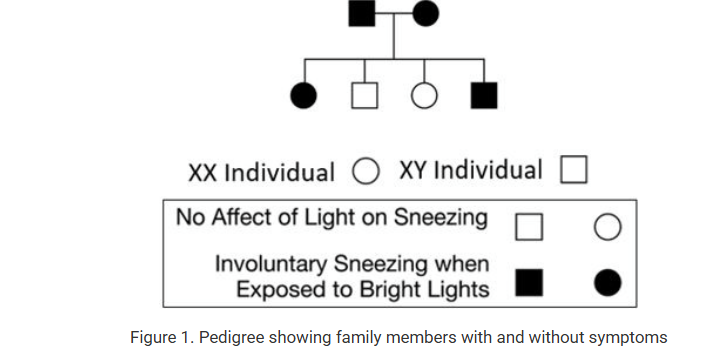
Several members of a family are found to involuntarily sneeze when exposed to bright lights, such as sunlight. Following analysis of the condition in the family, a doctor predicts that the symptoms have an underlying genetic basis. A pedigree of the family is shown in Figure 1.
For this condition, which of the following modes of inheritance is most consistent with the observations?
A) Autosomal dominant
B) Autosomal recessive
C) X-linked dominant
D) X-linked recessive
A) Autosomal dominant
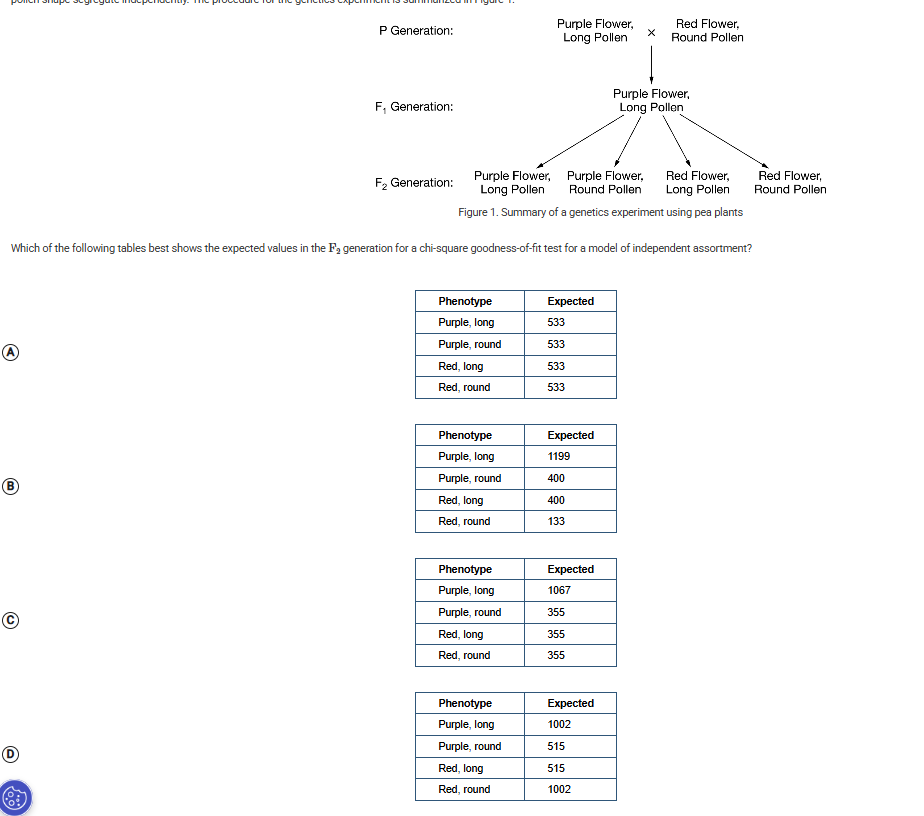
In pea plants, purple flower color is dominant to red flower color and long pollen grains are dominant to round pollen grains. Researchers crossed two pure-breeding lines of the pea plants to investigate whether the genes controlling flower color and pollen shape segregate independently. The procedure for the genetics experiment is summarized in Figure 1.
Which of the following tables best shows the expected values in the F2 generation for a chi-square goodness-of-fit test for a model of independent assortment?
B
9:3:3:1 ratio for heterozygote x heterozygote
In a breeding pair of eukaryotic organisms, no crossing over occurs between chromatids of homologous chromosome pairs during either egg formation or sperm formation. Which of the following best explains the genetic makeup of the offspring produced when eggs are fertilized by sperm in this breeding pair?
A) All offspring will be genetically identical to the parent that has the greatest number of dominant traits.
B) Half of the offspring will be genetically identical to one parent and the other half will be genetically identical to the other parent.
C) All offspring will be genetically different from each other and from the parents.
D) The zygotes from fertilization will not develop into any offspring because of nondisjunction.
C) All offspring will be genetically different from each other and from the parents.
Even without crossing over, there is still independent assortment and random fertilization; creating genetically different offspring.
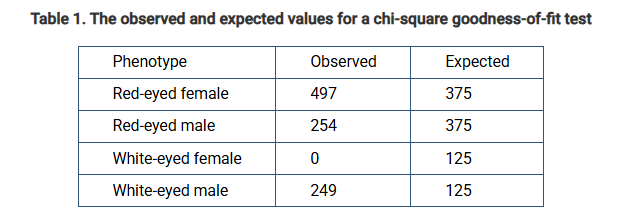
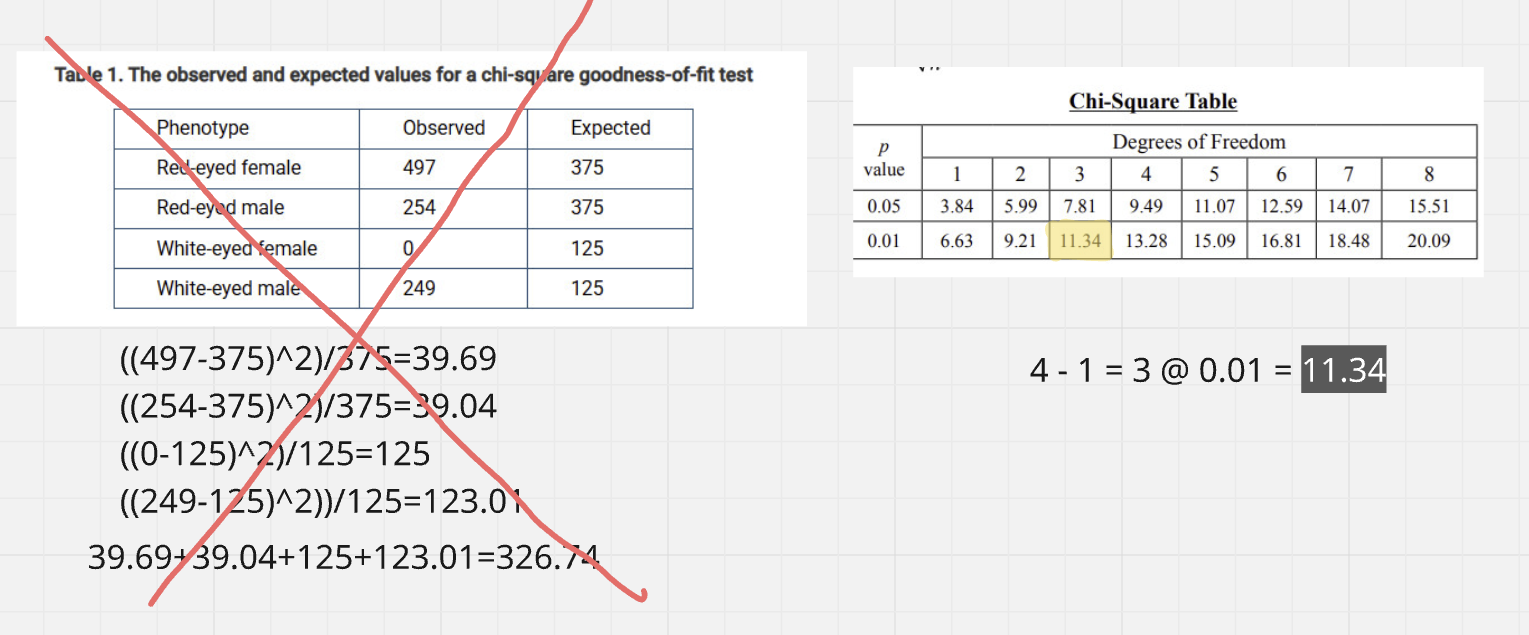
Students carry out a genetics experiment to investigate the inheritance pattern of the white-eye trait in fruit flies. In the experiment, the students cross a red-eyed female with a white-eyed male to produce an F1 generation. The students observe that all the flies in the F1 generation have red eyes. The students then allow the F1 flies to mate and produce an F2 generation. The students will use the F2 data to perform a chi-square goodness-of-fit test based on a null hypothesis of autosomal recessive inheritance. The observed and expected values for the chi-square goodness-of-fit test are shown in Table 1.
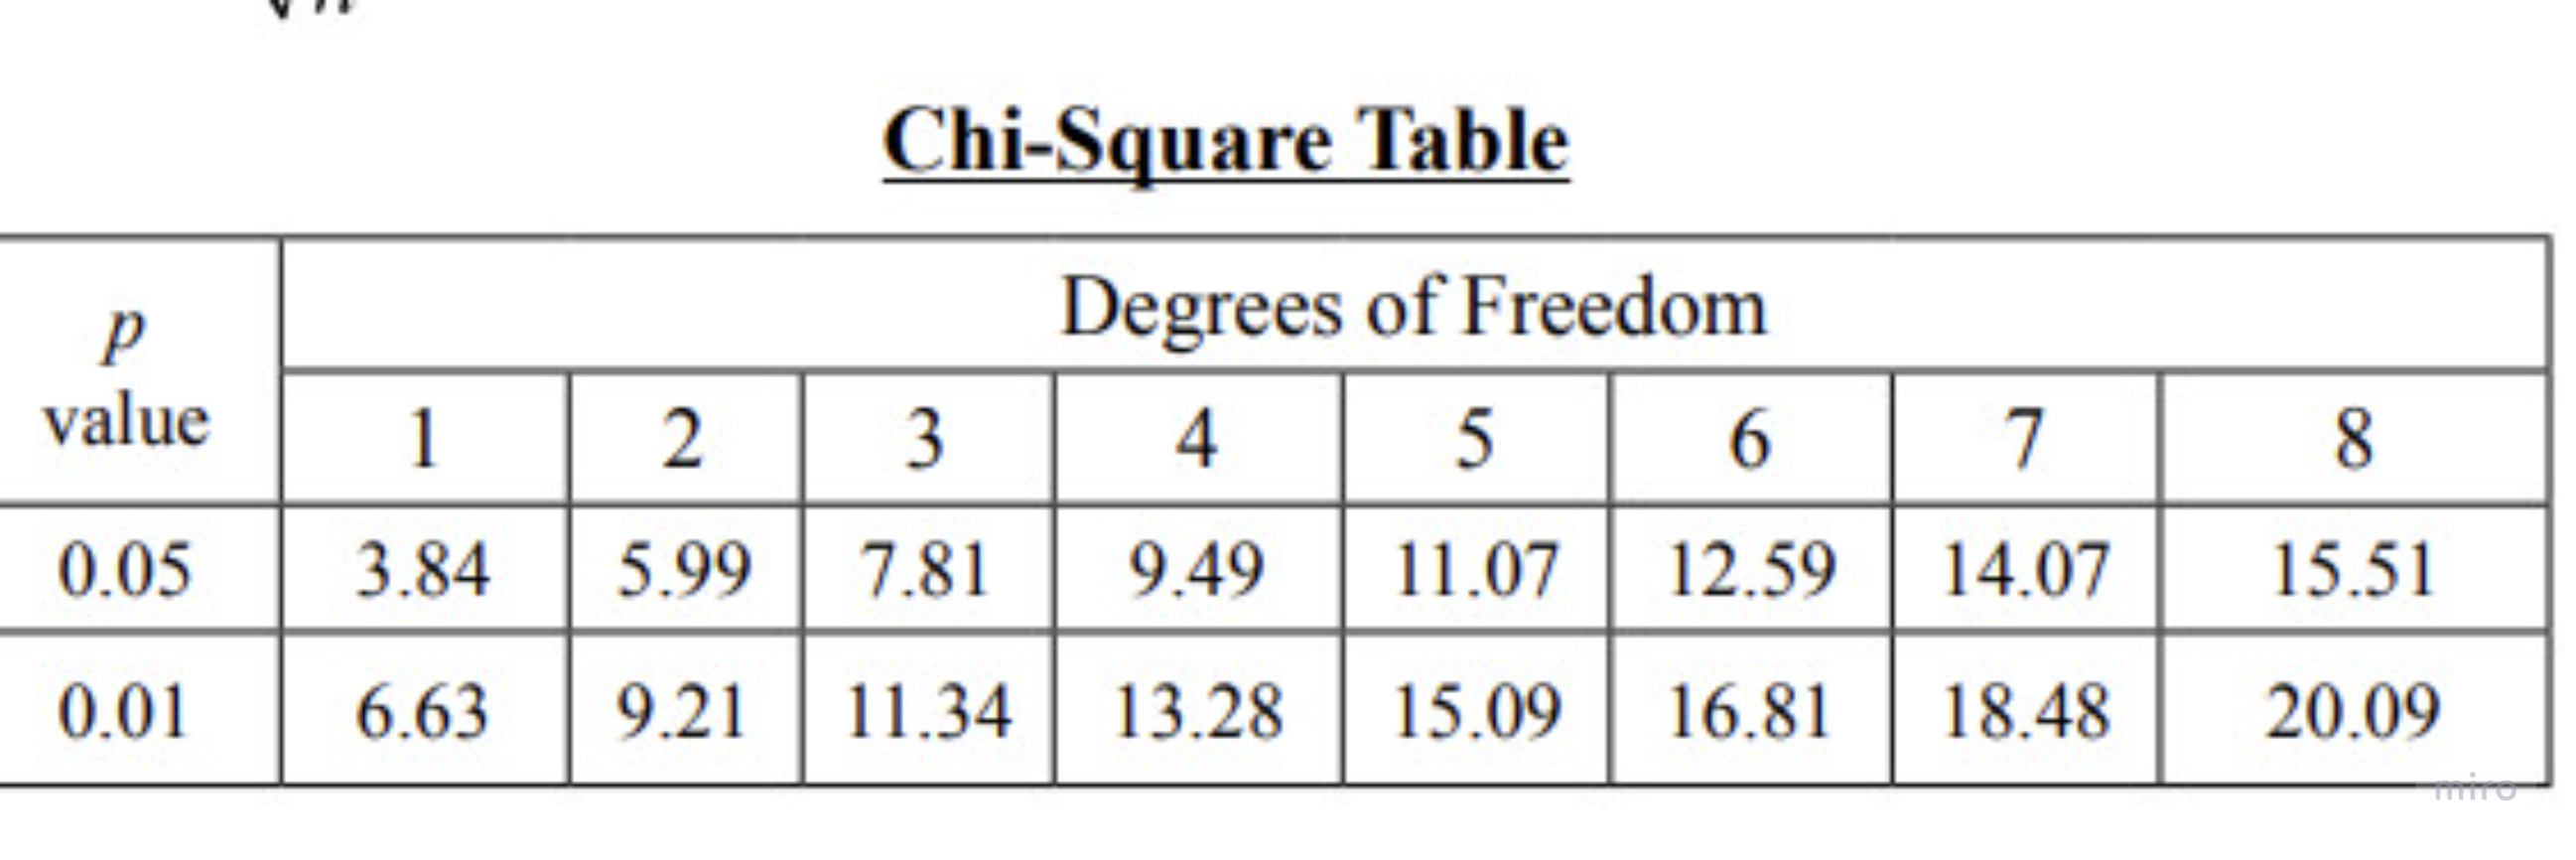
The students plan to use a significance level of p=0.01. Which of the following is the most appropriate critical value for the students to use in their chi-square goodness-of-fit test?
A) 7.82
B) 11.34
C) 13.28
D) 326.7
B) 11.34
Question asked for critical value, not the chi square value
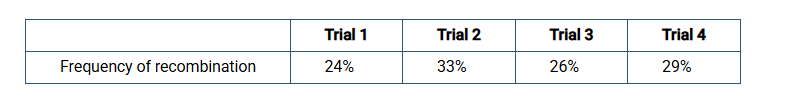
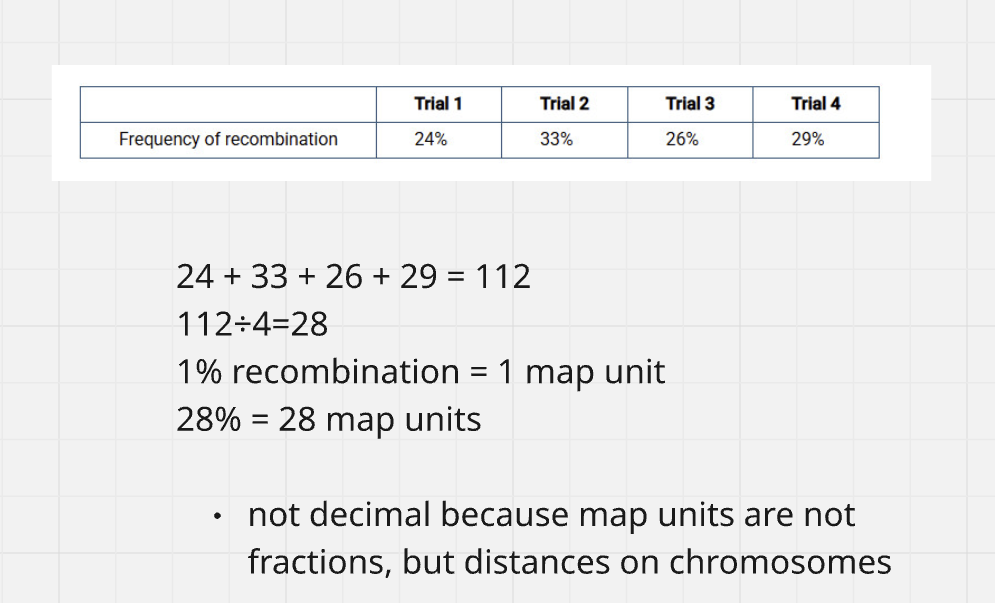
Four trials measuring recombination frequency between gene R and gene L were conducted, and the results are shown in Table 1.
The mean map distance between gene R and gene L is closest to which of the following?
A) 0.28 map units
B) 28 map units
C) 0.14 map units
D) 14 map units
B) 28 map units
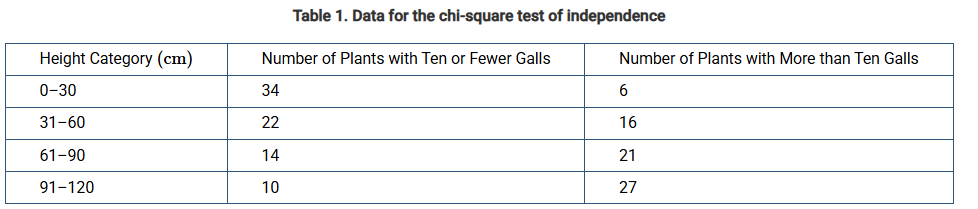
Rubber rabbitbrush plants display heritable variation in plant height and insect-induced gall formation. In a field study, researchers investigated the relationship between plant height and gall number for the rubber rabbitbrush plants in a natural population. The researchers used the data they collected to perform a chi-square test of independence. The null hypothesis for the chi-square test was that plant height and gall number are independent. The data for the chi-square test are presented in Table 1.
The researchers calculated a chi-square value of 29.25. If there are three degrees of freedom and the significance level is p=0.05, which of the following statements best completes the chi-square test?
A) The critical value is 0.05, and the null hypothesis cannot be rejected because the calculated chi-square value is greater than the critical value.
B) The critical value is 0.05, and the null hypothesis can be rejected because the calculated chi-square value is greater than the critical value.
C) The critical value is 7.82, and the null hypothesis cannot be rejected because the calculated chi-square value is greater than the critical value.
D) The critical value is 7.82, and the null hypothesis can be rejected because the calculated chi-square value is greater than the critical value.
D) The critical value is 7.82, and the null hypothesis can be rejected because the calculated chi-square value is greater than the critical value.
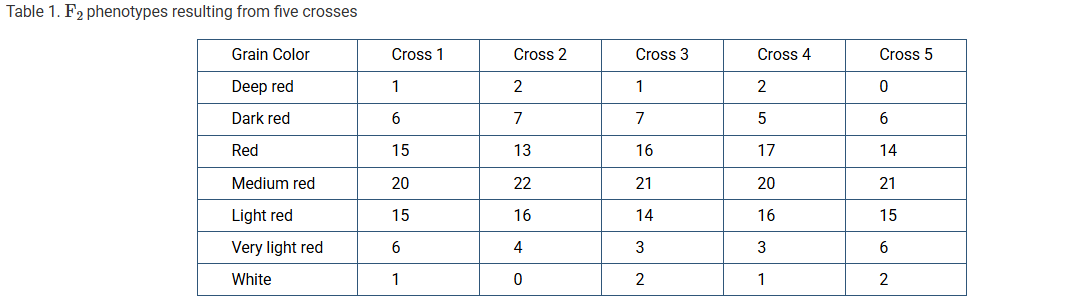
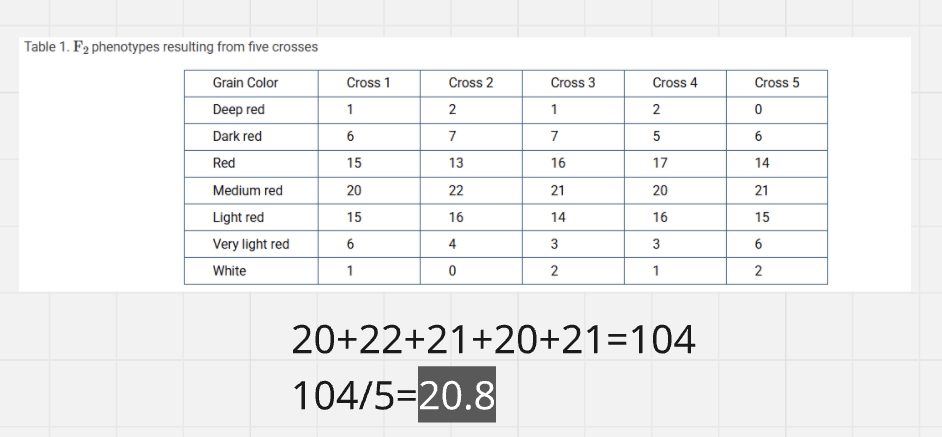
A true-breeding variety of wheat that produces deep-red-colored grain was crossed with a true-breeding variety that produces a white-colored grain. The resulting F1 offspring all had medium-red-colored grain. Five crosses of the F1 plants were all grown under the same conditions and resulted in plants with a variety of grain color, as indicated in Table 1.
Which of the follow indicates the mean number per cross of F2 plants producing medium-red grain and correctly explains the distribution of the phenotypes?
A) The mean number of medium-red phenotypes per cross is 20.8. The distribution of phenotypes suggests that grain color is under environmental control.
B) The mean number of medium-red phenotypes per cross is 20.8. The distribution of phenotypes suggests that multiple genes are involved in grain color determination.
C) The mean number of medium-red phenotypes per cross is 104. The distribution of phenotypes suggests that grain color is under environmental control.
D) The mean number of medium-red phenotypes per cross is 104. The distribution of phenotypes suggests that multiple genes are involved in grain color determination.
B) The mean number of medium-red phenotypes per cross is 20.8. The distribution of phenotypes suggests that multiple genes are involved in grain color determination.
Crosses were under same environmental conditions, so phenotypes would not suggest its under environmental conditions
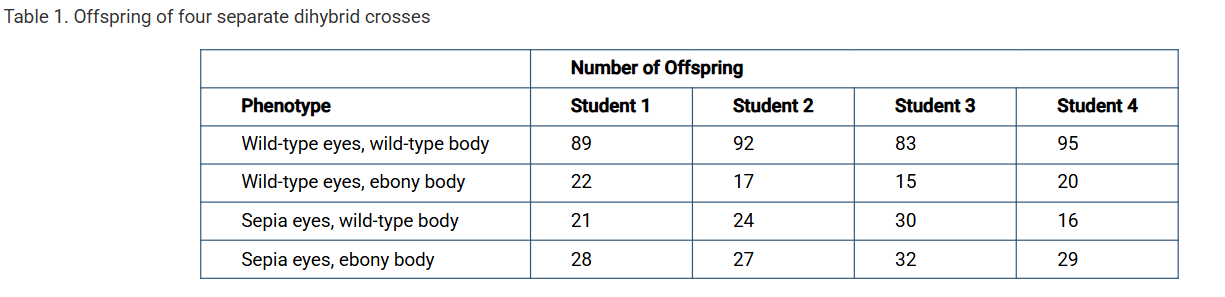
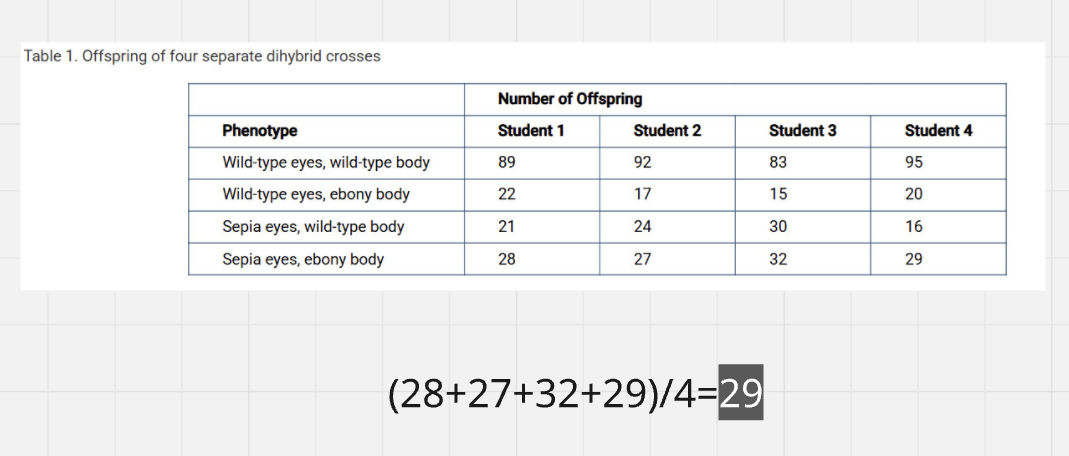
Two fruit fly mutations are ebony body (e) and sepia eyes (s). Four different students performed dihybrid crosses with flies that were heterozygous with a mutant allele and a wild-type allele for both genes (EeSs x EeSs). The results are shown in Table 1.
The mean number of fruit flies per student that are homozygous recessive for both genes is closest to which of the following?
A) 89.75
B) 29.0
C) 22.75
D) 18.5
B) 29.0
sepia and ebony body phenotypes are recessive. Both of them together is homozygous recessive.
Himalayan rabbits are a breed of rabbits with highly variable fur color. If genetically similar rabbits are raised in environments that have different temperature conditions, the rabbits can have different color patterns.
Which of the following statements best explains how the fur color can be different in Himalayan rabbits raised under different temperature conditions?
A) The genotype does not contribute to coat color in Himalayan rabbits.
B) The phenotype determines the genotype of coat color in Himalayan rabbits.
C) Different environments cause specific mutations in the genes controlling pigment production.
D) The environment determines how the genotype is expressed.
D) The environment determines how the genotype is expressed.
environment influences gene activity, leading to a change in phenotype of fur color
The tadpoles of Mexican spadefoot toads are known to exhibit phenotypic plasticity depending on food availability. Tadpole mouthparts can vary significantly, prompting researchers to categorize them as either omnivore-morph or carnivore-morph. Carnivore-morph tadpoles are larger and have mouthparts that are better suited for predation. Remarkably, carnivore-morph tadpoles can change into omnivore-morph tadpoles when the food supply changes.
Which of the following best describes an advantage of the phenotypic plasticity displayed by the tadpoles?
A) It allows the tadpoles to change their genome in response to environmental pressures.
B) It enables the tadpoles to develop into a distinct species of toads.
C) It gives the tadpoles increased versatility with respect to diet.
D) It allows the tadpoles to delay metamorphosis until there is maximal food available for the adults.
C) It gives the tadpoles increased versatility with respect to diet.
More flexible eating strategy.
phenotype plasticity does not change DNA; genome stays the same but only phenotype changes.
When a mustard plant seedling is transferred to an environment with higher levels of carbon dioxide, the new leaves have a lower stomata-to-surface-area ratio than do the seedling’s original leaves.
Which of the following best explains how the leaves from the same plant can have different stomatal densities when exposed to an elevated carbon dioxide level?
A) Increased photosynthesis leads to larger leaves that need more stomata for photosynthesis, leading to an increase in stomatal density.
B) Leaf growth is promoted through increased photosynthesis, but the genetically regulated rate of stomatal production is not altered, leading to a decrease in stomatal density.
C) Leaf growth is inhibited by decreased photosynthesis, and the genetically regulated rate of stomatal production remains the same, leading to an increase in stomatal density.
D) Leaf growth is inhibited by decreased photosynthesis, and the genetically regulated rate of stomatal production remains the same, leading to a decrease in stomatal density.
B) Leaf growth is promoted through increased photosynthesis, but the genetically regulated rate of stomatal production is not altered, leading to a decrease in stomatal density.
elevates carbon dioxide levels increase photosynthesis. The number of stomata produced remains the same as leaves grow larger → decrease in stomatal density
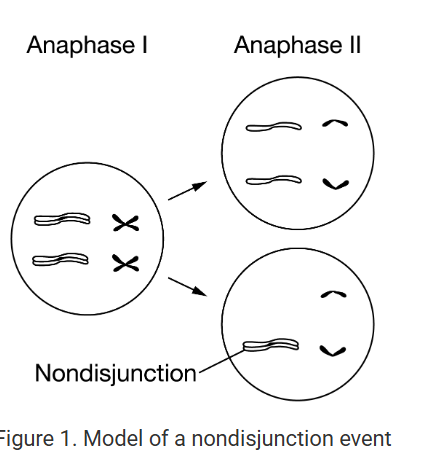
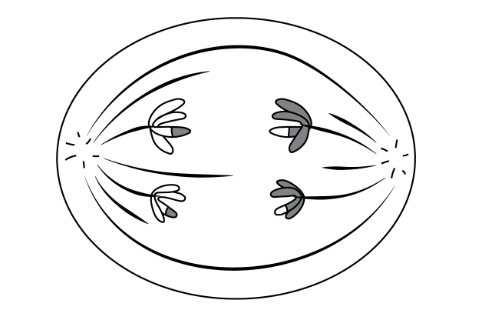
A model showing the cells in anaphase I and anaphase II.
Which of the following best predicts the effect of the chromosomal segregation error shown in Figure 1?
A) All of the resulting gametes will have an extra chromosome.
B) All of the resulting gametes will be missing a chromosome.
C) Half of the resulting gametes will have an extra chromosome and the other half will be missing a chromosome.
D) Half of the resulting gametes will have the correct number of chromosomes, and the other half will have an incorrect number of chromosomes.
D) Half of the resulting gametes will have the correct number of chromosomes, and the other half will have an incorrect number of chromosomes.
four total cell divisions; ½ of them has error, other ½ is correct number
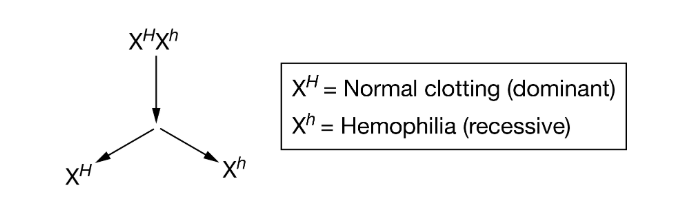
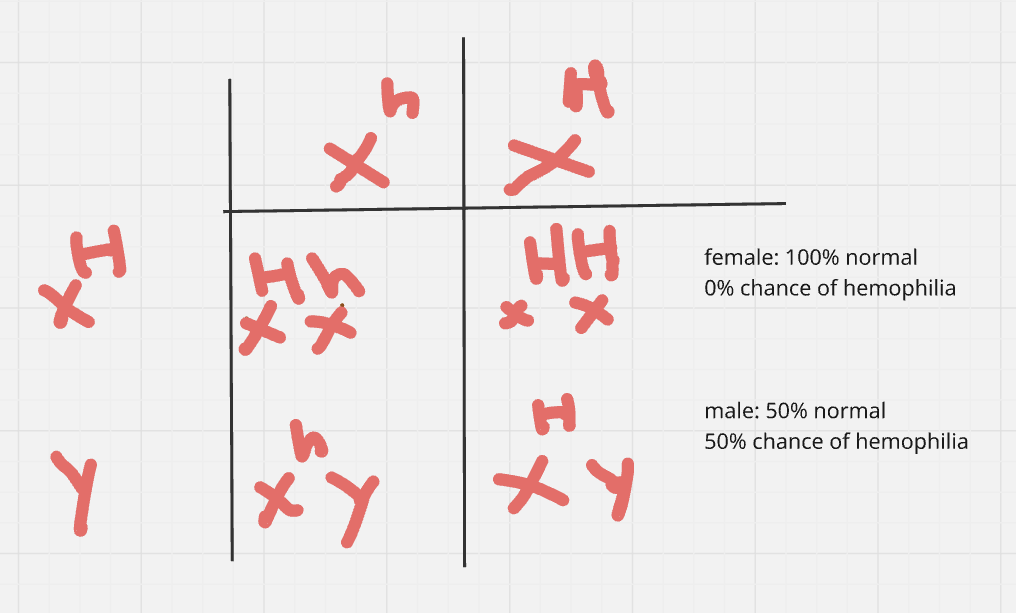
Sex chromosomes determine the phenotype of sex in humans. Embryos containing XX chromosomes develop into females, and embryos containing XY chromosomes develop into males. The sex chromosomes separate during meiosis, going to different gamete cells.
A woman is heterozygous for the X-linked recessive trait of hemophilia A. Her sex chromosomes can be designated as XHXh. During meiosis the chromosomes separate as shown in Figure 1.
If the woman and a man with normal clotting function have children, what is the probability of their children exhibiting hemophilia ?
A) 50 percent for daughters, 0 percent for sons
B) 50 percent for sons, 0 percent for daughters
C) 50 percent for all children
D) 0 percent for all childr
B) 50 percent for sons, 0 percent for daughters