stats exam 3
1/48
There's no tags or description
Looks like no tags are added yet.
Name | Mastery | Learn | Test | Matching | Spaced | Call with Kai |
|---|
No analytics yet
Send a link to your students to track their progress
49 Terms
descriptive stats
taking population data, taking a sample size of n/a cenus → using that to create graphs, table, summaries
focusing on central tendency (mean, median, mode), variability (range, standard deviation, variance), and distribution shape
inferential stats
taking a sample size of n from a population → calc the sample stats → make an inference about a population parameter
characteristics of a good sample
representative of the population and is independent (large sample and random sample)
simple random sample (SRS)
every element in the population is equally likely to be in the sample
how? first, get asampling frame , then choose at random from the list
stratified random sample, why is created and how is it created?
means “layered”
why: to avoid underrepresentation
how: separate population into strata (groups) based of classification criteria ,then sample separately from each stratum proportional to the stratum size
stratified random sample RESULT
higher prescision, no underrepresentation, higher expense
clustered random sample, why? and how?
clustered = groups
why? there is more variability within a cluster than between the clusters
how? randomly select one or more clusters and sample all elements from each
clustered random sample result
less expensive and less precision
what is sample stats used to estimate? where is the sample stat found from?
used to estimate a population parameter that is fixed but unknown
where is the sample stat found from: observed data
list of sample stats
x bar, s, p bar
list of population parameter
mew, signma, p
what are estimators
RANDOM VARIABLES
estimates vs point estimates vs estimators
estimates and point estimates: actual value
estimators: x bar, p bar, s, r, s²
error
any difference between the estimator and the parameter
estimator vs parameter
Estimator: a sample statistic that reflects an average/summary metric for a given population parameter.
Parameter: A particular attribute of a population.
sampling error
error due to taking a sample
the UNAVOIDABLE difference between sample and population controllable =and quantifiable
non-sampling eorror
any other kind of error - leads to BIAS
bias
a systematic difference between the sample and the population
selection bias
sample differs systematically from the population due to sample selection (eg convenicne sampling)
nonresponse bias
not enough response (polling)
response bias
responses are bad (polling)
sample dist
the probability dist for an estimator (a sample stat)
sample mean
x bar
how is the sample mean (x bar) distributed?
normally
what is the mean and Variance for x bar
E(x bar) = mew
var(x bar) = sigma²/n
two formulas for Z-score
ignore the blue:
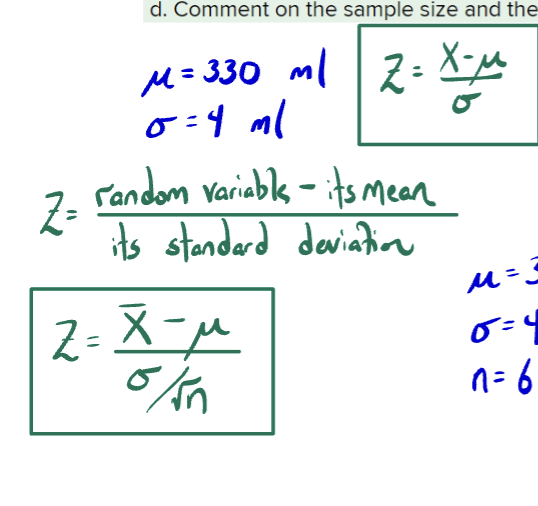
when doing binomial problems for Z-score, what is the p-value in the equation
the p-value the is probability of ANY randomly selected thing gets what the problem is asking. this means to not use the p value you get from a specific sample size/the sample size that x equals in the binomial. so for this example, use the answer you got from a) for part c)
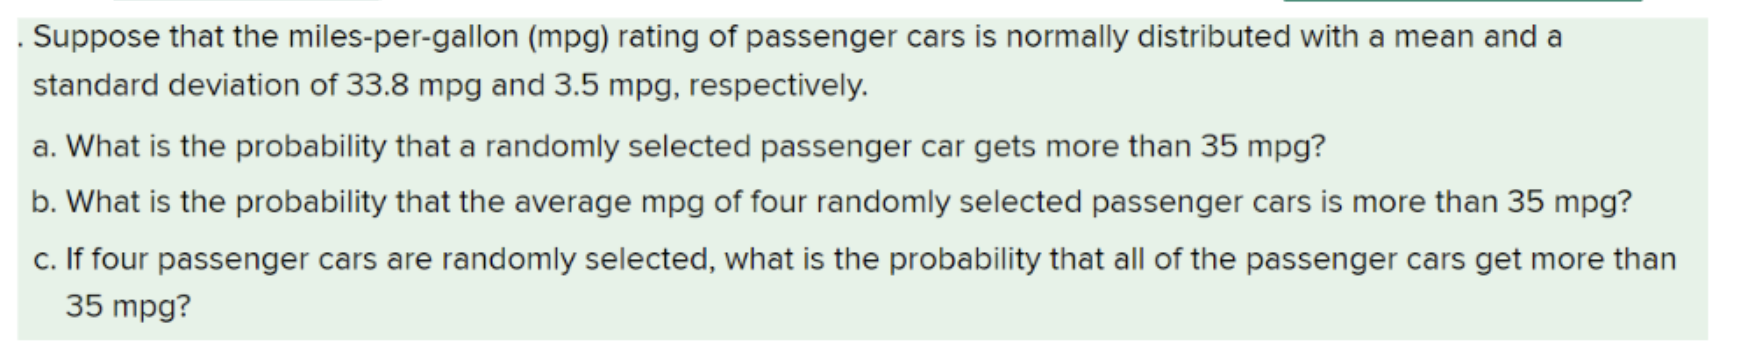
central limit theorem for sample mean (x bar)
x1…xn are a random sample of size a from any population with mean mew and standard deviation sigma, then x bar is approx normally dist if n is greater than 30
how to find sigma
sqrt of var(x)
to find variance, what range do you use in the nuemerator?
the GIVEN range, not the range of the x values you’re trying to find
when do you know to use CLT for sample mean
if you’re trying to find the probability of the sample mean (x-bar) being a certain value, and n is greater than 30
Summary: Sampling distribution of x bar. If X1-Xn are a random smaple from ANY population with mean mew and variance sigma squared, then…
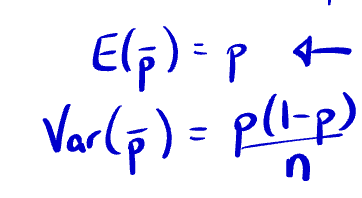
sample proportion
p hat/bar
outcome over interest/total outcomes
what is the sample proportion p bar used for
to estimate p, the POPULATION proportion
what do these mean
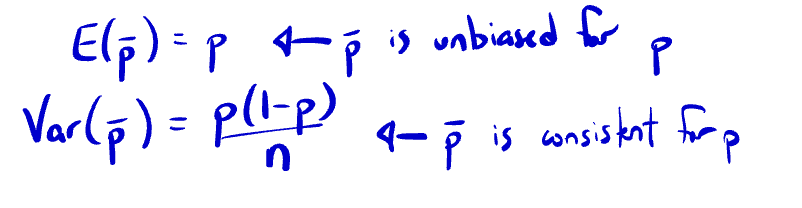
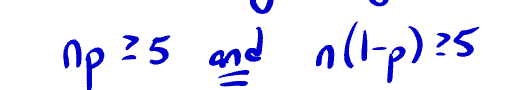
CLT for the sample proportion
the sample proportion is approx normal dist if n is large enough relative to p
CLT for the sample proportion - two things you must check
are there separate z formulas for sample mean and sample proportion
yes! on the formula sheet. you use those when you need to find probability of either a sample mean/proportion being a certain value
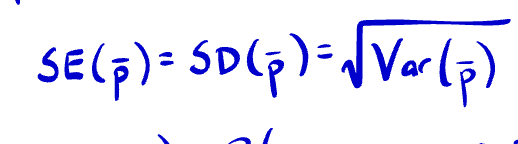
what does standard error equal
standard dev = sqrt of var
CLT for the sample proportion - what do you do after you check the two required things
apply the z-score stuff to find probabilities! same old same old. just make sure to use the z-score formula for p hat on the formula sheet
confidence interval estimate
a range of values that contains the population parameter with a specified level of confidence
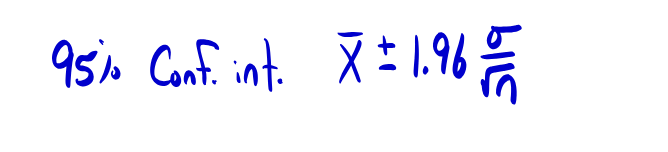
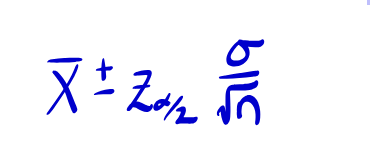
format for confidence interval
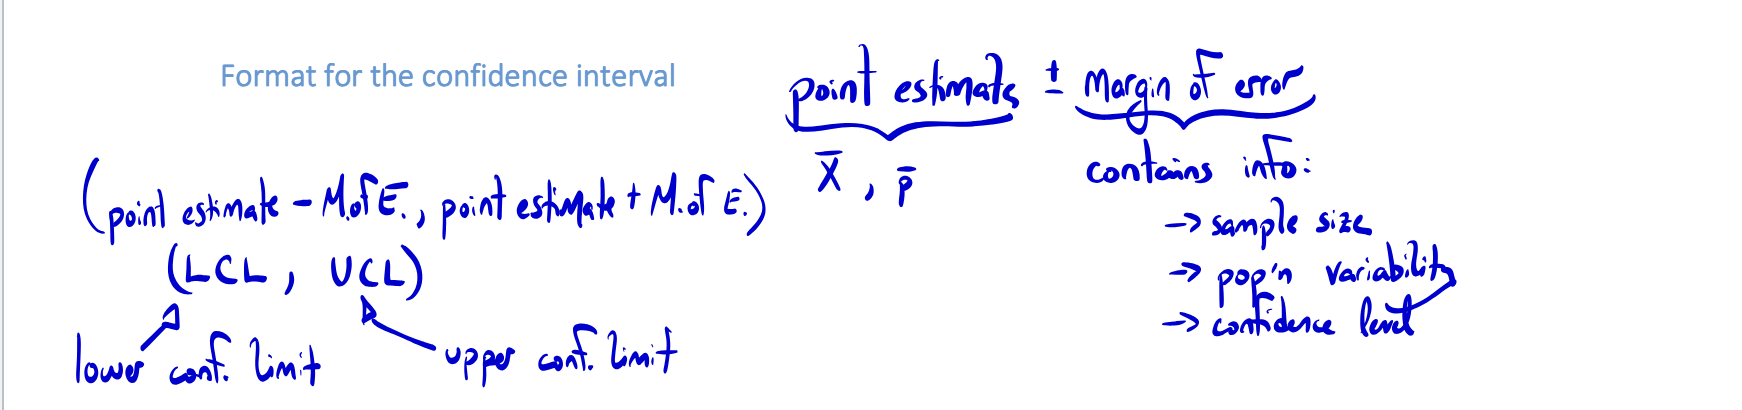
what info does margin of error contain
sample size, population variability, confidence level
what is a 95% confidence interval associated with for its z-score
z=1.96 (plus or minus)
what does alpha show for confidence intervals
the probability of a confidence interval NOT includinhg the population parameter.
what does (1-alpha) show
probability that the interval WILL include a population parameter
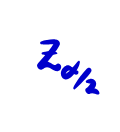
what is this
is the value of a standard normal variable with upper-tail probability alpha/2
notation for upper tail probability (?)
and if you multiple that by 2 you get the width
for upper-tail probability, what happens when sigma goes up? how about n? how about confidence level?
sigma up, width up
n up, width down
conf level up, width up