statistics: 6.1 SIMPLE LINEAR REGRESSION
1/12
There's no tags or description
Looks like no tags are added yet.
Name | Mastery | Learn | Test | Matching | Spaced | Call with Kai |
|---|
No analytics yet
Send a link to your students to track their progress
13 Terms
what is linear regression? 2 pts
its a data analysis technique that predicts the value of unknown data by using another related and known data value; a statistical model of the unknown dependent variable and the known independent variable as a linear equation that allows us to predict the relationship between two or more variables
what is a statistical model? 1 pt
a formal representation of reality expressed using mathematical terms and equations
what is the goal of linear regression? 2 pts
to study the effect of the IV/predictor over the DV/putcome
to predict possible values of the DV/outcome
linear regression vs correlation? 3 pts
when we use correlation we are looking at the relationship between two variables
when we use regression we are trying to predict one variable using the other one
the distinction beyween IV/predictor and DV/outcome is key
variables of a linear regression? 3 pts
a DV that is a scale variable (interval/ratio)
an IV that can be a scale, nominal, or ordinal variable
predictors/IV can be any type while outcomes/DV have to be scale variables
what is a regression line? 1 pt
the straight line that goes through the middle of the data in a scatterplot
regression line: important notes?
we should only talk about how the outcome (DV) changes when the predictor (IV) changes according to the regression line that we fit to the data
we cannot say for sure that outcome changes because the predictor changes as there could be confounders that are unaccounted for
linear regression line represents an equation/model that is never perfect
the best regression line is the one that minimizes the amount of error in the prediction by using the values of the slope and intercept that minimize total amount of error
slope vs intercept? 2 pts
intercept- the location where the line intersects the y-axis
slope- the steepness of the line
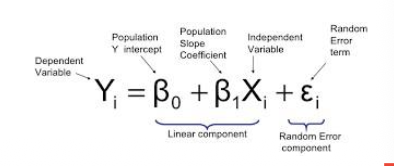
regression line formula? 5 pts
y = a + b + x X + error
y→ dependent variable/outcome
x→ independent vairable/predictor
a→ intercept (predicted when the value of X is 0)
b→ slope or regression coefficient
the slope? 3 pts
the slope/regression coefficient represent the inclincation of the line
it represents the amount of change in the outcome due to a change of 1 unit in the predictor
if it is a positive number the relationship is positive, if it is a negative number the relationship is negative
the intercept? 2 pts
the intercept represents the point where the line cuts the vertical axis
it is the value predicted for someone who scores a zero in the independent variable
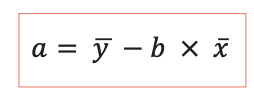
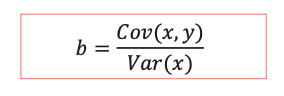
how do we calculate the regression line? 3 pts
we need to calculate the slope/regression coefficient and the intercept
once we have tthese values we can add the predictor (x) and outcome (y) to the formula
we can obtain the outcome
assumption checks for simple linear regression? 6 pts
the DV is measured at the continous level (interval or ratio)
the IV is measured at the continous level (interval or ratio) but can also be nominal or ordinal
there is a linear relationship between x and y that can be evaluated using a scatterplot
there should be no significant outliers as they can reduce the predictive accuracy of the results
homoscedasticity- where the variances alone the line of best fit remain similar as you move along
residual errors of the regression line are approximately normally distributed which can be confirmed by looking at the distribution of residuals