Psycstat exam #1
1/54
There's no tags or description
Looks like no tags are added yet.
Name | Mastery | Learn | Test | Matching | Spaced | Call with Kai | Chat |
|---|
No analytics yet
Send a link to your students to track their progress
55 Terms
population vs. sample
population: entire group of individuals
sample: individuals selected to represent population
parameter
describes population
statistic
describes sample
discrete variables
invariable categories
ex: dice roll
continuous variable
infinitely divisible
ex: time or weight
nominal scale
unordered set of categories, identified by name only
ex: I like hamburger. I like milkshake.
ordinal scale
ordered set of categories
ranking but no amount of diff between ranks
direction of diff between two individuals
ex: race - 1st, 2nd, 3rd
interval scale
ordered series of equal-sized categories
direction & magnitude of difference
zero point located arbitrarily - doesn’t mean lack of _, just means 0 recorded/measured - meangingless
ex: race w/ time and distance, IQ test, temp
ratio scale
interval scale w/ true zero meaning nothingness
direction & magnitude of diff, ratio comparisons of measurements
ex: books read this year, height (can be 0)
correlational study
doesn’t provide explanation for relationship
one group w/ 2 variables measured for each individual
experimental study
1 variable manipulated while another observed
cause & effect - identify causation
individual relationship
always has IV & DV
nonexperimental study
no variable manipulated or random assignment
unclear IV & has DV
N
# of scores in population
n
# of scores in sample
frequency table
2 columns
x column: values within range of scores
f score: # of times x score appears
purpose: organize & simplify dataset
grouped frequency distribution table
lists groups of scores
intervals have the same width
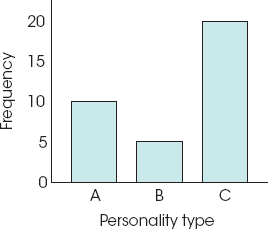
bar graph
nominal or ordinal scale
gaps between bars
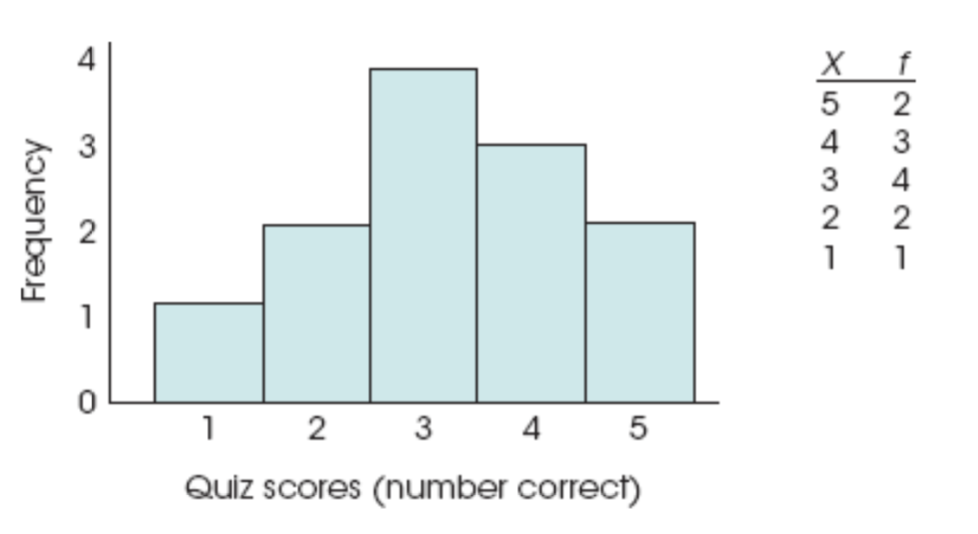
histogram
interval or ratio
height corresponds to frequency
continuous variables
no gaps between bars
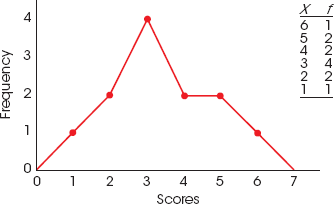
polygon
interval or ratio
continous line draw from dot to dot
line from x-axis (zero freq)
stem and leaf displays
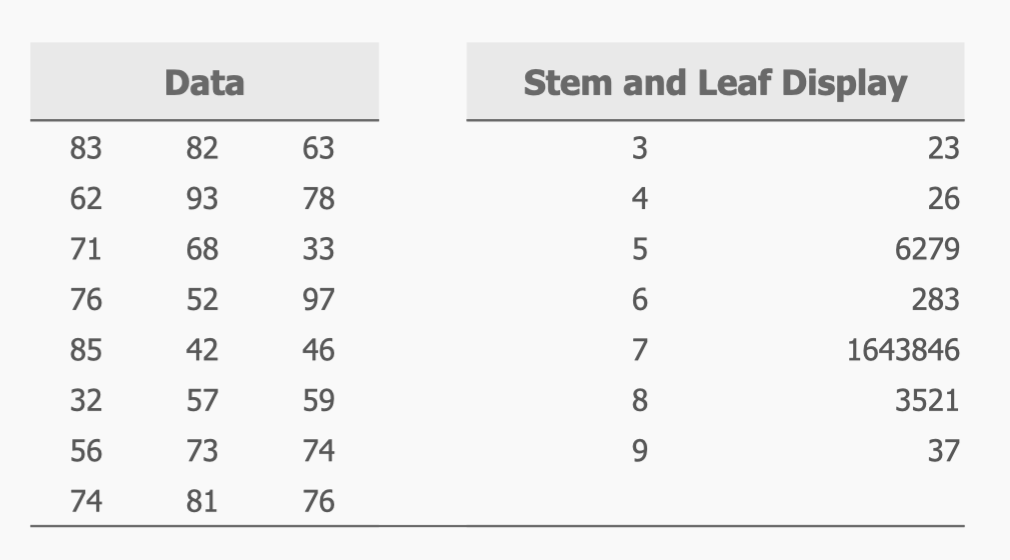
stems - first digits
leaves - last digits
proportion (p)
p = f/n
Normal Curve (AKA Normal Distribution)
symmetrical, greatest freq in center, decrease away from center
multidetermined
ex: IQ scores
central tendency
uses single value to describe center of distribution
can compare 2 or more sets of data by comparing means
descriptive stats
describe set of data in simple, concise form
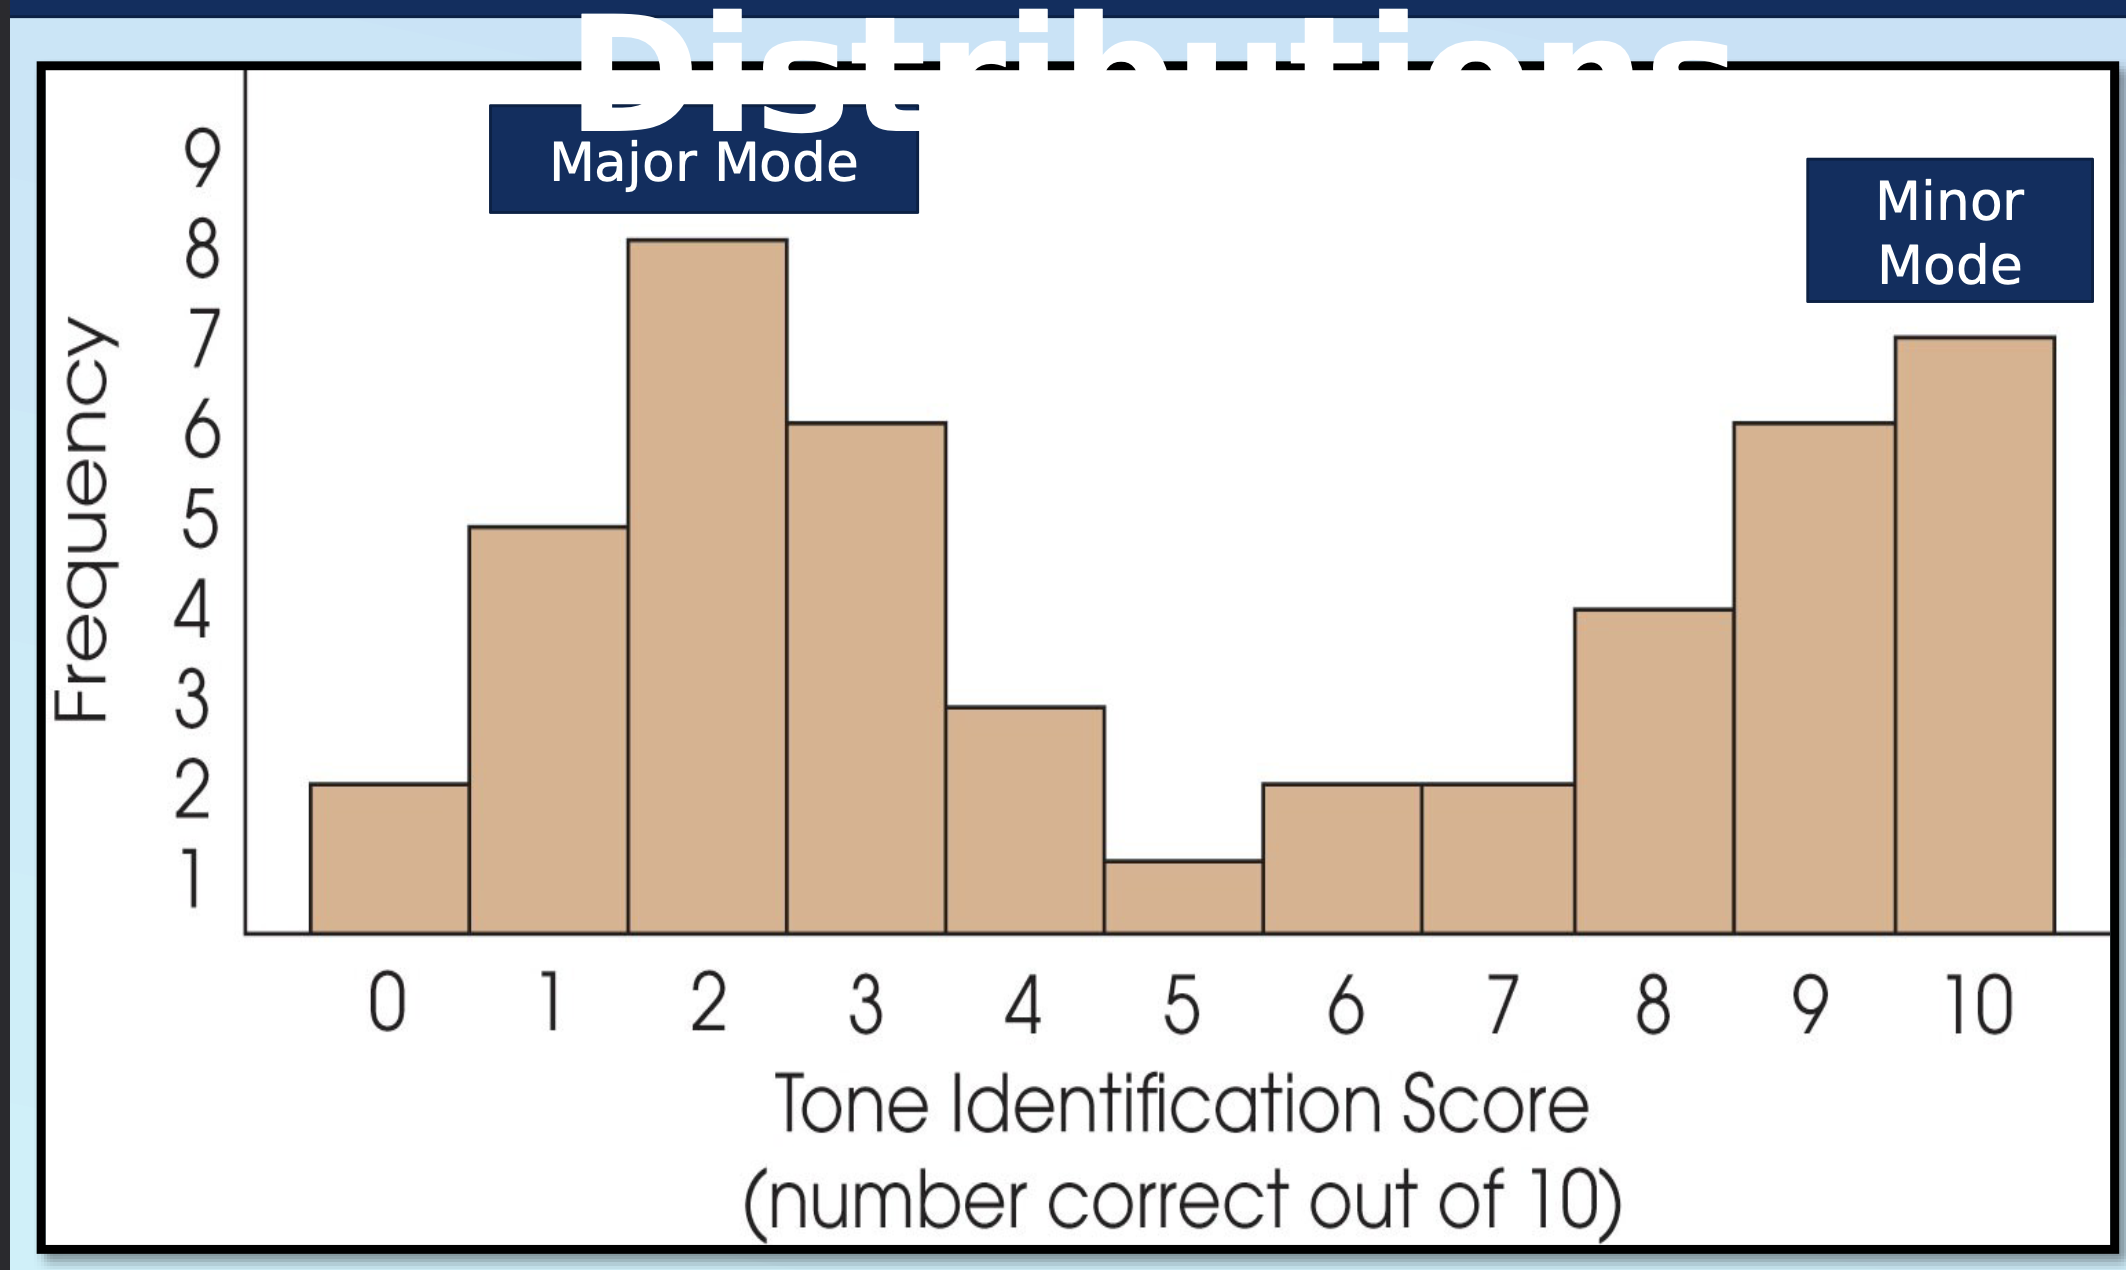
mode
most frequently occurring score or class interval, high point
nominal, ordinal, interval, or ratio
bimodal, multimodal
major mode
highest peak

minor mode
secondary peak
median
midpoint
splits dataset in half - below/above
list in order first
relatively unaffected by extreme scores

mean
population: μ = ΣX/N
sample: M = ΣX/n
balance point of distribution
change value of any score, discard or add new scores change value of mean

when mean not representative
few extreme scores
very skewed
nominal - no numerical meaning, order, scale
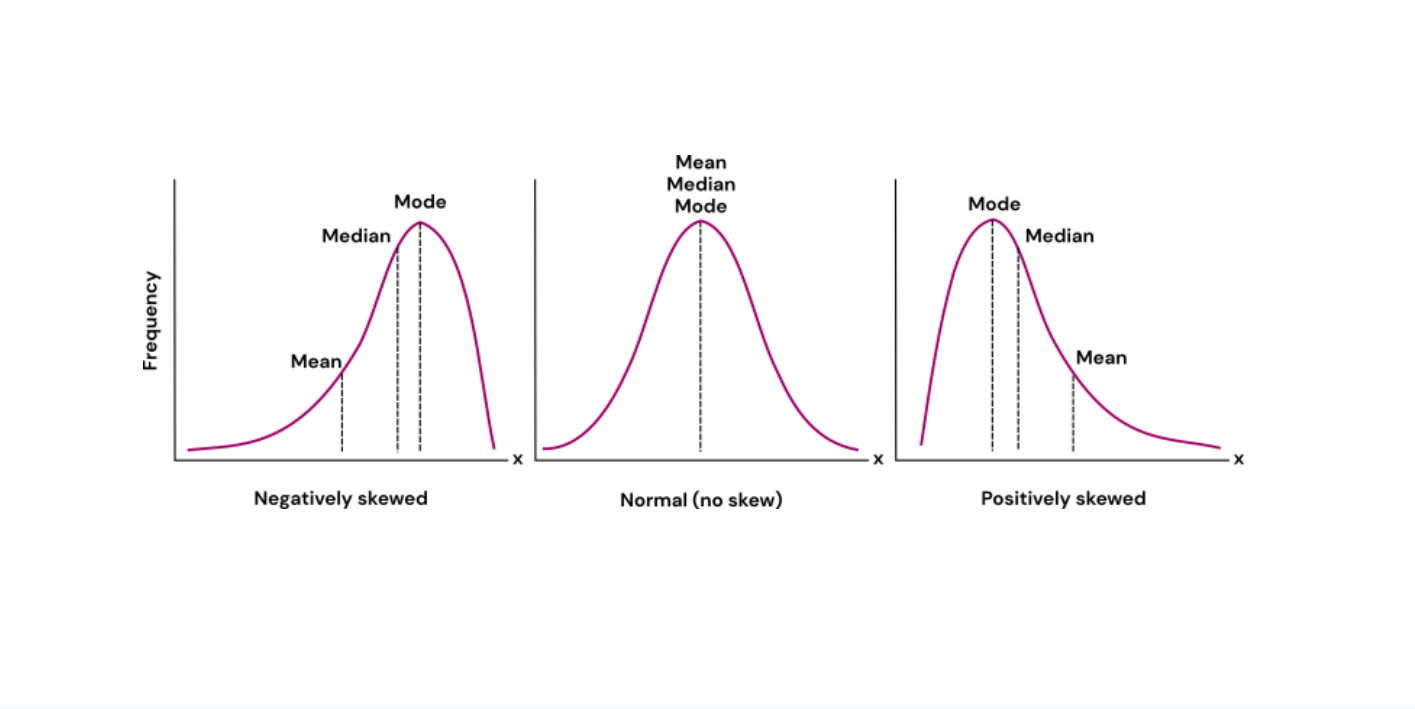
symmetrical distribution relationship
symmetrical distribution - mean = median
symmetrical distribution w/ 1 mode - mode = mean = median
shapes of distributions
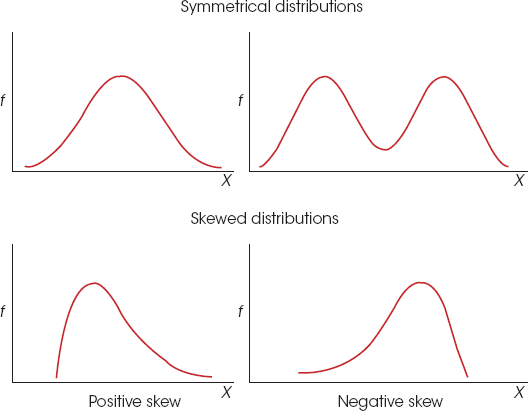
positive skew
scores pule up on left side
negative skew
scores pile up on right side
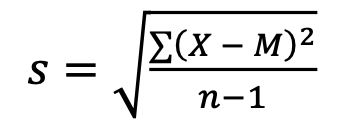
S sample standard deviation
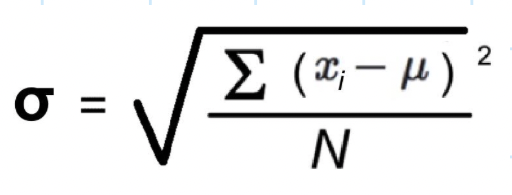
σ population standard deviation
SS (sum of squares)
SS = ∑(X - M)2
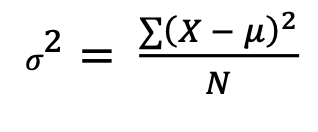
𝜎²
pop. variance
why divide by df for sample SD (s)
inflate estimate of variance so its more accurate
df = n-1
Range (v1)
highest score - lowest
Range (v2)
lowest & highest score
why range is imprecise & unreliable
not all scores represented
most common measure of variability
standard deviation
standard deviation approximates
“avg’ distance from means for scores in dataset
each score multiplied/divided by constant
SD will also be multiplied/divided by same constant
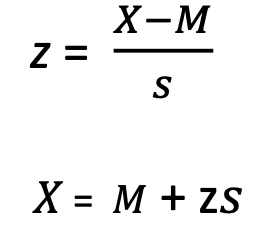
z-score
how far away a point is from mean as a proportion
expresses data in terms of mean and SD
advantage of z-scores to compare populations
standardizes → compare distributions w/ diff. scales
0 z-score indicates
equal to mean
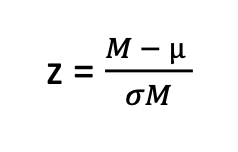
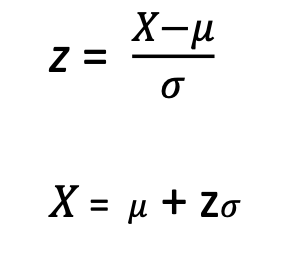
z-score for population
X = score from dataset
μ = pop. mean
σ = pop. SD
z-score for sample
X= score from dataset
M = sample mean
S = sample SD
descriptive z-score
describes exactly where each individual score’s located
inferential z-score
determines whether specific score is representative
above or below 2 → extreme/unrepresenative
z-score & SD
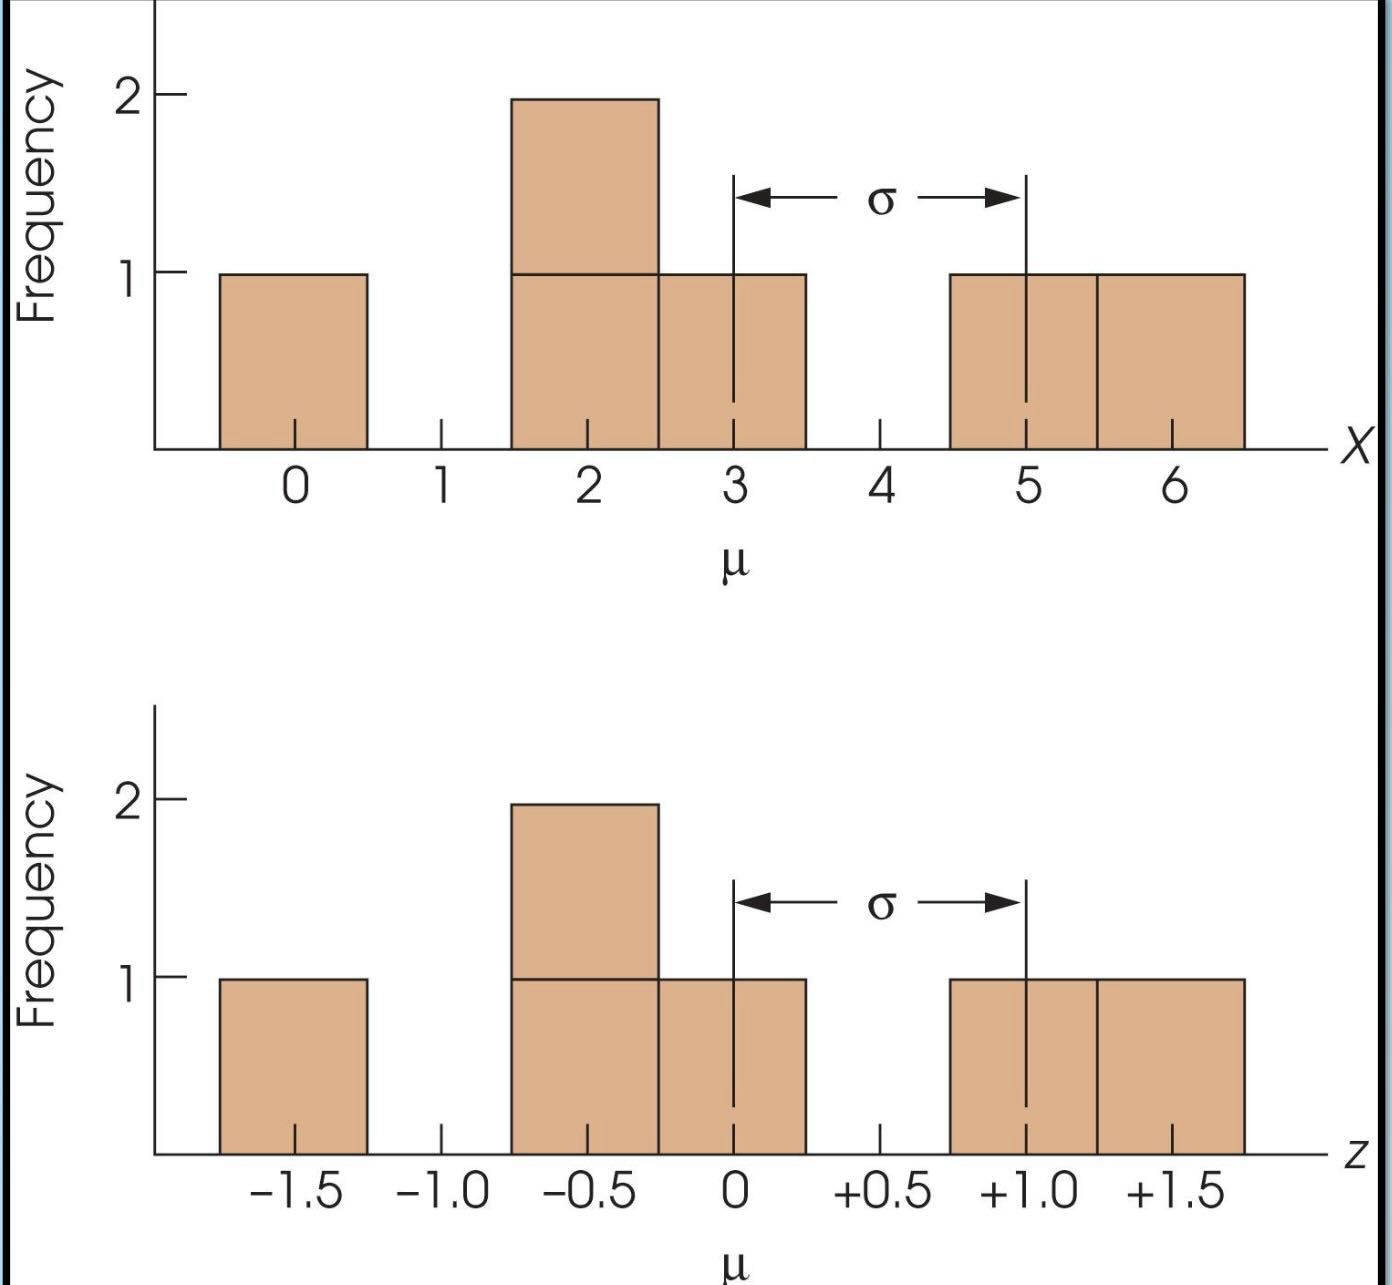
doesn’t change shape of distribution or location of any scores
only scale changes
smooth curve
smooth lines - emphasize overall patterns in ideal pop. distribution
hypothesis test (z-score)
1) state hyp.
H0: μtreatmen t= μknown
H1: μtreatment ≠ μknown
3) calculate z-score
calculate std. error of mean (σM)
calculate z
4) make decision
|z| ≥ |1.96|