Mod 16 (Ch 21) - Energy flow and food webs
1/19
Earn XP
Description and Tags
included on exam 4, updated for spring 2026
Name | Mastery | Learn | Test | Matching | Spaced | Call with Kai |
|---|
No analytics yet
Send a link to your students to track their progress
20 Terms
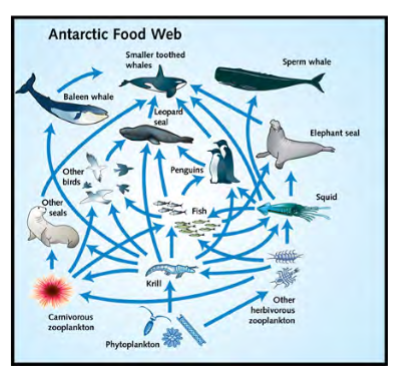
trophic structure
feeding relationships among organisms
how the organisms in a community obtain energy
determines the pattern of movement of energy and matter through an ecosystem
communities are organized based on this by food webs
can be delineated into trophic levels
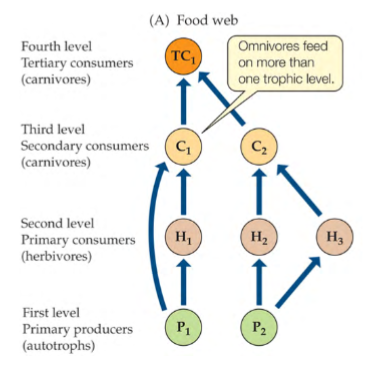
trophic levels
groups of spp that have similar ways of obtaining energy
based on the # of feeding steps separated from autotrophs
have similar roles in moving energy through the ecosystem
all organisms are either consumed by organims or enter the pool of dead organic matter
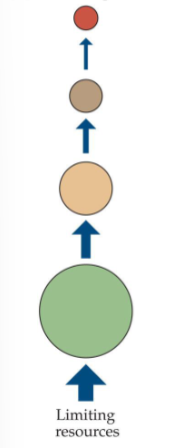
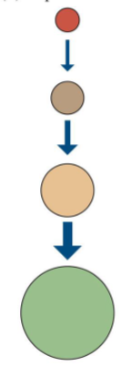
trophic pyramids
a relative comparison among trophic levels of abundance, biomass amount, or energy
depict the flow of food availability or energy between trophic levels
progressively less food (energy) is available to each trophic level
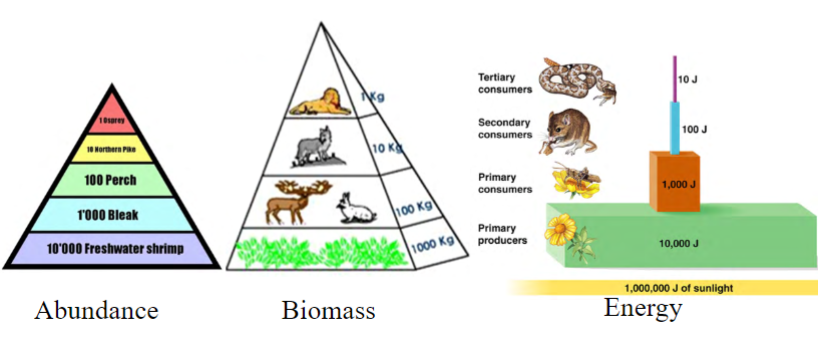
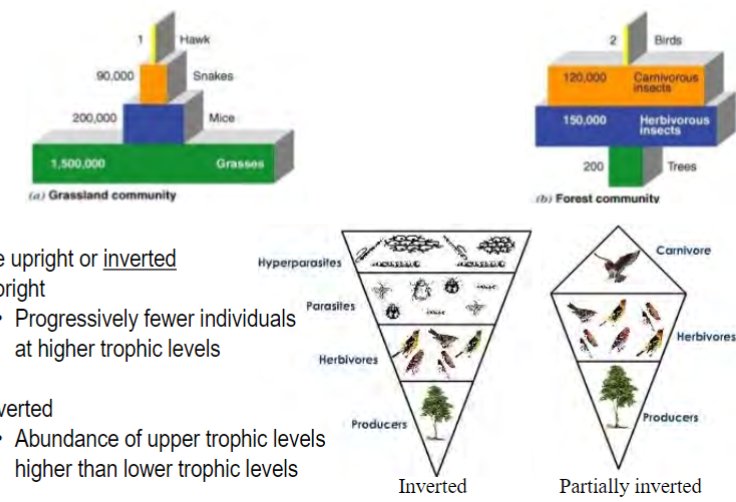
abundance pyramid
a type of trophic pyramid that compares the number of individuals at each trophic level
may be upright or inverted
upright: progressively fewer individuals at higher trophic levels
inverted: abundance of upper trophic levels is higher than lower trophic levels
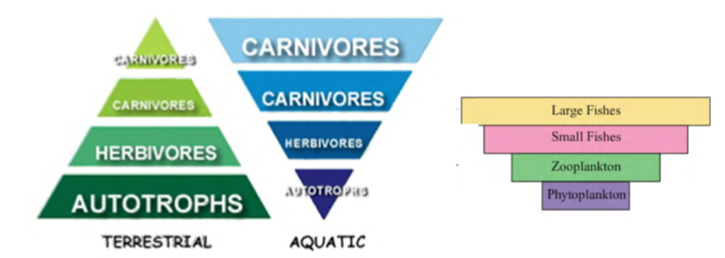
biomass pyramid
a type of trophic pyramid that compares the total mass (~weight) of all individuals at each trophic level
terrestrial pyramids are typically upright
many aquatic systems have inverted pyramids (biomass of lower levels is decreased due to short lifespan, but rapid reproductive rate supplies upper individuals)
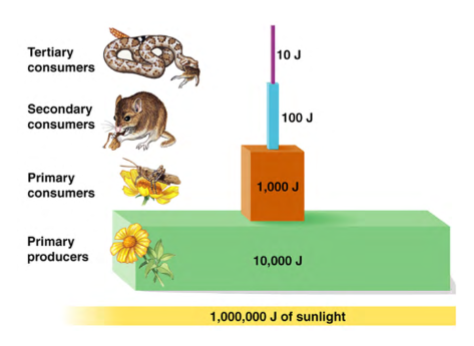
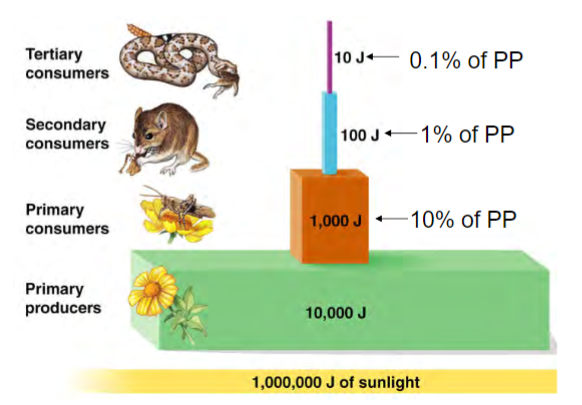
energy pyramid
a type of trophic pyramid that shows the overall amount of energy in the ecosystem, the proportion of energy available in each trophic level, how much energy is transferred from one trophic level to the next
higher trophic levels contain less energy than lower ones
energy ALWAYS decreases from one trophic level to the next
most energy is NOT converted into new biomass
can NEVER be inverted; there is always less energy available in higher than lower trophic levels due to losses from consumption, assimilation, and production
factors determining energy flow from one trophic level to the next
amount of net primary production at the base of the food web (NPP = net primary productivity)
nutritional content of autotrophs, detritus, and prey
efficiency of energy transfers
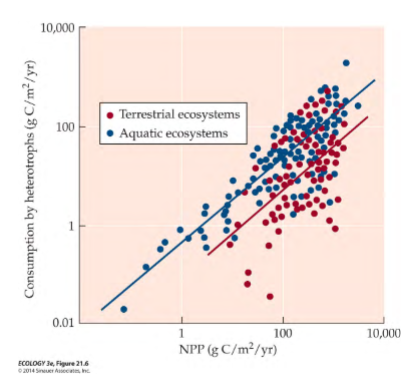
relationship between net primary production and amount of biomass consumed by herbivores
positive
suggests that production by herbivores is limited by the amount of food available
(more NPP → more available for herbivores to eat → more eaten)
Why does energy always decrease from one trophic level to the next?
some is not eaten (e.g. bones, fur, shells, wood) (consumption efficiency)
some of what is eaten is lost as waste (assimilation efficiency)
some of what is eaten but not lost as waste is used for other purposes than making new biomass (cellular respiration and other chemical reactions, heat, muscular movements) (production efficiency)
consumption efficiency
the proportion of available biomass that is ingested
one reason why energy always decreases from one trophic level to the next
assimilation efficiency
the proportion of ingested biomass that is digested
one reason why energy always decreases from one trophic level to the next
determined by food quality and the consumer’s physiology
higher for carnivores than herbivores and detrivores
plant/detritus food quality is low because of hard-to-digest compounds (e.g. cellulose, lignins)
animals are more efficient to assimilate because animal food has a carbon-to-nutrient ratio similar to the animal consuming it
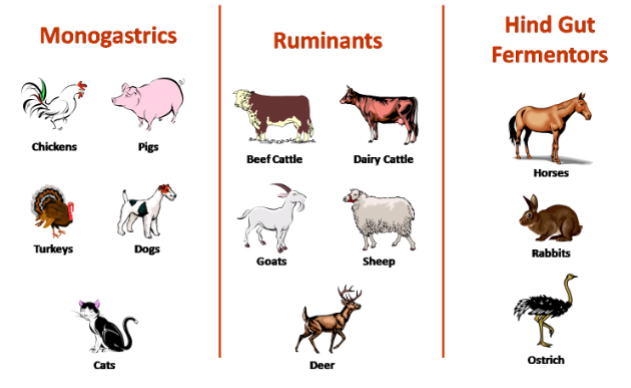
in herbivores, higher in hind-gut fermenters and ruminants than in monogastrics (digestive system is modified to break down cellulose well)
production efficiency
proportion of assimilated food used to produce new biomass
one reason why energy always decreases from one trophic level to the next
strongly related to thermal physiology and consumer’s size
lower much in endotherms than in ectotherms because most energy is lost to body heat
larger in small mammals vs large mammals due to large SA/V ratio
hypotheses for why terrestrial herbivores don’t consume more of the available biomass
herbivore population sizes are constrained by predators and never reach K (supported by predator removal experiments in some ecosystems)
autotrophs have defenses against herbivory → it is harder for herbivores to eat defensive plants, and easier for carnivores to eat herbivores → higher consumption efficiency for carnivores
phytoplankton are more nutritious for herbivores than terrestrial plants; terrestrial plants have structural components, e.g. wood, with few nutrients (more autotrophic biomass is consumed in aquatic than terrestrial ecosystems (35% vs 13%))
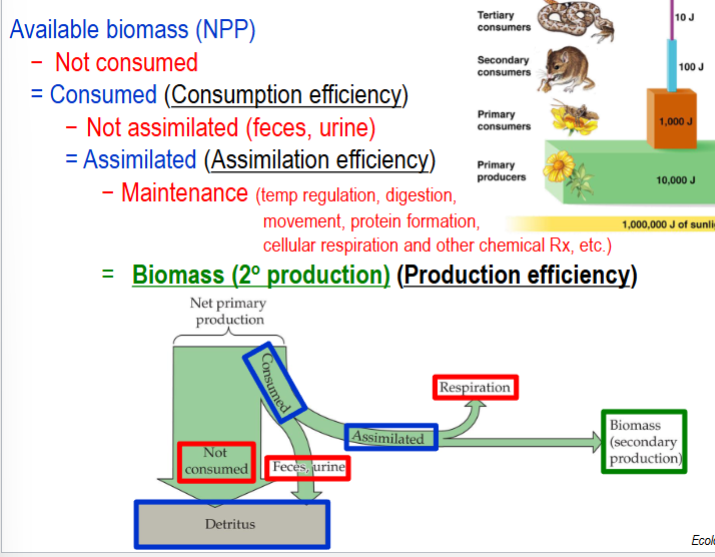
transfer of energy (very little) from one trophic level to the next
starting with NPP → subtract what’s not consumed = consumed (consumption efficiency)
consumed minus what’s not assimilated = assimilated (assimilation efficiency)
assimilated minus maintenance = biomass (production efficiency or 2* production)
trophic efficiency
amount of energy at one trophic level divided by the amount of energy at the trophic level immediately below it
= % of production (primary or secondary) transferred to the next trophic level
most is not or cannot be consumed or is lost through respiration, feces, heat, etc.
incorporates consumption efficiency, assimilation efficiency, and production efficiency
~10% on average (range is 5-20%)
90% of nutrients and chemical energy is NOT transferred to the next trophic level
two views on what controls energy flow in an ecosystem
bottom-up view
top-down view
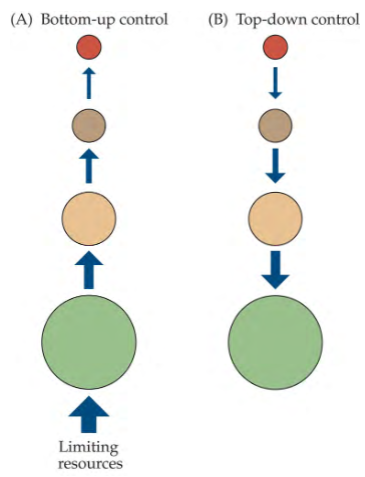
bottom-up view
one view on what controls energy flow in an ecosystem
the abundance of a population is limited by nutrient supply or availability of food
e.g. red colobus monkeys in Uganda; habitat fragments with less food had fewer monkeys
e.g. Steller sea lion populations declined because diet changed from mostly herring to mostly cod and pollock, which contain less than half the nutrients of herring (junk food hypothesis)
top-down view
the abundance of a population is limited by consumers
energy flow is governed by predator consumption rates at the highest trophic level, which influences multiple trophic levels below them
can also consider parasites or disease, not just proper predators as the controlling factor
e.g. islands without lizards having a high abundance of spider spp (no predation → more spider abundance; lizards would decrease spider abundance)
e.g. trophic cascade
bottom-up or top-down: how to tell?
Is there plenty of food available for prey, and where is the prey population’s K?
if there’s plenty of food, but prey population size is below K → you can assume that predators limit their population size
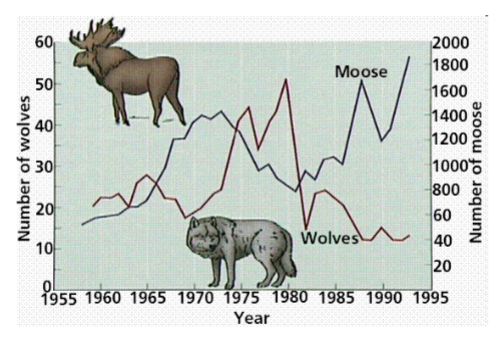
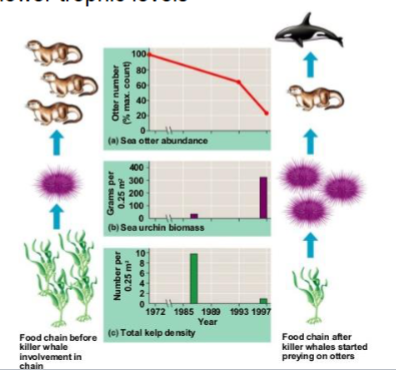
trophic cascade
a change in the rate of consumption at one trophic level that results in a series of changes in spp abundance or composition at lower trophic levels
an example of the top-down view