4.1.5 - Perfect competition, imperfectly competitive markets and monopoly
1/90
There's no tags or description
Looks like no tags are added yet.
Name | Mastery | Learn | Test | Matching | Spaced | Call with Kai |
|---|
No analytics yet
Send a link to your students to track their progress
91 Terms
Market Structure =
The way a market is organised.
Types distinguished by factors like no. of firms, barriers of entry…
Spectrum of Market Structures
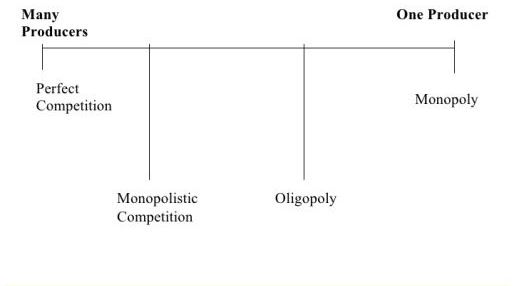
Factors of a Pure Monopoly:
Number of firms
Size of firms
‘Price-making/taking’
Degree of differentiation
Barriers to entry
Profit in long-run
1 firm
Whole market
Price-making
Completely differentiated product
High barriers to entry
Supernormal profits
Factors of Perfect Competition:
Number of firms
Size of firms
‘Price-making/taking’
Degree of differentiation
Barriers to entry
Profit in long-run
Many firms
Small firms
Price-taking
Homogeneous products
No barriers to entry
Normal profits
Types of Barriers to Entry
E-BLIPS
Economies of Scale - Large firms have lower avg costs so can charge lower prices → new firms cannot be price competitive
Brand Loyalty - tendency for consumers to buy from a known brand even when prices are higher or quality of product is worse
Legal Barriers - Laws making it more difficult to enter market, e.g. license to distill alcohol
Intimidation - Incumbent firms conducting antisocial behaviour, legal action, vandalism
Predatory pricing - Temporarily setting prices below cost
Setup/exit costs
Allocative Efficiency =
An economy produces the combination of g&s which maximises social welfare.
P=MC
AR=MC
Productive Efficiency =
When AC is minimised; smallest possible cost per unit of output
AC=MC
Economic Efficiency =
When allocative & productive efficiency occur at the same time
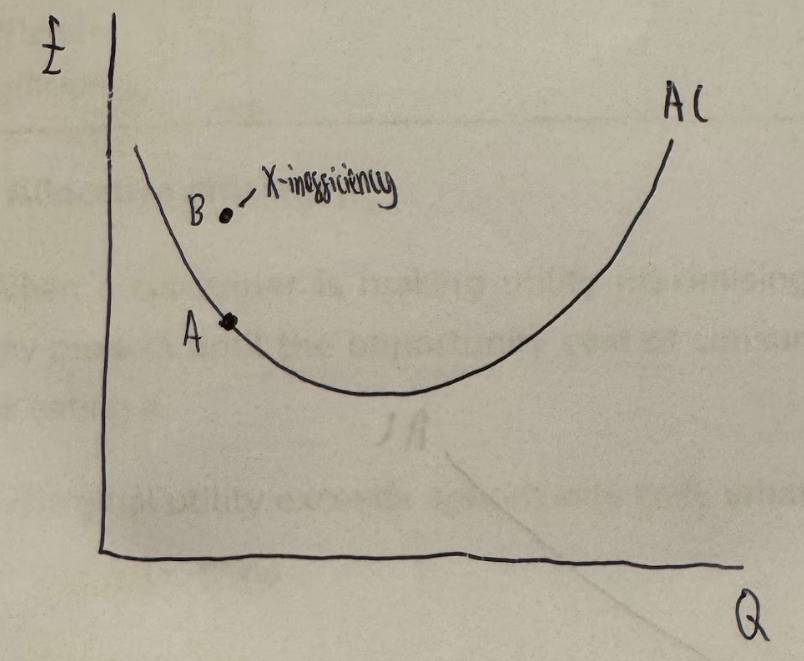
X-Inefficiency =
When average cost is higher than necessary due to lack of incentive to control costs (e.g. due to lack of competition)
Dynamic Efficiency =
When firms make improvements to productive efficiency over time (e.g. through reinvesting profits in R&D - innovations)
Static Efficiency =
Concerned with the most efficient combination of existing resources at a given point in time.
Types:
Allocative
Productive
Static vs Dynamic Efficiency
Static efficiency is about maximising efficiency at a given point in time. While dynamic is about achieving efficiency over time by adapting to changing conditions.
Consumer Surplus
The difference between the price a consumer is willing and able to pay and the actual price paid (equilibrium price).
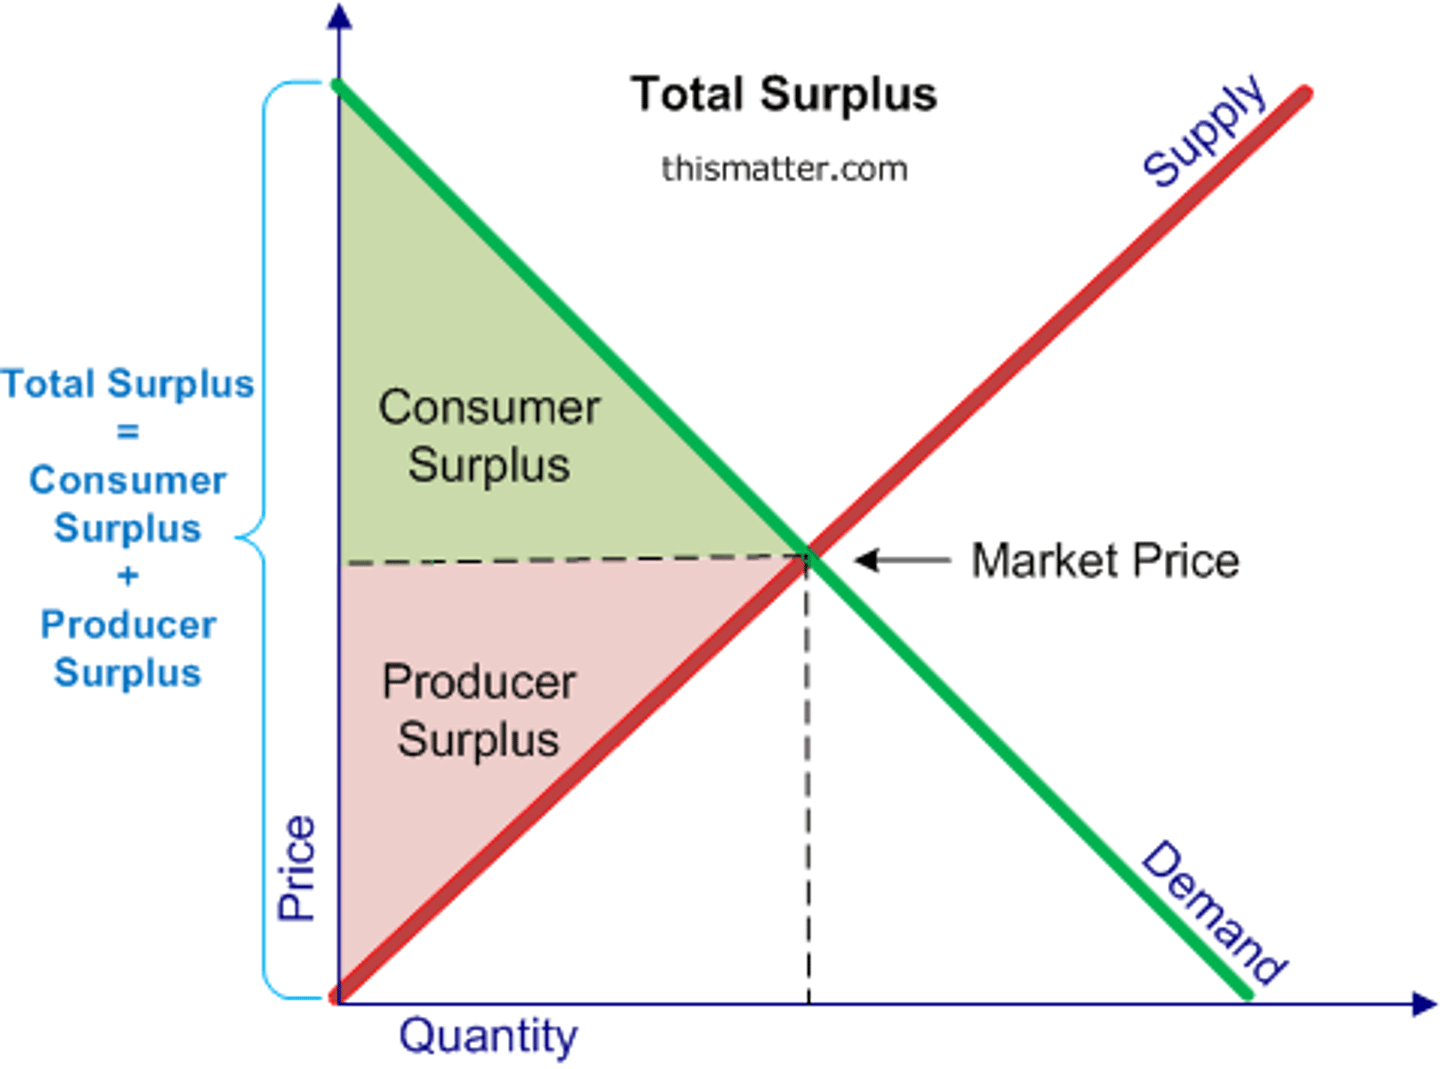
Producer Surplus
The difference between the price a supplier is willing and able to supply the product for and the actual price received (equilibrium price).

Objectives of Firms
Main one for most firms:
Profit maximisation
Other objectives:
Revenue maximisation
Sales maximisation
Profit satisficing
Social objectives
Profit Formula =
(Price - Average Cost) x Quantity
Normal Profit =
Amount of profit needed to compensate investors for their risk and opportunity cost.
Supernormal Profit =
Any profit above normal profit
Reasons why firms want to maximise profits?
Shareholders
To please shareholders - pay out a portion of profits as dividends
More dividends attracts more investors to provide the firm capital
Reinvesting - dynamic efficiency
Investing in R&D can lead to inventions & innovations → reduce average costs, making firms more efficient in long term
Survival
Firms can only survive on normal/supernormal profit in long term
Worker incentives
Bonuses paid to workers - raises incentive for workers to work harder
Factors preventing a firm from maximising profits
Non-profit
Donating to charity
Difficult to calculate marginal revenue & marginal cost making it hardd to know the profit maxing position
Reasons why firms revenue or sales maximise
Gain market share
Larger ‘footprint’ in the marketplace
Attracting investors
Exploit economies of scale
Prevent new firms joining the market
Reasons why firms profit satisfice
= Making a sufficient level of profit to satisfy relevant stakeholders, without maximising
May avoid bad publicity
May avoid unwanted regulatory attention
Balancing profit against other objectives like social objectives
Example of firm that profit-maximises
NVIDIA
Example of firm that revenue/sales maximises
Netflix, Asda
Where profit, revenue, and sales maximisation is on a diagram
1) Profit Maximisation: MR=MC
2) Revenue Maximisation: MR=0
3) Sales Maximisation: AR=AC

Divorce of ownership and control
Just because a business chooses something as an objective, that doesn’t mean it will actually happen in practice.
When a company's owners (shareholders) do not manage day-to-day operations, delegating authority to managers, they may act with different goals.
This can lead to profit not being maximised because shareholders can’t enforce their preferred price for goods that are sold
May lead to dynamic efficiency less likely to occur
May lead to X-inefficiency
Characteristics of Perfect Competition
Very large number of firms
Firms are small
Firms produce homogeneous products
No barriers to entry
Each buyer and seller possesses perfect information of what is happening in the market
Each consumer is able to buy, and each producer is able to sell, as much as they wish at the ruling market price.
Firms are ‘price-takers’ - a single seller is unable to influence the ruling price
In Perfect Competition, why is the AR=MR horizontal?
Firms are ‘price-takers’ so a single buyer or seller is unable to affect the market price
So each firm has to charge the price that prevails in the whole market.
If one seller raised its price above market price, its sales would fall to 0.
Therefore, the PED for one firm is perfectly elastic → AR=MR is horizontal
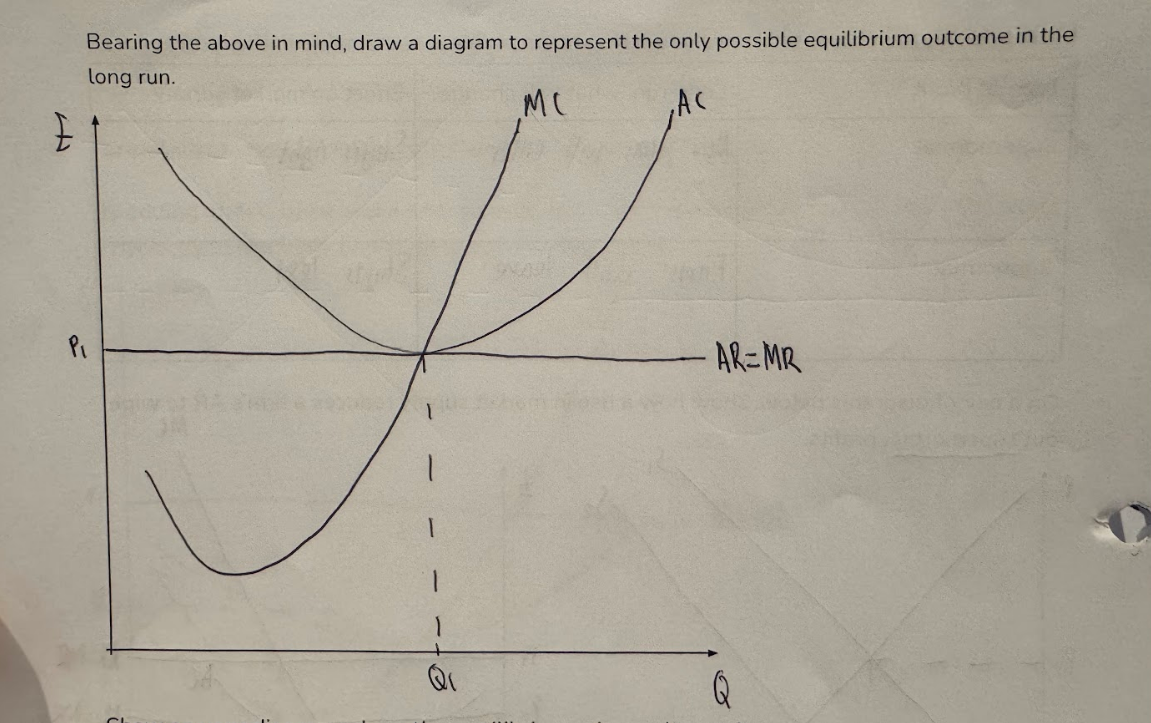
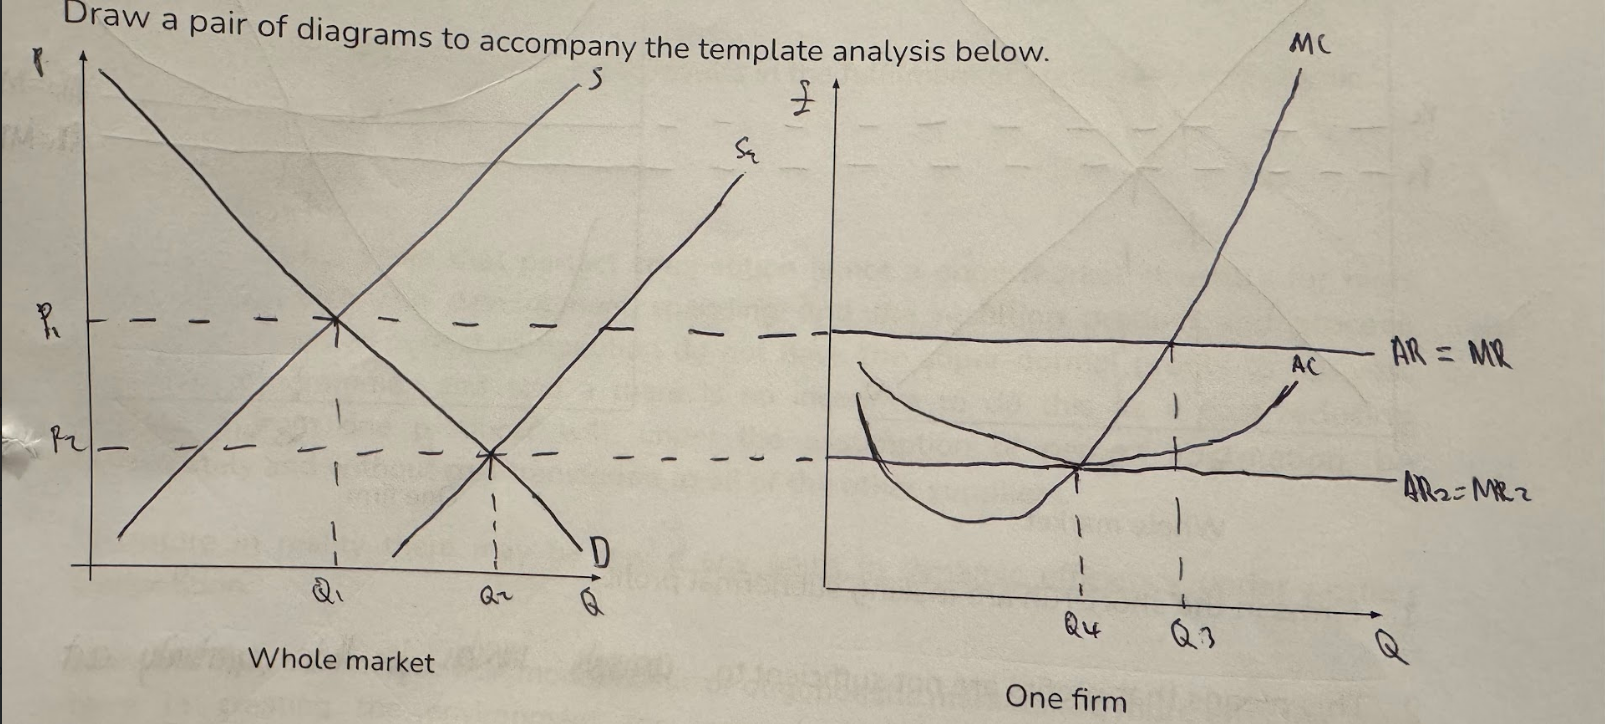
Diagram of Perfect Competition in the Long Run
- In long-run, firms will always make normal profit
If in short-run, perfect competition is making supernormal proft, what will happen in long-run. (Chain of Analysis)
In short-run, firms make supernormal profits. AR1=MR1
Firms outside market are incentivsed to enter market in search of profits
In long-run, more firms will enter this market
Whole market supply shifts right from S1 to S2 → market price falls from P1 to P2
Firms are price-takers so also decrease prices from P1 to P2 → AR=MR curve shifts downwards to AR2=MR2
Quantity sold decreases to Q2 so now AC=AR
Therefore, normal profit now being made
Supernormal profits of incumbent firms have been eroded.
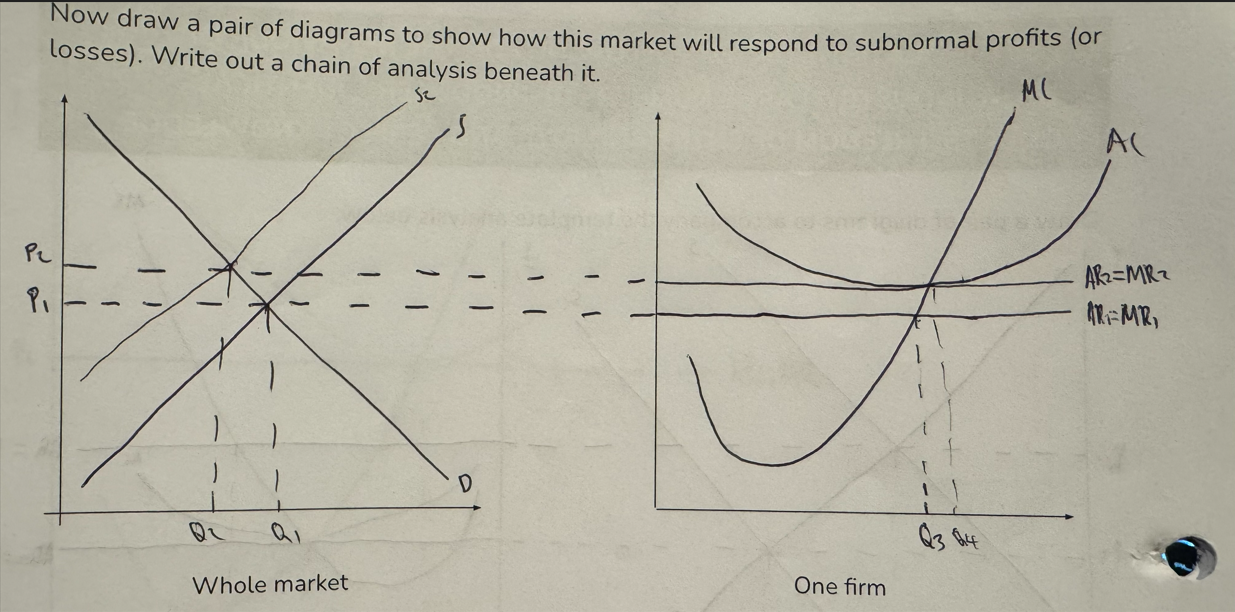
If in short-run, perfect competition is making subnormal proft, what will happen in long-run.
In short-run, firms make subnormal profits. AR1=MR1
Firms’ profits are not sufficient to compensate investors for their oppportunity cost
As no barriers to exit, it is better for these firms to leave market to make profit elsewhere
Whole market supply shifts left from S1 to S2 → market price rises from P1 to P2
Firms are price-takers so also increase prices from P1 to P2 → AR=MR curve shifts upwards to AR2=MR2
Quantity sold increasees to Q2 so now AC=AR
Therefore, normal profit now being made
Is perfect competition Efficient?
Productively efficient: AC=MC
Allocatively efficient: AR=MC
Not Dynamically efficient
Charcateristics of Monopolistic Competition:
Many firms
Differentiated products
Few barriers to entry
Price-makers
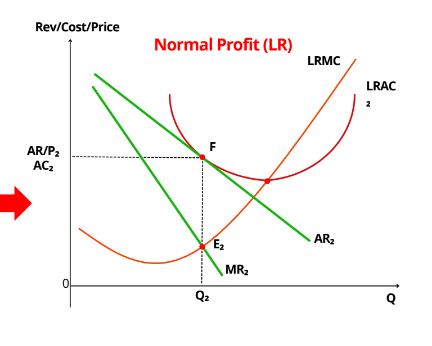
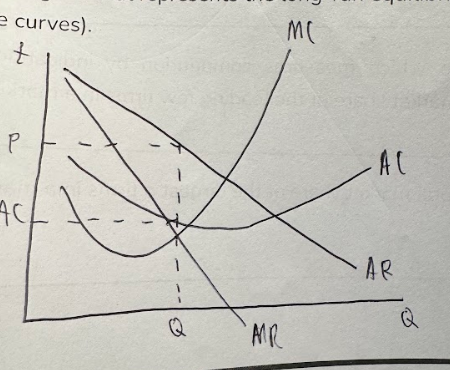
Diagram of Monopolistic Competition in the Long Run
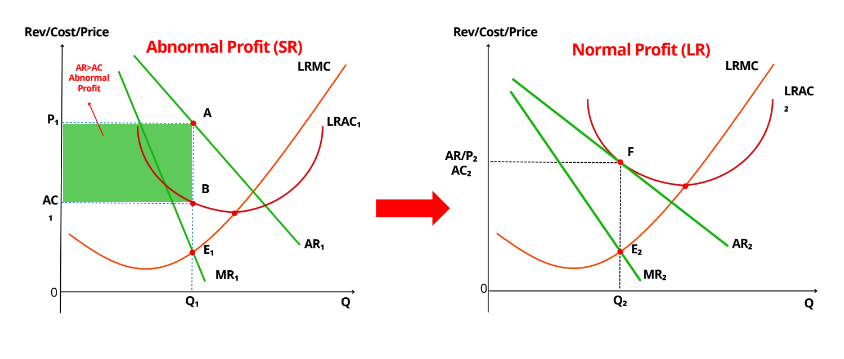
If in short run, monopolistic competition is making supernormal profit, what will happen in long-run.
In short-run, firms make supernormal profits.
As no barriers to entry, more firms enter this market in long-run
MR and AR become more elastic as more substitutes available
MR and AR shift to left as they lose customers to other producers.
Process stops when each firm only makes normal profits (AR=AC)
Is monopolistic competition efficient in long-run?
Not allocatively
Not productively
Real World Examples of Monopolistic Comp
Restaurants
Barbers
Monopolistic Comp is subject to Non-Price Competition
Quality of product
Branding
Customer Service
Location
Advertising
Range of products
Characteristics of an Oligopoly
A few large firms
Somewhat high barriers to entry
Interdependent - actions of one firm provoke counter-action by others
Supernormal profit in the long run
Objectives of firms to profit-maximise
Collusive Oligopoly
Where firms agree to work together in order to improve their mutual objectives and profits - Maximise their “joint-profit'“
Tacit Collusion =
Where firms agree to work together but without any explicit or written agreement.
e.g. price leadership
Cartel =
A collusive agreement by firms usually to fix prices, regulate supply or restrict new entrants.
They are illegal
Collusive Diagram
When firms collude, we can treat the whole market as thought it is a monopoly.
Non-collusive/competitive Oligopoly
Where firms act independently of each other, act competitively by aiming to gain market share at other firms’ expense
Price wars, non-price competition
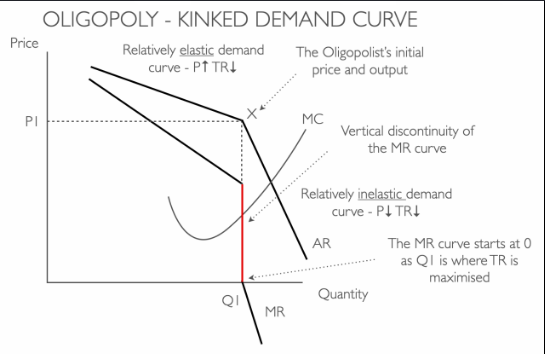
Non-Collusive Oligopoly Diagram
Kinked Demand Curve
If a firm lowers prices (P1 to P2), competitors will simply match this by reducing prices too → so demand is inelastic → Firms lose revenue so MR curve is negative
If a firm raises prices (P1 to P3), competitors will not follow but keep prices the same → so demand is elastic → Firms lose revenue as large fall in sales
Potential Advantages of Oligopolies
Greater price stability
More dynamically efficient
Cooperation on industrial standards or product features
Disadvantages of Oligopolies
Allocative inefficiency
Productive inefficiency
Higher prices & lower output
Higher concentration reduces consumer choice
Concentration Ratio
The percentage of market share taken up by the ‘n’ largest firms in an industry (e.g. 3 firm concentration ratio)
Non-Price Competition
Competition between firms in ways other than changing prices
Quality of product
Branding
Customer Service
Location
Advertising
Range of products
Real World Application of Oligopolies - Supermarket Industry
Supermarket Industry
5 firm concentration ratio: 66% (Tesco 28.5%)
Predatory Pricing: 1996 Supermarket price war resulted in 3p baked beans
Brand loyalty: Over 22mn households use a clubcard in the UK (non-price competition)
Environment: UK supermarkets produce 240,000 tonnes of food waste annually from their operations and 100,000 tonnes of this is deemed to be edible food.
Characteristics of Pure Monopoly:
1 very large firm
Price-making
Differentiated product
High barriers to entry
Supernormal profit in LR
Legal Monopoly =
A firm with >25% market share
Natural Monopoly =
When the most efficient number of firms in the industry is one
Monopoly Power
Ability of a firm to set a price above what would prevail in perfect competition without losing all its customers.
Factors affecting Monopoly Power:
Barriers to Entry - Anything that prevents other firms from entering the market
Natural barriers = Occurs automatically from the firm being large. (e.g. EOS, brand loyalty)
Artificial barriers = Created by incumbent firms. (e.g. predatory pricing, patents, licences)
Advertising - Increases awareness of product
Informative - Tells people about product
Persuasive - Why product is better than others
Saturation - High volume marketing to put brand out there
Number of Competitors - More competitors = less monopoly power as firms can switch consumption
Product Differentiation - Having superior design, quality or characteristics to subtitutes allows firm to charge higher prices (monopoly power).
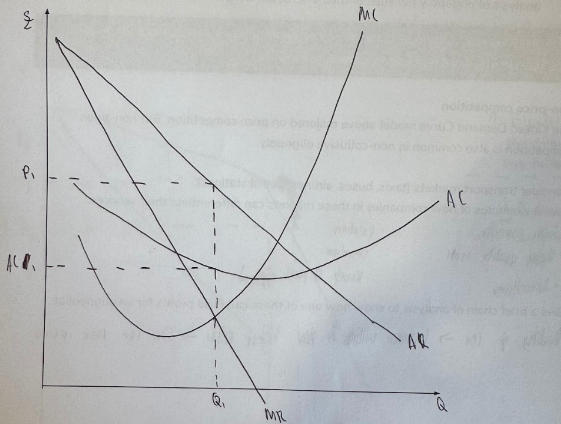
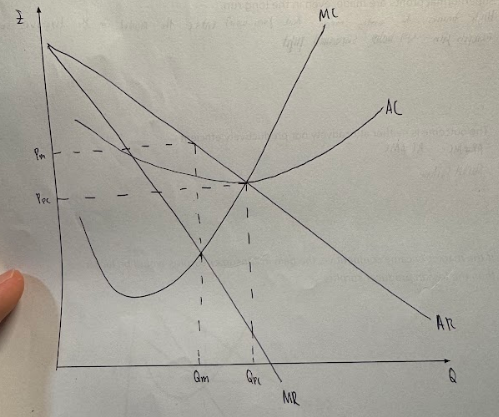
Monopoly Diagram
Is monopoly efficient?
Not allocatively
Not productively
Dynamically efficient
Show on diagram and explain how monopoly results in higher prices & more inefficiency compared to competitive market
Monopoly sells at profit-maxing point where MR = MC
So price at Pm
In competitive market, MR horizontal so firms profit-maxing point where AR=MC (as this is same as S=D)
So equilibrium price lower at Ppc
Also, in competitive market, equilibrium where AC=MC and AR=MC so is productively efficient and allocatively efficient.

Advantages of Monopoly
Economies of Scale - Output produced by firm is same as for entire industry, so monopoly produces large quantity of good/service. So EOS allows for lower average costs than smaller competitive firms
shown by L-shaped AC curve
Dynamic Efficiency - Makes supernormal profit. More profits to reinvest into R&D to improve efficiency → can produce higher quality goods or at lower prices (benefits consumers)
Disadvantages of Monopoly
Allocative Inefficiency - Profit-maxing point for monopoly not where P=MC
Productive Inefficiency - Without competition, firms feel no need to ensure that MC=AC at profit-maximisation. So unit costs are higher than they would be in competitive market.
X-Inefficiency - Without competition, reduces firm’s incentive to eliminate waste.
Firms can still make supernormal profits even if their average costs is higher than it could be for a given level of output.
So their average costs may remain unnecessarily high
Reduced Choice - Lack of substitutes → no incentive to provide higher quality products/service
Diseconomies of Scale - If monopoly gets too big, can suffer from diseconomies of scale
Benefits from Increased Competition
Diagram showing Monopoly vs Perfect Competition
Lower prices - Firms compete for market share by undercutting each other’s prices (price competition)
Increased output - Extension along market demand as more consumers want to buy at lower prices
Allocative Efficiency gains - More new entrants want to charge lower prices to make supernormal profits up to point where P=MC. In competitive market, MR becomes AR curve, so firms sell up to the point where P=MC.
Productive Efficiency - With competition, firms incentivsed to produce quantity of goods with lowest average cost.
Decrease in X-Inefficiency - To remain competitive, firms have to improve effieicny and cut costs to continue making supernormal profits
Greater Dynamic Efficiency - Greater non-price competition as firms seek to differentitate products to gain monopoly power
Increased Consumer Surplus - Price falls → increased economic welfare
Innovation =
Improvements to something already invented.
Product Innovation =
Changes to the characteristics and performance of a good/service
Process Innovation =
Changes to the way in which production takes place.
Creative Destruction =
Where new technologies and innovations replace older ones.
Creative Destruction Chain of Analysis of Monopoly Power
Incumbent firms with monopoly power make supernormal profits, which acts as an incentive for new disruptive smaller firms to try and enter the market.
These new firms find ways of reducing existing barriers to entry by using advancements in technology to innovate
New disruptive firms will enter the market and eat into the market share of larger, existing monopolies.
Leads to ↑competition → erosion of supernormal profits
In SR, existing firms may react by dropping prices, improving efficiency, improving quality of products.
In LR, monopoly power decreases → shift to perfect competition.
Benefits seen via Monopoly vs PC diagram:
Lower prices
Increased output
Increased productive & allocative efficiency
Reduced X-inefficiency
Increased economic welfare
Real World Examples of Creative Destruction
Streaming services - Netflix replacing video rentals like Blockbuster
Gambling - Online casinos replacing real life ones
Music - Spotify digital music streaming replacing physical CDs & vinyls
Why is creative destruction used as an argument against gov intervention & regulation in markets?
Argues that the process of creative destruction will naturally over time lead to markets where there is monopoly power becoming more competitive and efficient in the long-run.
Therefore, gov intervention not needed to promote competition.
Evaluation of Creative Destruction (IDO’s)
IDO:
Funds - Whether new disruptive firms have the funds to invest in the R&D necessary to innovate
Entrepreneurial skills - Whether new disruptive firms can innovate effectively to compete against larger monopoly firms
Patents - Whether new disruptive firms can protect/patent their new technology to prevent existing firms just copying the same technology
Legal barriers to entry - Prevents creative destruction
Price Discrimination =
Charging different prices to different customers for the same product/service for reasons unrelated to the cost of production
1st Degree Price Discrimination
= Each consumer pays exactly the maximum price they are willing to pay
Eliminates consumer surplus
Conditions for 1st Degree Price Discrimination:
Perfect Knowledge of every customer’s maximum willingness to pay (reservation price)
Expensive & time-consuming
Examples of 1st Degree Price Discrimination
Auction house - letting people bid up the price - winning bidder pays at least the 2nd highest bidder’s reservation price
Ebay bidding
2nd Degree Price Discrimination
= Charging different prices based on the quantity of a good/service that the consumer buys, (for reasons unrelated to the cost of production)
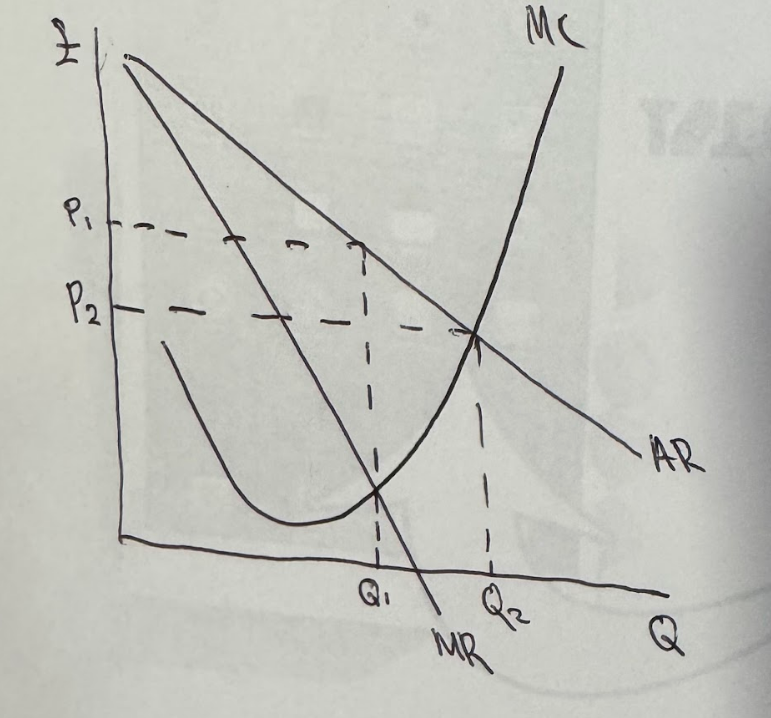
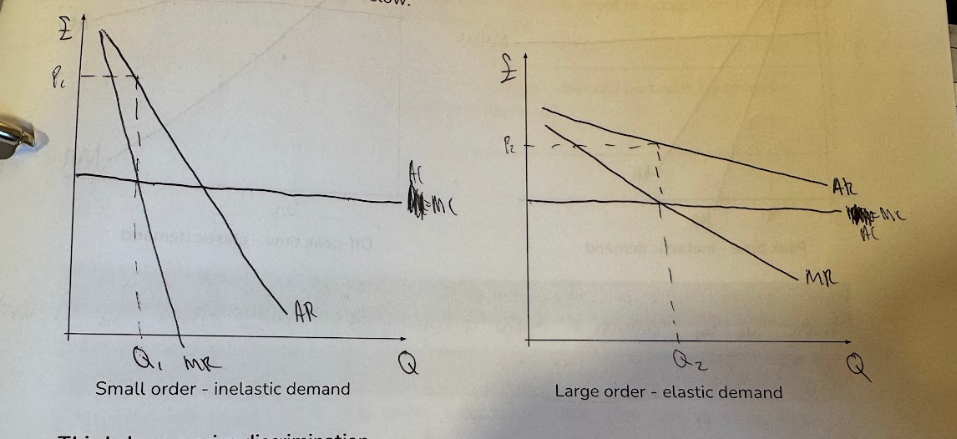
Example of 2nd Degree Price Discrimination with explanation & diagram
Bulk-buying discounts.
Consumers buying larger quantities have more price elastic demand.
This is because the expenditure is larger so consumer more sensitive to price changes, and have more incentive to look for savings as it would decrease amount spent more than for consumers only buying small quantity.
Therefore, at the profit-maxing point, price is lower at P2 for the larger order customer.
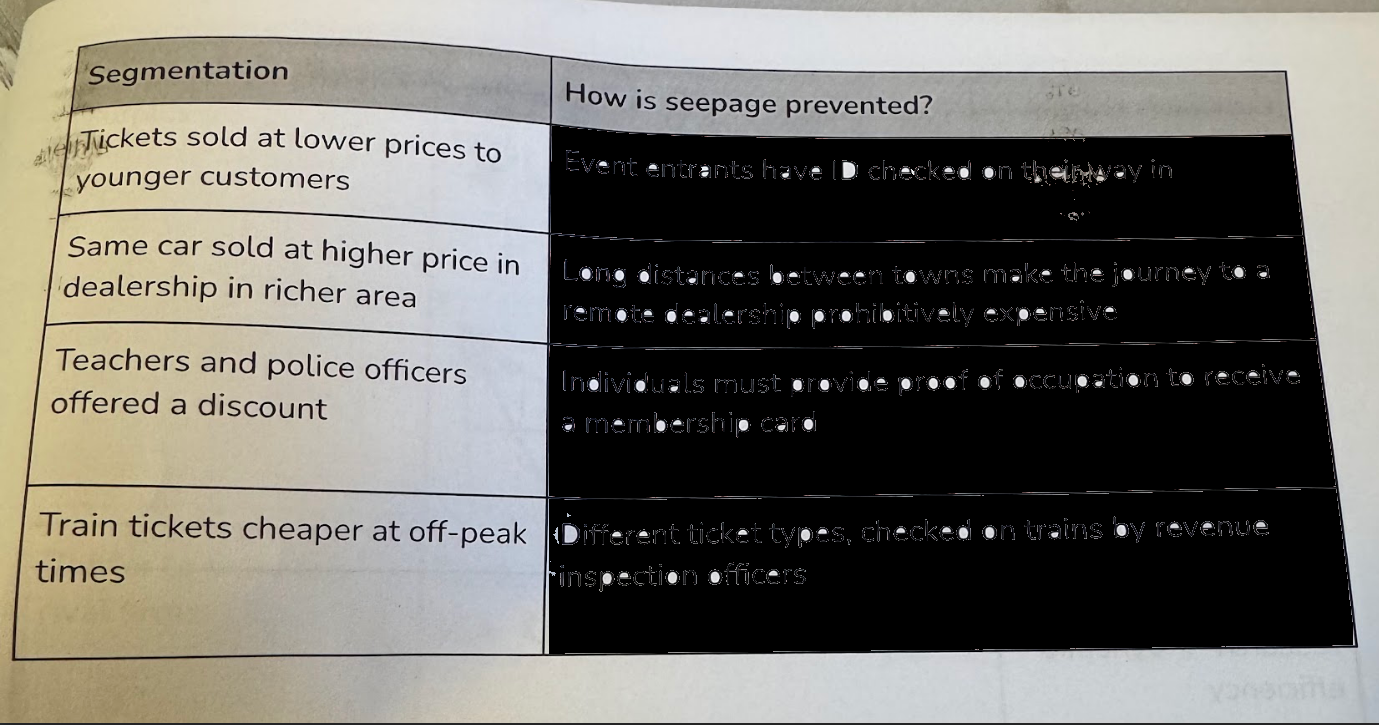
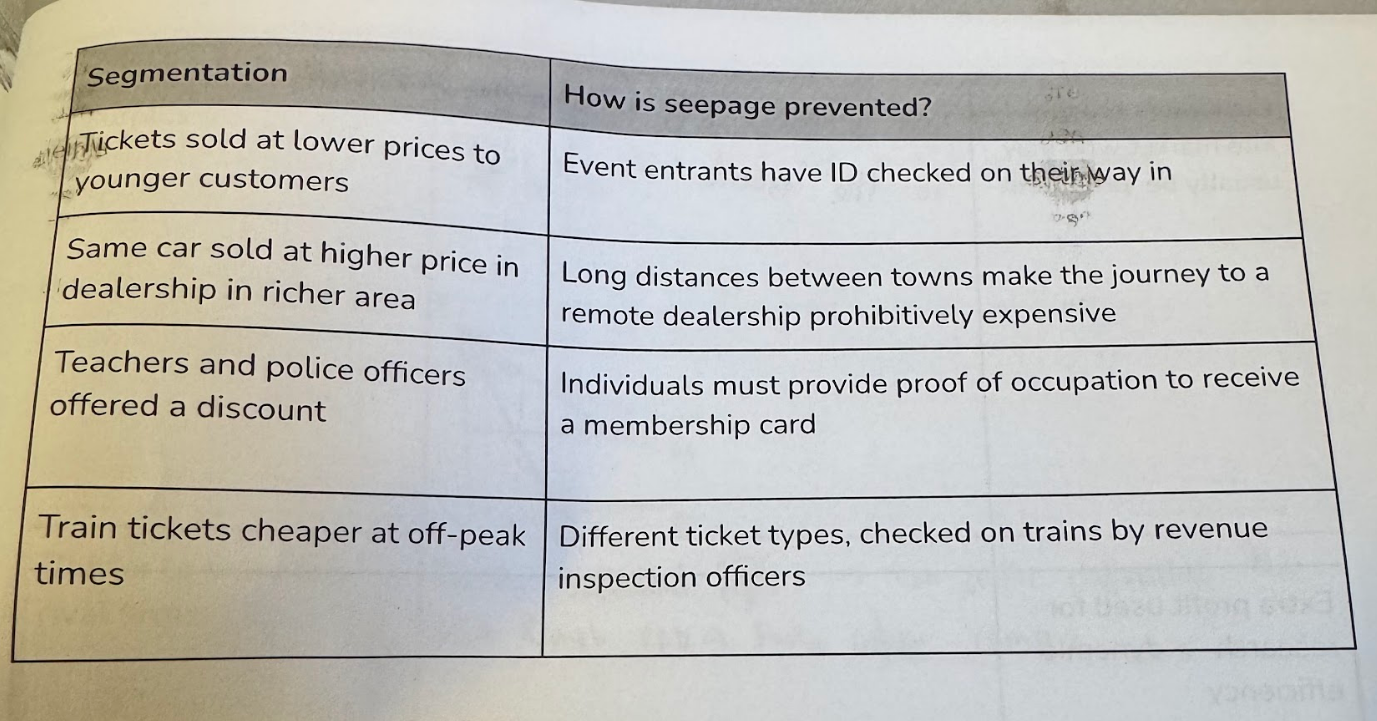
3rd Degree Price Discrimination
= Price discrimination based on splitting the market into different segments.
Examples of 3rd Degree Price Discrimination
Age - different ticket prices for age groups (children & pensioners discounts)
Time - peak vs off-peak train tickets, flights, taxis
Geographical - same good sold at higher price in richer area vs poorer area
Profession - discounts to military
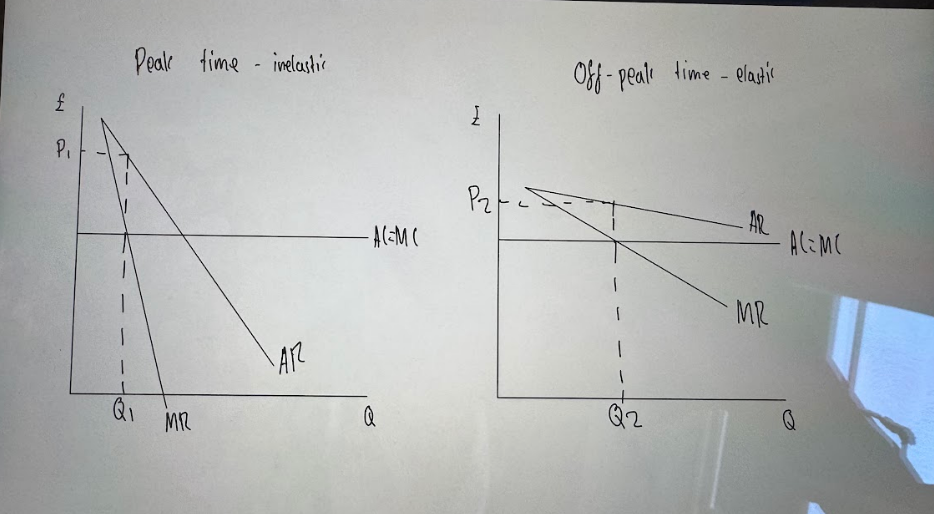
Diagram & Analysis of 3rd Degree Price Discrimination
Diagram the same as 2nd degree, but the reason for different elasticities is different.
For the example of Peak vs Off-peak train tickets:
At peak times, travelling home or to work is a necessity, so people are less sensitive to changes in price.
Therefore, demand is more inelastic so at profit-maxing point, price is higher at P1.
Conditions for 2nd & 3rd Degree Price Discrimination
Price-making power - Must be able to raise prices without losing all sales to competitors
Demand must have different elasticities in different segments - Otherwise profit-maxing price will be same in each segment
Prevent seepage - Must be able to prevent consumers from buying through other segments, otherwise all consumers will buy in the cheaper segment.
Advantages of Price Discrimination
Cross-subsidise - Profits from high-price segments can be used to subsidise activities that bring social benefits (e.g. free bus passes for pensioners)
Better use of spare capacitiy to prevent waste - Services like Flights & AirBnBs reduce prices over time so that all capacity is full.
New customers brought into market who would usually be ‘priced out’
Extra profit for firms - Can be reinvested for research → dynamic efficiency
Disadvantages of Price Discrimination
Exploitation of consumers - Consumers with more inelastic demand forced to buy in more expensive market segment → Firms can charge higher prices to more desparate / less well-informed customers, without losing sales in other segments.
Extraction of Consumer Surplus - Firms can raise prices in inelastic segment, reducing consumer surplus, without losing sales in other segments
Barrier to entry for rival firms - Making supernormal profits → Advantage for R&D & product differentiation → Reduces competition
Contestability =
= The extent to which entry and exit in a market is free/costless.
It is the threat of competition that is important in influecing price & quantity.
Sunk Costs =
Costs that cannot be recovered if a firm ceases operation.
acts as a barrier to entry
Hit and Run Entry =
When a firm enters a market where supernormal profits are being made and then leaves when profits return to normal.
Cream Skimming =
Business strategy involving only focusing on most profitable segments of the market.
e.g. only offering business post services and not household mail
Characteristics of Contestable Markets:
Low Barriers to Entry
Low Barriers to Exit
No Sunk Costs
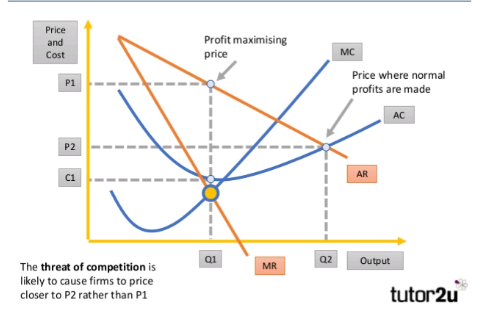
Contestable Market Chain of Analysis
Less barriers to entry & exit (e.g. reducing regulatory requirements to open a bank, reducing startup costs) → market more contestable
This increases the threat of competition.
As a result, any supernormal profits being made act as signal for new firms to enter the market and gain some of the supernormal profit by using hit and run or cream skimming tactics
To prevent the erosion of the supernormal profit, incumbent firms with monopoly power reduce prices from P1 to P2, whilst increasing quantity from Q1 to Q2, to limit the incentive for new firms to enter
If perfect contestability (0 barriers to entry), firms will now make normal profit where AC=AR.
Results in:
Lower price
Higher output
Normal profits
Allocative efficiency improved (price closer to MC)
Consumer surplus increased → Higher economic welfare
Examples of Contestable Markets
Low-cost/budget Airlines (e.g. Ryanair, EasyJet)
Market Stalls (e.g. flowers in town market)
Contestable vs Competitive Market
Contestability is about the THREAT of competition which influences the firm to reduce prices.
In perfect comp, there are a large number of sellers.
In contestable markets, there may only be one.
Evaluations of Contestable markets
No perfectly contestable markets in reality - always some barriers
May force firms away from profit-maximising behaviour
Depends on degree of contestability