CH114 Study Guide
1/292
There's no tags or description
Looks like no tags are added yet.
Name | Mastery | Learn | Test | Matching | Spaced | Call with Kai |
|---|
No analytics yet
Send a link to your students to track their progress
293 Terms
epidemiology definition
the study of the distribution and determinants of disease frequency in human populations and the application of this study to control health problems
An idea central to epidemiology is that
good and bad health events do not happen to people randomly
distribution of disease mechanisms
person (age, sex, SES)
place (urban, US, near an incinerator)
time (june, annual, decade)
determinants definition
factors that cause some people to get a disease
determinants are also called
exposures or risk factors
frequency
counting the number of cases of a disease in a population over (or at) a specific time period
populations
a group of people with a common characteristic (or many common characteristics) such as residence, age, sex, group membership, etc.
why is it important to apply studies to control health problems?
there is no point to collecting and analyzing data if it cannot be used to help control health problems
sequence of epidemiologic investigations
suspect that exposure influences disease occurrence → form specific hypotheses about exposure-disease association → conduct epidemiologic studies → judge whether association is valid and causal → evaluate preventions + treatment →
we operate under what type of hypothesis when doing research
null hypothesis
null hypothesis
the idea that there is no association between the variables being studied
t/f: epidemiology is concerned with individuals
false; it is involved with large populations
4 branches of public health
policy, scientific, clinical, activist
public health triangle involves which branches of public health
policy, scientific, and clinical
Epidemiologic units of study
person, place, and time
primary level of prevention in public health
actual prevention of a specific outcome
secondary level of prevention in public health
identification of an outcome at an early stage in its natural history, leading to improved outcomes
tertiary level of prevention
the limiting of mortality, morbitidy, and/or disability of the specific outcome after it has occured
example of secondary level of prevention
detecting cancer at stage I
example of teriary level of prevention
EMS care after an accident before arriving at the hospital
basic causal theory
A framework for understanding the relationships between causes, conditions, and health outcomes in disease prevention.
objective causality
a theory that can be objectively tested by people other than the person proposing it
subjective causal theory
a theory that cannot be proven or disproven by assessing data
3 types of cause
necessary, contributing, and sufficient
necessary cause
a cause that must be present for something to develop in a causal manner
example of necessary cause
exposure to HIV is necessary to develop AIDS
contributing cause
a cause that increases/decreases the risk of development of an outcome, but is NOT necessary
contributing cause example
flooding after heavy rains in areas with poor sewage systames can cause outbreak fo diarrheal disease
flooding is not a necessary cause for diarrhea, but it increases the risk significantly.
sufficient cause
all contributing and necessary causes needed to bring about a certain outcome in a given individual are present
sufficient cause example
exposure to influenza is a necessary, but NOT sufficient cause
with a weakened immune system, poor nutrition, no vaccination, etc., influenza will likely develop
rothman’s causal pies
a visual representation of causal factors, showing sufficient and necessary causes as a combination of elements within pieces of a pie.
Hill’s 6 Causal Criteria
strength of association
consistency of the association
temporal sequence of the association
dose-response association
analogy
biologic plausibility
strength of association
the stronger the association, the more likely it is to be causal
consistency of association
if association appears very strong in one study but weak in another study, it is less likely to establish causality
temporal sequence of association
if X is the cause of Y, X must occur before Y in time.
dose-response association
causality is more likely if an increase in exposure leads to a corresponding increase in effect.
analogy
when a similar agent causes disease, the agent at hand can be more suspect
smallpox vaccine
Edward Jenner, while still a medical apprentice, noticed
that milkmaids who had contracted a disease called
cowpox, which caused blistering on cow’s udders, did
not catch smallpox.The milkmaids sometimes reporting having smallpox as
a child, but then they tended to not get cowpox.Jenner reasoned that cowpox was caused by something
similar to smallpox and thus infection by one seemed to
make the person immune to the other.Unlike smallpox, which caused severe skin eruptions,
dangerous fevers, and substantial mortality in humans,
cowpox led to few symptoms in these women.
On May 14, 1796, Jenner took fluid from a cowpox
blister and scratched it into the skin of James Phipps, an
eight-year-old boy. Blisters rose up on the scratched spot
(cowpox), but James soon recovered.On July 1, Jenner inoculated the boy again, this time pus
matter from a smallpox patient, and no disease
developed. The vaccine was a success
biologic plausibility of the association
the relationship between an exposure and an effect is supported by scientific evidence, making the observed association credible.
4 components for measuring disease frequency
population, cases of disease, size of population, time
population can be called
reference population, base population, or source population
source population
the commonality between the population individuals is a specific location
fixed population
a population whose membership is defined on the bases of some event; permanent membership
dynamic population
a population whose membership is defined by being in a state or condition; membership can be transient
#cases of frequency is always the numerator/denominator of all frequencies
numerator
disease definition
any health outcome (positive OR negative)
2 types of incidence
cumulative (risk) or person-time incidence
if incidence is said without specificity, what are they referencing
generally referring to cumulative incidence
subjects used to calculate point prevalence
individuals who have the disease at a specific point in time
subjects used to calculate incidence
subjects that do not have the disease at the baseline and are followed over time to see if they develop the disease.
2 ways to monitor subjects when calculating P or I
follow them for specific amount of time
follow for different periods (usually done if subjects start the study at different times)
when following individuals for a specific amount of time, how do you caluclate CI
CI/R = # individuals who develop the condition / # individuals in the population at the start of the study period
critical assumption regarding CI
All people in the population have been followed for the entire specified time period. If anyone has not, they cannot be used in a risk calculation.
what does CI / risk tell us
the probability of an individual of getting a condition over a certain period of time
if you follow up on subjects over specific periods, how do you calculate incidence rate (IR) / person-time incidence
IR = # new cases of a condition during a specified time period / total person-time of observation during the given time period
fundamental to calculating incidence rate is
person-time
person-years
a measure combining the number of people and the amount of time each person is observed, used to express the total amount of time at risk for a particular condition.
2 types of prevalence
point prevalence and period prevalence
point prevalence
prevalence at a specific point in time
period prevalence
how many people had this condition at any time over a certain period of time
question you would ask for point prevalence
do you currently have x?
question you would ask for period prevalence
have you had x during this time period?
difference between period prevalence and cumulative incidence
incidence is only new cases, period prevalence is not necessarily new cases
calculating point prevalence
P = # individuals with a condition at a specific time / # individuals in the population at that specific time
when using “prevalence” generally, which one are they usually referring to
point prevalence
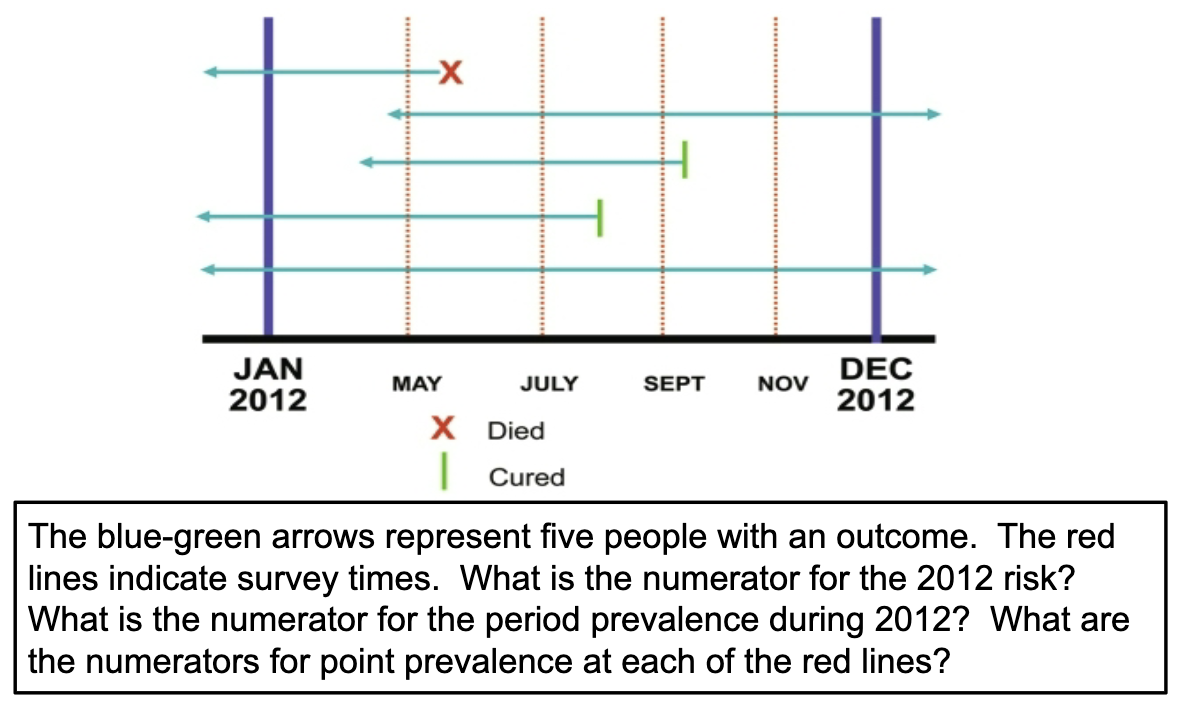
CI numerator is 2
Period prevalence numerator for 2012 is 5
Point prevalence numerators:
May = 5
July = 4
September = 3
November = 2
measures of disease frequency
prevalence, cumulative incidence, incidence rates
how do we compare measures of disease frequency?
by exposure status
why do we compare measures of disease frequency?
if disease occurs more often in one group than in another group, there is an association between the exposure and the disease
t/f: association = causation
NO
exposed group is also called
index group
unexposed/less exposed group is called
comparison/reference group
measure of association definition
comparison of measures of disease frequency
2 types of measures of association
absolute measure + relative measure
absolute measure
calculating the difference between two measures of disease frequency
relative measure
calculate the ratio of 2 measures of disease frequency
You are running late for an appointment, and you get stopped by a
police officer because you are driving 60 MPH in a 30 MPH zone.
How would the police officer describe the offense using absolute terms?
You were traveling 30 mph over the speed limit.
You are running late for an appointment, and you get stopped by a
police officer because you are driving 60 MPH in a 30 MPH zone.
How would the police officer describe the offense using relative terms?
You were traveling twice/double the speed limit.
t/f: all absolute measures of association have no units
false; P and CI have no units, but incidence rate is in person-time units
general formula for absolute measures of associations
RD = R(exposed) - R(unexposed)
what does it mean if RD = 0
There is no difference in risk between the exposed and unexposed groups.
what does it mean if RD > 0
The exposure is associated with an increased risk of disease.
what does it mean if RD < 0
The exposure is associated with a decreased risk of risease
absolute measure of association (Rexposed - Runexposed) is also called
attributable risk (AR)
The Nurses’ Health Study is a longitudinal cohort study of factors
that influence women’s health. NHS researchers investigated the
hypothesis that hypertension increases the risk of myocardial
infarction (MI). Among 13,422 women with hypertension, 117
had an MI over 10 years of follow-up. Among 106,541 women
without hypertension, 125 had an MI during the same follow-up
period.
Based on only this info, which type of absolute difference measure can we calculate?
risk difference
3 things to consider when interpreting risk difference
Focus on the excess disease in the exposed group
Specify comparison group
Specify time period
3 main relative measures of association
CI ratio (or risk ratio), IR ratio (or rate ratio), and odds ratio
relative measures of association tell us
how strongly an exposure is associated with an outcome; likelihood of developing the outcome
what does it mean if relative measure = 1
there is no association between exposure and disease
what does it mean if relative measure > 1
the exposure is associated with a higher risk of the disease.
what does it mean if the relative measure < 1 BUT > 0
the exposure is associated with a lower risk of the disease.
risk ratio (RR) estimates
how strong the association is between a given exposure and outcome
RR formula
[a / (a + b)]/[c / (c + d)]
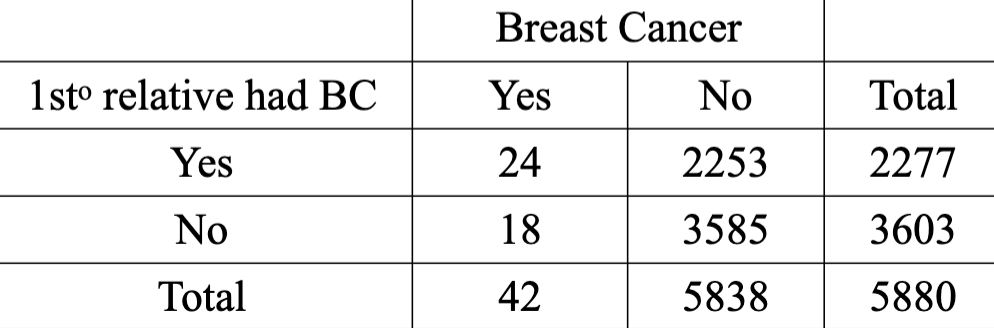
Calculate + interpret the RR
2.10
Women with a first-degree relative with a history of breast cancer are 2.1 times as likely to contract the disease over four years as women with a negative family history of breast cancer.
***you have to include the time frame !!
person-time incidence ratio (IR) formula
IR = [(a / P-Y1)] / [c / P-Y0]
***numerator is exposed and denominator is unexposed
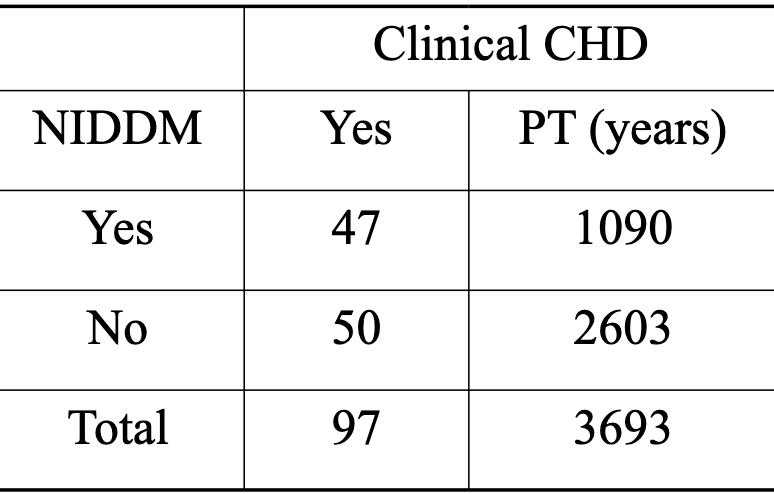
Calculate and Interpret the IR
2.24
Men 50-55 years of age with diabetes of at least 5 years duration are 2.24 times as likely to develop clinical CHD than men without diabetes.
Note
that since the IR is a rate, it’s considered the “instantaneous” rate of
change and no formal time period has to be given. However, for ease of
understanding the context if the IR, the time period is often given (here,
over 5 years).
odds ratio
the odds of having the outcome in the exposed divided by the odds of having the outcome in the unexposed
when do you use odds ratio
for studies not involving incidence or risk (usually cross-sectional and cross-control studies involve incidence and risk)
odds ratio formula
OR = ad / bc
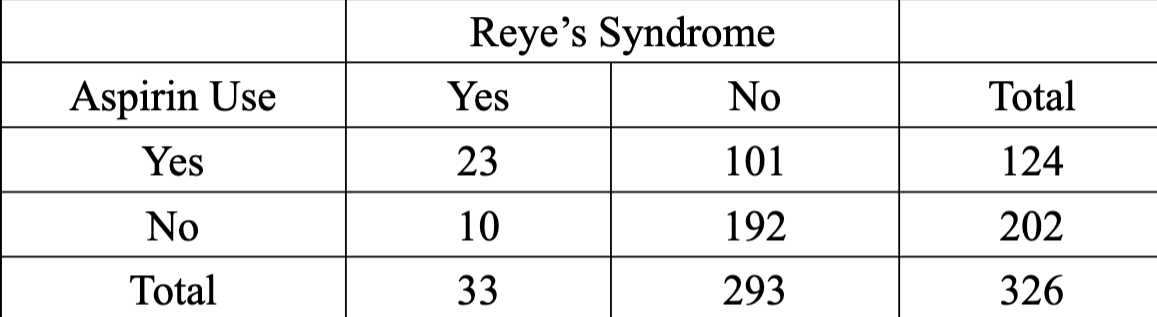
calculate and interpret the OR
4.37
The interpretation of the Reye’s syndrome
study OR is that children exposed to aspirin
during a recent viral illness were over 4 times
as likely to have (not contract or get or
develop) Reye’s syndrome as unexposed
children.