FSCI 4600 Final
1/40
There's no tags or description
Looks like no tags are added yet.
Name | Mastery | Learn | Test | Matching | Spaced | Call with Kai |
|---|
No analytics yet
Send a link to your students to track their progress
41 Terms
What is a DNA mixture and common sources
DNA mixture contain 2 or more individuals contribute DNA to the same sample, which makes the interpretation more complex than single source profile.
Commonly found on sexual assault evidence; touched objects; weapons; mixed biological stains
Real case work rarely gives you perfect DNA
different types of DNA mixture
Multiple Depositors: Two or more individuals physically deposit biological material at the same location
Low-level contributor: One contributor is present at a very low quantity, difficult to detect
Secondary Transfer: DNA is indirectly deposited require an intermediate surface
Not all contributors are equally visible
Factor that affect mixture detection
Numbers of contributors: More contributors = more peaks per locus
Contributor ratio: Unequal amounts = harder to see minor contributors
Allele Sharing: mask the true number of peaks
Total DNA Quantity: low input DNA causes amplifies stochastic effects
STR marker in Mixture Detection
STRs have many possible alleles
More variation = better ability to detect mixture
D18S51 - high diversity locus that makes the most informative markers for mixture interpretation (about 50 possible alleles)
TPOX about 15 possible alleles
Major VS. Minor Contributions in DNA Mixtures
Major Contributor- individuals who contributed more DNA
Minor contributor - individuals who contributed less DNA
Determine by observing peak heights (RFU) in the electropherogram.
Major- Taller peak and more consistent across loci
Minor-Shorter peaks, missing alleles
Mixture ratios
Estimate the mixture ratio - the relative amount of DNA each person contributed
Large differences in peak height = Larger major : Minor Ratio
5:1 Noticeably smaller peaks present- causes minor still detectable interpretation
10-20:1 some minor peaks missing - causes allele dropout
Detection depends on Peak height (RFU thresholds)
If you do not see the minor contributor, it does not mean they are not there.
How do we recognize a DNA Mixture
More than TWO peaks at a Locus. A single person can have at most 2 alleles per locus. 3 or more peaks indicate multiple contributors are present
Peak height imbalance (heterozygote imbalance). A single source profile deliver a similar in height profile. If one peak is much lower ( about 70% of its pair) may indicate a minor contributor.
Unusually Large Stutter Peaks. Stutter peaks are typically (10-15% or the parent peak). Too large could be a true allele from another contributor.
Heteroygote Balance in single source sample
Small peak / Large Peak > 70% indicates a single source profile
if the ratio is below 70%, indicates mixture; degradation; Inhibition
Stutter peak VS. Mixture peak
Normal stutter peak: small; <10-15% of the main peak; Always appears in a predicable position (n-1)
Mixture peak: Looks like stutter but larger
Not all small peaks are stutter artifacts.
Stutter can hide or mimic minor contributors, making mixture interpretation more difficult
Two person mixture pattern
4 peaks- no shared alleles, clearly a mixture
3 peaks- one peak taller than others, one shared allele
2 peaks - both shared alleles, looks like a single source
1 peak - Same homozygous genotype, indistinguishable from single source
Always consider peak height differences and ratios
Steps approach to mixture interpretation
Is it a mixture? more than 2 peaks at a locus; big peak height ratio; Unexpected allele patterns
Label the peaks: above analytical threshold
How Many contributors. Max alleles / 2 = minimum contributors
Who is Major and Minor, Tall peaks and shorter peaks
What genotype combination make sense
Compare to known profiles
Estimating Number of Contributor
Look across all loci, find the locus with the most alleles
Minimum contributors = Mix # of
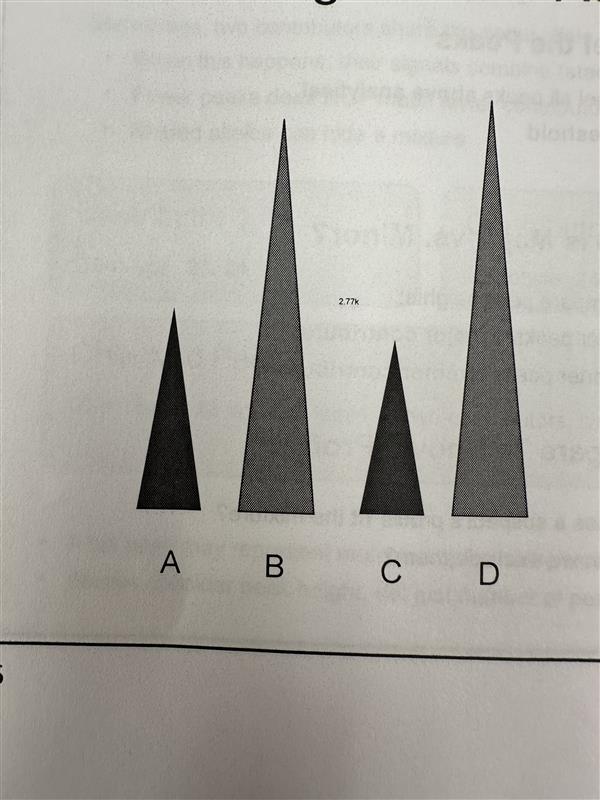
Calculating Mixture Ratio
Major contributor (B+D)
Minor contributor (A+C)
Ratio = (B+D) / (A+C) = 2.3 : 1
Round to approximately 2:1 - The major contributor contributes roughly twice the DNA of the minor contributor
Challenges in Mixture interpretation
Allele Sharing
Three or More contributors - increases genotype combination possibilities
Low Template DNA
Stochastic Effect
Degradation and Inhibition
Probabilistic Genotyping
It uses continuous statistical models
Peak Heights
Allele Dropout
Stutter
Number of Contributors
STRmix Software
It is important because it uses real forensic labs, accepted in courts and helps analyze mixtures that are too complex to interpret manually
It tests millions of possible genotype combinations and uses the entire electropherogram. Accounts for peak height, dropout and stutter
STRmix preform interpretations faster, more consistently and with statistics
Single Nucleotide Polymorphisms (SNPs)
A single base change in DNA occurs at a specific location
Small change, but very important
Why dose SNP matter
There are so many of them
Extreme Abundance: every 1000 bp
Genome-Wide Coverage - located across all chromosomes
Give a big picture of DNA
Technology Enables: Next-generation sequencing (NGS) panels
SNP vs. STR
STR: Repeat length, Often 10+ per locus, high distinguish power, length (100-400+ bp), stutter artifacts: present complicates interpretation. Databases: CODIS, NDNAD
SNP: Single nucleotide substitution. only 2 bi-allelic, Lower discrimination power on one locus, Very small (<100bp), no stutter artifacts, clear signal, No standard forensic databases.
The Bi-Allelic Nature of SNPs
SNPs are Bi-Allelic: Most SNPs have only 2 alleles
3 possible genotypes AA/AG/GG
What does this mean? Only 2 alleles - less variation per SNP
A single SNP is less informative. Analyze many SNPs together
Why use SNPs in Forensics
Degraded DNA: fragments <100bp, works for DNA that is old, damaged or broken
High Multiplexing Capacity: hundreds of SNPs in one test
SNPs are especially useful when DNA is damaged or limited
Advantages of SNPs
Small DNA Fragments: works with < 100bp DNA; Ideal for degraded samples
Slean Results: artifact-free signals; Easier to interpret than STRs
Automation-Friendly: Can analyze many samples quickly, highly reproducible
More than Identification: Can predict eye color, hair color and ancestry.
Disadvantages of SNPs
Low power per marker
Need many SNPs, 50-100+ markers; more cost
Mixtures are Harder- Limited variation and difficult to separate contributors
Limited Databases
How many SNPs are needed
25-45 minimum estimate for matching the discrimination power for standard CODIS
50-100 typical range used in forensic SNP panels
~1000 between SNPs
SNP Typing methods
Commonly used: Direct sequencing, reads the actual DNA sequence. Use NGS
Primer Extension (SNaPshot) targets specifc SNPs
Less commonly used: Microarrays and pyrosequencing
SNaPshot: Mini-sequencing
A method to identify SNP alleles and looks at one base in DNA
DNA region is amplified (PCR), primer binds next to the SNP, One base is added (ddNTP) and that base is fluorescently labeled.
Each base=different color
SNaPshot reads only one base. Color = SNP allele
SNaPshot protocol
PCR - Clean up extra primers and ddNTP - Extension add one base - electrophoresis (read color)
Reading SNP results
Each peak = a base (ATCG), each color = a different base
One peak = homozygous; Two Peaks = Heterozygous
SNP applications in Foresncis
Degraded DNA Analysis
Ancestry informative Markers (AIMs): SNPs vary between populations
Forensic Phenotyping: predict physical traits
SNPs in Degraded Samples
Historical and Archaeological Remains: bones, teeth and mummified tissues
Mass Disaster ID: Plane crashes, fires and natural disasters
SNPs and Ancestry Inference
Some SNP different between populations
Called Ancestry Informative Markers
Compare DNA to population databases
Limitations of using SNP and AIMs
The result represents statistical probabilities
The human population exists on a continuum
An admixed individual presents challenges for classification algorithms
Result for investigative leads only
Ethical and legal frameworks
Phenotypic Prediction from SNPs
Forensic DNA phenotyping (FDP) uses validated SNP panels to predict externally visible characteristics
Eye color- IrisPlex system uses 6 SNPs to predict eye color above 90% accuracy
HIrisPlex system hair color determination
Skin tone- HIrisPlex-S system adds skin color prediction
Other Biallelic Markers
Indels- Insertion/ Deletion Polymorphisms: Small DNA changes 1-10bp, slightly larger than SNPs
Alu element Plymorphisms - Large DNA insertion ~300bp. Used for ancestry/population studies
Next Generation Sequencing (NGS)
It reads the whole book
NGS-AKA Massively Parallel Sequencing (MPS) is a transformative technology that reads the actual DNA sequence directly, rather than measuring the size of DNA fragments as traditional capillary electrophoresis does.
Actual Sequence
Massively Parallel- looks at thousands of millions of DNA pieces
Sequence vs. Size, the exact sequence.
STRs vs. NGS
STR measures fragment size, detects ~ 20 loci, Make one type, Struggle with degraded / Low DNA, provide limited information
NGS- Actual DNA sequence, Thousands of loci, Multiple marker types, Works well with challenging samples
Much more detailed informaiton
NGS Overview
Fragment DNA
Add adapters- barcodes
Amplify DNA make thousands of copies
Sequence DNA, each base gives a detectable signal
Analyze Data
What can NGS analyze
STRs; SNPs; mtDNA; Whole Genome
Why NGS is Powerful in Forensics
Challenging Samples
Multi-Marker Efficiency
More detailed Results: Higher discriminatin power and helps with mistures
Use of NGS
Complex mixtures; Missing Person; Ancestry Inference; Phenotyping
Limitations of NGS
High Cost
Complex Bioinformatics
Validation Requirements
Uneven Adoption
NGS is one of the most powerful tools ever introduced to forensic genetics. Greater data complexity means greater potential for misinterpretation.