Anthropometric Assessment
1/64
There's no tags or description
Looks like no tags are added yet.
Name | Mastery | Learn | Test | Matching | Spaced | Call with Kai |
|---|
No analytics yet
Send a link to your students to track their progress
65 Terms
Which method would give us the best estimate of usual intake of fruits and vegetables?
dietary screener focused on citrus consumption by season
validated 12-month food frequency questionnaire
two 24-hour dietary recalls in the same week
observed, weighed food record conducted by trained enumerator
validated 12-month food frequency questionnaire
Which of the following are true about 24-hour recalls?
may be affected by ability of participant to recall their foods and beverages
provide more accurate estimates of total energy and nutrient intake
generally unaffected by social desirability bias (bias that comes from the idea that some food choices are more healthy)
all of the above
first two options only
first two options
What is anthropometry?
measurement of body size, weight, and proportions
What is anthropometry used to assess (3)?
physical growth in relation to appropriate reference data
nutritional status (especially related to obesity/wasting)
body composition using predictive equations
What are the advantages for anthropometry for nutritional assessment (2)?
techniques are simple, safe, inexpensive, and easy to train people to take them
equipment is relatively inexpensive and portable
What are the limitations for using anthropometry for nutritional assessment (3)?
not specific to particular deficiencies or excess intake
not sensitive to recent changes in nutritional conditions
must be interpreted in context (need to have a reference population to compare them to or knowledge of individual history in terms of their weight)
Why are anthropometric measures important in children?
in general helps to assess malnutrition or over nutrition in children and they have major developmental milestones during this life stage, making it even more important
wasting (low weight for length) → associated with increased risk of mortality and infectious illness
stunting (low height for age) → associated with increased risk of infectious illness, mortality, poor cognitive development, low school performance, and lower earnings among adults
overweight (high weight for length)→ greater risk for obesity, diabetes, and other chronic diseases
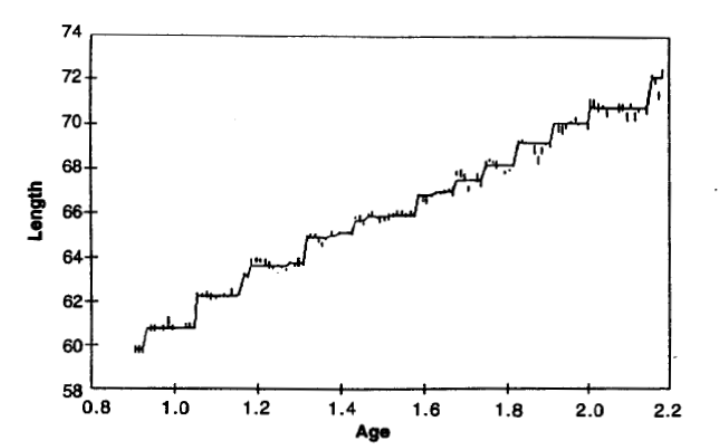
Describe the way children grow.
saltatory growth (grows in jumps)
infants grow in spurts (up to 2.5 cm/day)
growth occurs in sleep (sleep more during growth spurt days)
can be other periods where they have no measurable growth
weight and head circumference track alongside with length growth saltations
Where does infant/children growth occur?
at the growth plates in the long bones
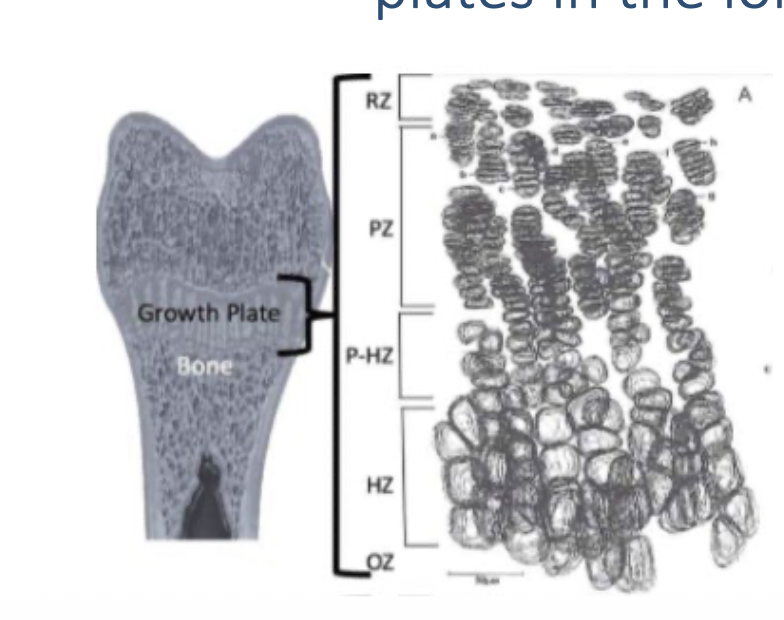
How many activity zones are within the growth plates?
5 activity zones
Describe the activity in the growth plate along the long bones in growing children/infants.
cells in the growth plates transition from resting state (RZ) → proliferative (PZ) → hypertrophic state (HZ) → ossification zone (OZ) which is where mineralization occurs
requires a good amount of nutrients to occur
What is a nutritional deficiency known to limit growth?
Vitamin D deficiency
can act as a nuclear hormones receptor ligand, impacting nuclear transcription if there is not enough
can result in rickets
What other nutritional deficiencies besides vitamin D are known to limit growth (7)?
Ca
Zn
I (iodine)
Protein
Energy
Indirect Pathways (biological stress, immune function, inflammation, growth hormone production)
excess nutrients (ex. iron)
What other factors impact growth (3)?
frequent/chronic infections
malabsorption conditions
stress
What is stature?
distance from the crown of the head to the heel, either standing or lying down
< 24 months age: recumbent length (laying down)
> 24 months age: standing height
What tools are used to measure stature (2)?
length board
stadiometer
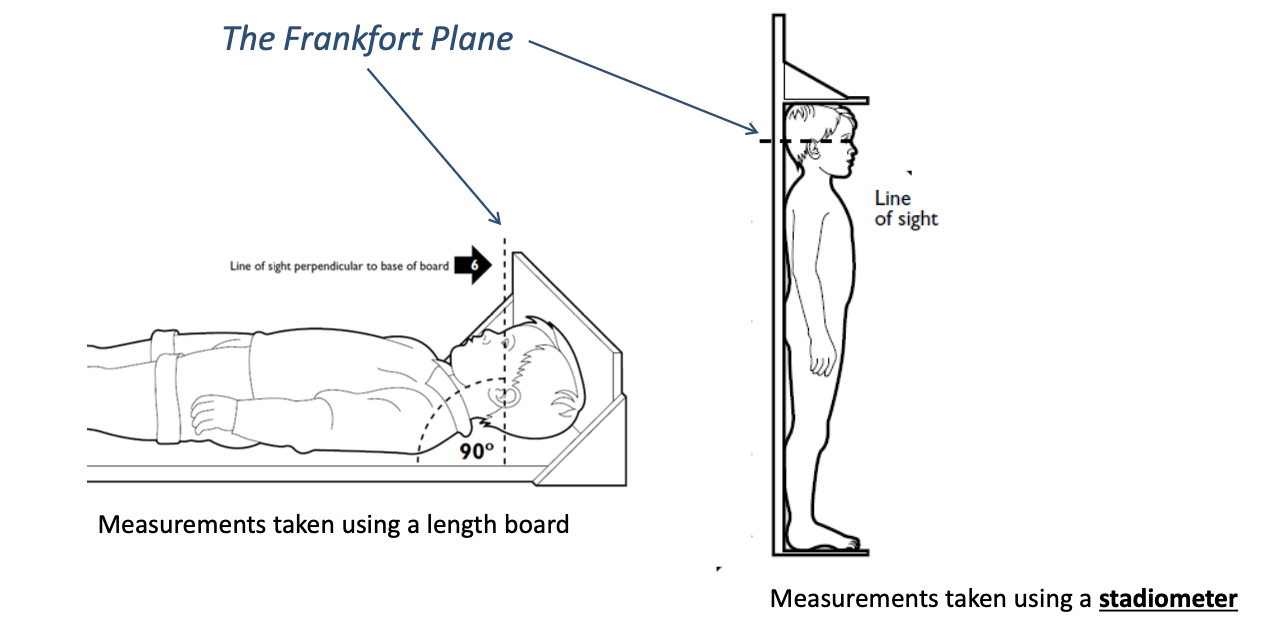
What is the Frankfort plane?
reference line used to standardize head positioning during measuring their stature
What does weight measure?
measures total body mass of all body compartments (fat, bone, body water, muscle)
Why do we measure head circumference?
it is an indicator of brain size and development in infants
growth charts are available to monitor trends
less prone to measurement errors compared to recumbent length
What is MUAC?
mid-upper arm circumference
reflects the size of the muscle, adipose, and bone tissue
low MUAC may reflect wasting/acute malnutrition
What are five sources of random errors that can occur during anthropometry?
inconsistent measurement techniques
instrument precision
movement artifacts (breathing) and subject positioning
variation in stomach, bladder, or bowel contents
prandial variation (recent meals)
What can we do to fix/mitigate the five sources of random errors that occur during anthropometry?
inconsistent measurement techniques → train and standardize anthropometrists
instrument precision → use high quality measurement instruments
movement artifacts, subject positioning → use consistent methods to position subjects and always wait until the subject is calm
variation in stomach, bladder, or bowel contents → measure individuals after a fast or after voiding
prandial variation → measure individuals in fasted state
What are three sources of systematic errors in anthropometry?
improper measurement techniques
equipment bias
diurnal variation
What can we do to fix/mitigate the three sources of systematic errors in anthropometry?
improper measurement techniques → train and standardize anthropometrists
equipment bias → calibrate instruments frequently, maintain instruments in good condition
diurnal variation → measure all subjects at the same time of day
What are anthropometric indices?
combinations of 2 measurements of body size OR 1 measurement of body size relative to age
help to provide context if someone wants to understand how well their child is growing
What are common anthropometric indices? (4)
BMI
weight for age → underweight
height for age → stunting
weight for length → wasting
Are the BMI values used as a reference for adults >20 years old the same or different for kids?
different
BMI (weight in kg)/(height in cm)2 is used as a indicator of overweight or thinness
in children BMI for age is an index used to evaluate child growth
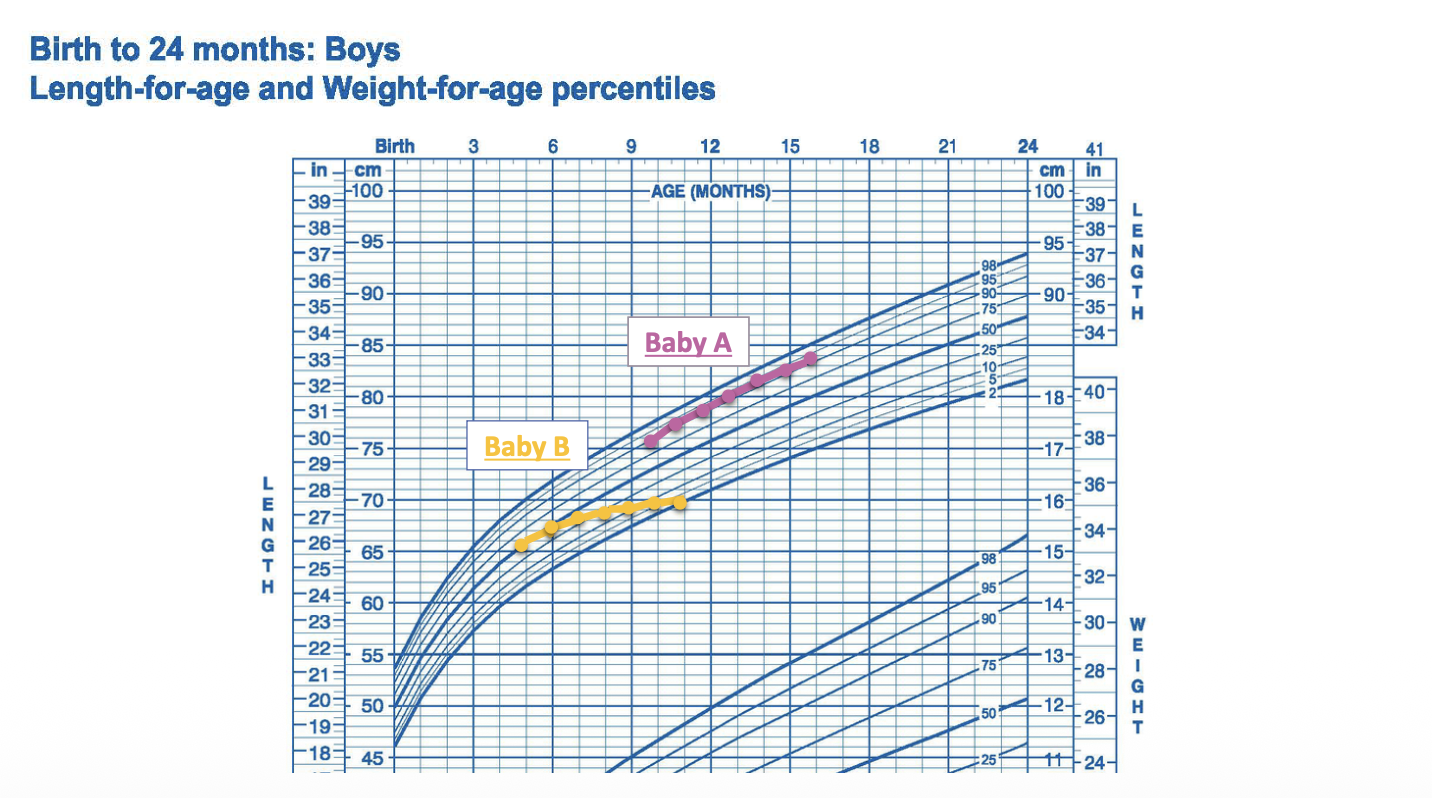
What are some characteristics surrounding growth charts?
separate charts for girls and boys
made by either by WHO or CDC
What indices do the CDC growth charts for children 0-36 months include? (4)
weight for age
height for age
weight for height
head circumference for age
What indices do the CDC growth charts for children 2-20 years include? (3)
weight for age
height for age
BMI for age
What are percentile?
rank the position of an individual on a particular reference distribution
percentile represents the percentage/extent in which one has more or the same value compared to the reference population
ex: a child of a given age and sex whose BMI falls on the 90th percentile line has a BMI the same or more than 90% of the reference population children of the same age and sex
What is a growth reference?
data on the characteristics of a well-defined population
indicates “what is” not “what should be”
ex: CDC growth reference
What is a growth standard?
data on the characteristics of a selected population
indicates “what should be” not “what is”, implying something desirable
ex: WHO growth standards
What is the CDC growth reference based off of?
data from NHES and NHANES in the US (5 cross sectional sounds of data collection over 30 years) (2000)
newer data from NHANES was excluded for older children due to growing obesity epidemic
typically racially and ethnically diverse
contains information on breastfed vs non-breastfed infants
What are the WHO growth standards based on?
data collected from 6 countries (2006)
based on “prescriptive” feeding practices and risk factors
longitudinal data collected on children from birth to 2 years and 2-5 was cross-sectional data collection
all families had good access to health care
What six countries were used for data collection in order to help create the WHO growth charts?
Brazil
Ghana
India
Norway
Oman
United States
linear growth was nearly identical among children in all 6 countries
What are the two different CDC growth reference charts?
0-36 months
2-20 years
What are the two different charts for the WHO growth standards?
0-5 years
5-18 years
Which growth chart (CDC vs WHO) are used in the US for one that is 0-2 years old? 2-5 years old? 5-20 years old?
0 - 2 → WHO
2 - 5 → CDC
5 - 20 → CDC
Which growth chart (CDC vs WHO) are used in other countries for one that is 0-2 years old? 2-5 years old? 5-20 years old?
0 - 2 → WHO
2 - 5 → WHO
5 - 20 → varies (some have country specific charts whereas some continue to use WHO charts made for 5-18 year olds)
What is the CDC Extended BMI-for-age growth chart?
a different BMI-for-age growth chart that extends farther than the 97th percentile to allow for the close monitoring of obesity as the obesity prevalance had increased since 1980 (when the first chart was made)
What indicator and cutoffs are needed to interpret someone as underweight?
indicator: weight for age
cutoff: < 3rd percentile
What indicator and cutoffs are needed to interpret someone as having stunted growth?
indicator: height/length-for-age
cutoff: < 3rd percentile
What indicator and cutoff is needed to interpret children 0-2 years old as wasting?
indicator: weight-for-height/length
cutoff: < 3rd percentile
What indicator and cutoff is needed to interpret children 2-20 years old as being overweight?
indicator: BMI for age
cutoff: ≥ 85 and < 95th percentile
What indicator and cutoff is needed to interpret children 2-20 year old as being obese?
indicator: BMI for age
cutoff: ≥ 95th percentile
What is the distinction between size and growth?
attained size: product of prior nutritional experience and not reflect recent events as it is a static measurement
growth: changes in body size during an interval of time and thus reflects nutritional conditions during that time as it is a dynamic measurement
Is growth or size a more sensitive indicator of recent nutritional status?
growth
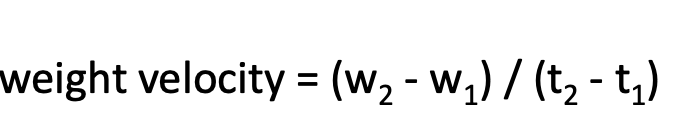
What is growth velocity?
change in weight or height per unit time
How would you interpret growth velocity on a growth chart?
if it tracks on one of the percentiles then that is typical, anything that deviates/crosses percentile lines will be considered deviating from the norm
How do you calculate the z-score? In terms of anthropometry, what is it used for?
(actual value - expected value aka the mean)/SD
tells us the number of standard deviations below or above the reference median
What indicator and z-score cutoff would consider one underweight?
indicator: weight for age
cutoff: z score < -2
What indicator and z-score cutoff would consider someone stunting?
indicator: length for age
cutoff: z score < -2
height for age z-score = HAZ
What is a common way to assess childhood malnutrition?
height for age
low HAZ indicates that a child has failed to reach their growth potential
What is a particular trend that we are seeing in regard to height for age z-score (HAZ)?
at the population level, there have been HAZ declines from birth to 24 months in many low income countries (Latin America, Sub-Saharan Africa, Asia)
What indicator and z-score cutoff would consider someone as stunting?
indicator: weight for length
cutoff: z score < -2
What are the mid-upper arm circumference cutoffs to consider < or equal to 5 year olds normal, moderate wasting, and severe wasting?
normal = > 12.5 cm
moderate wasting = 11.5 - 12.5
severe wasting = < 11.5
Rank the relative sensitivity of six anthropometric indicators to acute change in nutritional status.
MOST SENSITIVE
weight velocity
weight for length
arm circumference
skin-fold thickness
weight for age
length for age
What are two clinical diseases related to severe malnutrition?
marasmus
kwashiorkor
What is marasmus?
protein and energy deficiency
symptoms include protruding bones, ribs, spine, and loose baggy skin
What is kwashiorkor?
protein deficiency
symptoms include bilateral pitting edema, protruded belly, scaly skin, thin or brittle reddish hair, loss of hair, loss of appetite, and irritability
Children with severe wasting have how much higher risk of death comapared to children of normal weight for length?
11.6 times higher risk
most risk is due to deaths from infectious causes such as respiratory infections or diarrhea
What are three indicators of acute malnutrition?
weight for height z-score < -3 (severe wasting)
MUAC < 11.5 cm (severe wasting)
bilateral edema
presence of any one of these signs in a child is an indication that urgent action is needed
What factors are leading to marasmus or kwashiorkor?
acute food shortage (famine, extreme drought, sever food insecurity)
persistent or sever diarrhea
infections or chronic diseases (HIV, tuberculosis, cancer)
Overall, is there any global improvement in terms of stunting, wasting, and overweight people?
amount of those wasting and or stunting have decreased
overweight percentages are increasing globally