Research method modules
1/33
There's no tags or description
Looks like no tags are added yet.
Name | Mastery | Learn | Test | Matching | Spaced | Call with Kai |
|---|
No analytics yet
Send a link to your students to track their progress
34 Terms
Introduction to psychological research methods
Its always important to think critically about claims
Psychology is an evidence-based discipline
This evidence comes from research
Research studies follow a process
Constructs
Intangible, abstract attributes that are theorised to underlie observable behaviour. They are not directly observable or measureable
Operational definition
The process of defining and measuring an unobservable construct indirectly
Research questions
The research process begins with a question
Research questions are broad ideas tha typically ask about either association, difference, or causation
Hypotheses
Logical, specific, testable, refutable, and predictive statements about what will happen in a psychological research study
Variables and measurement
Variables are operationalised by using a measure in psychological research
There are two types of variables: continous and discrete
The scale of measurement is determined by the measure used
There are four scales of measurement: nominal, ordinal, interval, and ratio
Continous variables
Allow for decimals/fractional values to be obtained between points on a scale. Eg distance, weight, time, etc
Discrete variables
Seperate indivisible categories, where values cannot meaningfully exist between points on a scale (whole numbers). Eg. number of people in a family
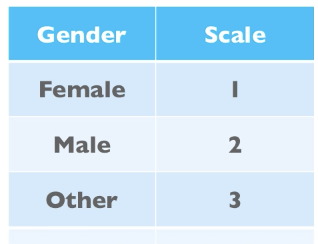
Nominal scale
Involves measurement based on a set of categories (categorical).
There is no ordering, and different values do not indicate differences in magnitude, they just indicate membership to different categories.
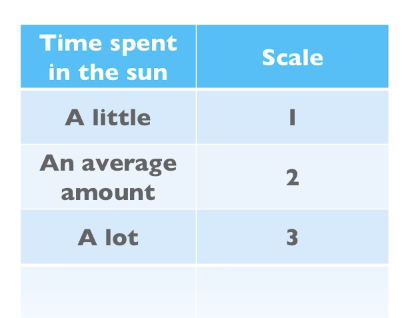
Ordinal scale
Values are assigned to indicate an order
The scale does not, however, tell you the magnitude of the difference between points on a measurement scale
Eg. first, second, third place indicating order of arrival at the finish line in a running race. However, do not tell you the actual times/the difference between these times.
Interval scale
Numbers indicate an actual amount of something present,
Equal units of measurement seperate two scores on a scale
There is not a real zero (0 doesn’t mean the absence of something - it’s arbitrary)
Eg temperature indicates the amount of heat precent but 0 degrees celcius does not indicate that there is 0 heat.

Ratio scale
Numbers indicate an actual amount of something
Equal units of measurement seperate two scores on a scale
There is a real 0
Eg. if a ruler measures 0m, it indicates an absence of length/distance etc
Descriptive research design
Concerned with the measurement and description of the natural state of individual variables as they are experienced by a certain group of people
There is no experimentation and nothing is manipulated
The focus is on observation only
Eg measuring the heights of students in your class and making descriptions on what was typical by an average
Eg measuring the prevalence of students sick with colds and/or flues in your class during the winter
Correlational research design
Concerned with the investigation of the relationship between variables
no experimental manipulation
Variables are observed as they naturally exist
and the presence of an association between the variables is assessed.
Each participant in correlational research must provide information regarding two variables
Relationship → the values on one variable are systematically and predictably accompanied by changes in another variable
Cannot make determinations about cause and effect/ which variable influences the other in the relationship
Could be a third variable that explains causation in the relationship.
Eg. correlation between time spent exercising and happiness questionnaire score
Experimental research design
Concerned with determining cause and effect in a relationship between variables
Involves manipulation of the hypothesised independent variable in a relationship
Involve carefully controlled experimental conditions to increase internal validity (degree of confidence in the relationship). Decreases the likelihood of confounding variables influencing results.
The most common sampling is random
Quasi-experimental designs
Investigate cause and effect relationships
Usually the independent variable is a characteristic/demographic
No random allocation to groups
Limits ability to control for confounding variables
Non-experimental research designs
Demonstrate the relationship between variables
Do not attempt to explain cause and effect
Involves the observation of two or more groups (eg arts and science students) and one variable (eg IQ)
Different to correlational design as there is one variable being observed
Focus on comparing groups
Population
Everyone of relevance to a research question/study
Probability sampling
Population characteristics are known
Eg quota sampling
Non-probability sampling
Unknown population characteristics
Eg convenience
NHMRC ethical considerations
Merit
Integrity
Justice
Beneficence
Respect
Merit
Research that is justified by its potential benefits to humanity
Scientifically sound (likely to achieve its aims)
Psychological researchers review relevant literature to asses the likely merit of a given study
Integrity
The research has been undergone according to well founded principles of research conduct
Research has been reported honestly and ethically
Justice
Ensure that the inclusion and exclusion of research participants is fair and equitable
No burden is placed on a particular participant group
Participants are not exploited in any way
There is fair and equitable access to the benefits of the research
Beneficence
Risks and benefits are considerd
Research should involve benefits to participants/community that should justify any risk or discomfort to participants
When designing a study, it is imperative that any risks involved with participation are minimised and clearly explained to participants prior to their involvement with the study (informed consent)
Respect
Respectful research practice holds respect for the value of research participants and of their culture, beliefs, and welfare.
Researchers must respect the privacy and confidentiality of participants
Must empower participants to feel control over their participation and the data they have contributed to the study (can remove themselves + data).
We can represent a frequency distribution in various ways, including:
Frequency histogram
Frequency table
Boxplot
Central tendency
What is most representative in a distrubution
Variability
How scores in a distribution differ or not
Measures of variability
Range
IQR
Standard deviation
Standard deviation for a sample
The average amount that scores differ or deviate from the mean
Calculating standard deviation
Sum of squares (solves problem of negative scores)
Variance (sum of squares divided by one less than sample size)
Standard deviation (square root of the variance)
Deductive argument
Valid
Conclusion necessarily follows from premise/s
Broad (eg theory) → specific (eg hypothesis)
Inductive arguments
Strong
Premises provide good support for the conclusion
Specific observation (eg study results) → general explanation (eg theory)