Statistics: Measures of Central Tendency, Dispersion, Skewness, and Boxplots
1/158
There's no tags or description
Looks like no tags are added yet.
Name | Mastery | Learn | Test | Matching | Spaced | Call with Kai |
|---|
No analytics yet
Send a link to your students to track their progress
159 Terms
What symbol is used to denote summation in statistics?
Σ (capital Greek letter sigma)
What does the summation notation ΣXi represent?
It represents the sum of all values from X1 to Xn.
How do you express the total weight of five students using summation notation?
∑5i=1 Xi = X1 + X2 + X3 + X4 + X5.
What is the total weight of the five students with weights 110, 90, 105, 120, and 115 pounds?
540 lbs.
What is a measure of central tendency?
A single value that represents the center of a distribution.
What are the most commonly used measures of central tendency?
Mean, median, and mode.
How is the arithmetic mean calculated?
By dividing the sum of all values by the total number of elements.
What is the formula for the sample mean?
¯X = ∑N i=1 Xi / n.
What is the population mean denoted by?
The lowercase Greek letter μ.
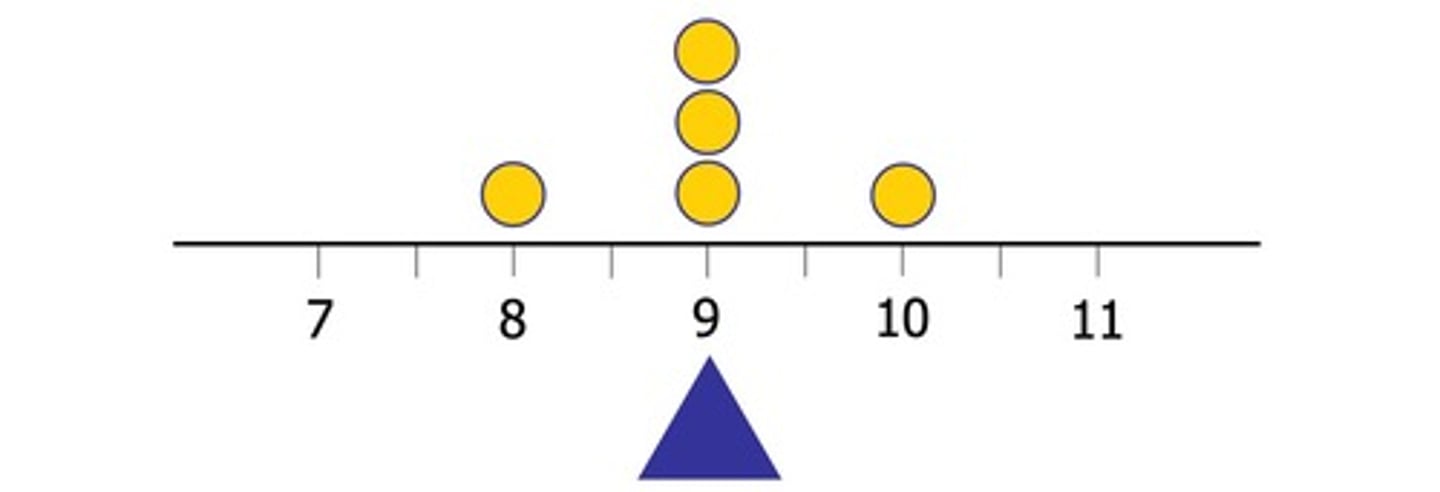
How do you calculate the mean score from judges' scores of 8, 9, 9, 9, and 10?
(8 + 9 + 9 + 9 + 10) / 5 = 9.
What is the mean weight of cereal cartons weighing 256.1, 255.2, 255.0, 255.3, 255.9, 256.2, 255.8, and 255.4 grams?
255.11 grams.
What effect do outliers have on the arithmetic mean?
Outliers can significantly skew the mean away from the majority of the data.
What is an example of an outlier affecting the mean?
If the last salary in a list is 1000 instead of 10, it pulls the mean higher.
What is the formula for calculating the mean from a population?
μ = ∑N i=1 Xi / N.
What does the index of summation indicate?
The counter that specifies which term of the summation is being considered.
What is the lower limit of summation?
The starting integer for the index of summation.
What is the upper limit of summation?
The final integer for the index of summation.
What does the notation ∑n i=1 (Xi + Yi)² indicate?
It does not equal ∑n i=1 Xi² + ∑n i=1 Yi².
What is the significance of the index set in summation?
It is the collection of integers from the lower to the upper limit.
What does it mean if the summation of a constant over an index set equals the product of the constant and the number of terms?
c ∑n i=1 1 = nc.
What is the formula for the summation of the product of a constant and a variable?
c ∑n i=1 Xi = c ∑n i=1 Xi.
What is the result of summing the difference of two terms?
It equals the difference of their individual summations.
What happens to the mean if all values are close together?
The mean is a good representative of the values.
What is the index in the summation notation ∑3 j=1 Yj²?
The index j runs from 1 to 3.
What does the notation ∑n i=1 (Xi - i) represent?
The sum of the differences between each Xi and its index i.
What is the result of the summation of a constant over the index set?
It equals the product of the constant and the number of terms.
What is the arithmetic mean?
The arithmetic mean is the sum of all observed values divided by the number of observations.
How is the mean affected by outliers?
The mean is gravely affected by outliers, which can pull the mean away from the center.
What is the median?
The median is the middle value of an ordered data set, dividing the array into two equal parts.
How do you find the median if the number of observations is odd?
If the number of observations is odd, the median is the middle element of the ordered data set.
How do you find the median if the number of observations is even?
If the number of observations is even, the median is the average of the two middle elements.
What is the interpretation of the median?
At least half of the observations are less than or equal to the median, and at least half are greater than or equal to the median.
What is the mode?
The mode is the value in a data set that occurs most frequently.
How can the mode be used in data analysis?
The mode can be used for all levels of measurement — nominal, ordinal, interval, and ratio.
What does it mean if a data set is multimodal?
A data set is multimodal if it has multiple values that occur with the highest frequency.
What is an example of how to calculate the mean?
For salaries of P9,500, P10,200, P9,000, P10,500, and P60,000, the mean is P19,840.
Why is the median a better measure of central tendency in certain scenarios?
The median is better when the data set contains outliers, as it is not affected by extreme values.
What is the formula for calculating the median when the number of observations is odd?
Md = X(n+1)/2, where n is the number of observations.
What is the formula for calculating the median when the number of observations is even?
Md = (X(n/2) + X(n/2 + 1))/2.
How do you determine the mode from a frequency distribution?
The mode is the value with the highest frequency in the distribution.
What is the significance of the median in data interpretation?
The median indicates the center of the data set and is less influenced by outliers.
What is the median of the following data set: 1.3, 4.7, 6.6, 7.3, 10.5, 12.6, 50.7?
The median is 7.3 million pesos.
What is the median of the following years of operation: 9, 11, 12, 16, 17, 20, 18, 19?
The median is 16.5 years.
What does it mean if a data set has no mode?
It means no value occurs more frequently than others.
What is the mode of the civil status data of 24 employees: Single, Married, Single, Separated, Single, Married?
The mode is Single, as it has the highest frequency (14).
What is a characteristic of the mode?
The mode is not affected by outliers and is always one of the observed values.
What is the relationship between the mean and median in the presence of outliers?
The mean can be significantly higher or lower than the median when outliers are present.
How does the median handle tied values in the data set?
The median can still be determined even if there are tied values.
What is the mean of the following salaries: P9,500, P10,200, P9,000, P10,500, P60,000?
The mean is P19,840.
What is the median salary for the same data set?
The median salary is P10,200.
What is the mode in a data set?
The mode is the value that appears most frequently in a data set.
How is the mode interpreted in quantitative and qualitative data?
The mode can be used for both quantitative and qualitative types of data.
Why is the mode not always a good measure of central tendency?
The mode may not represent the central tendency well, especially if it is at the extreme end of the values.
What are measures of location in statistics?
Measures of location provide information on the percentage of observations that are less than or equal to a certain value.
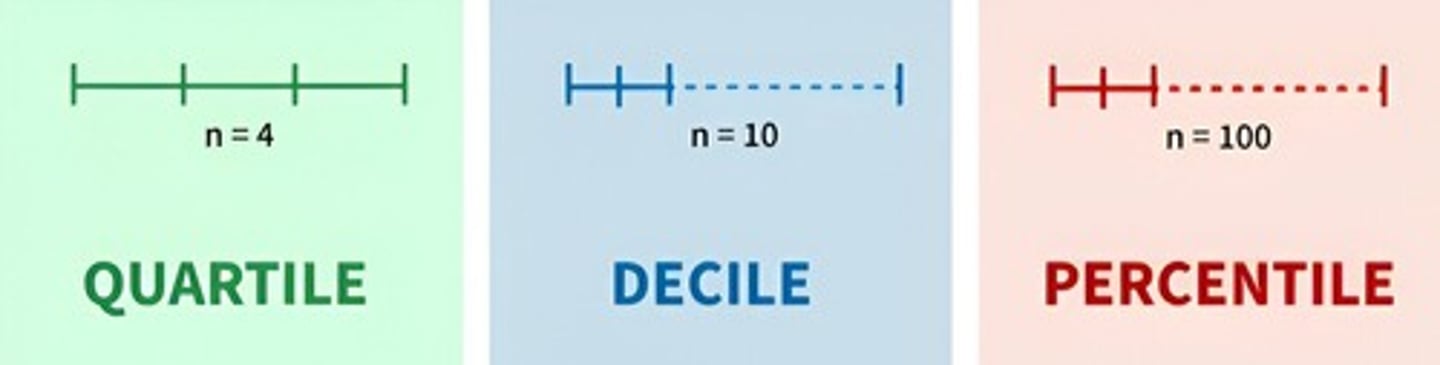
What are percentiles?
Percentiles divide the ordered observations into 100 equal parts.
What do deciles represent?
Deciles divide the ordered observations into 10 equal parts.
What do quartiles divide the data into?
Quartiles divide the ordered data into 4 equal parts.
What does it mean to be in the 90th percentile?
Being in the 90th percentile means that 90% of the observations fall below your score.
How is a percentile score different from a percentage score?
A percentile score indicates your relative rank compared to others, while a percentage score shows how much you got right out of the total.
What is the formula to find the kth percentile?
Pk = X(j) + g(X(j+1) − X(j)), where j is the integer part and g is the fractional part.
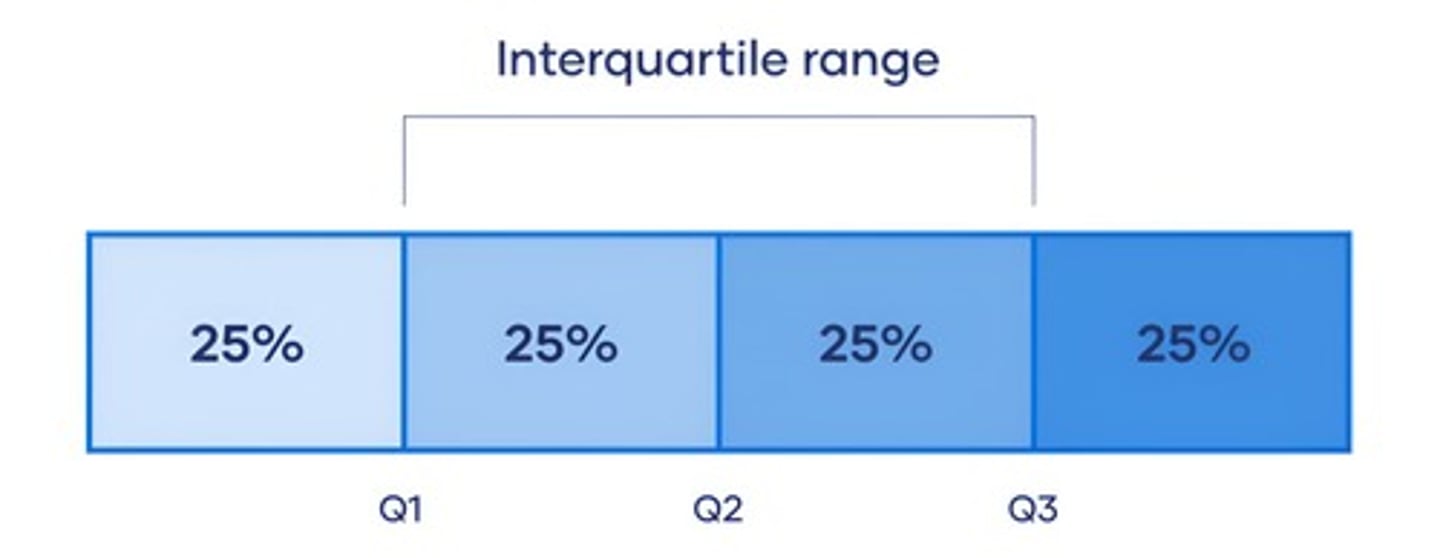
What does Q1 represent in quartiles?
Q1 represents the 25th percentile, where at least 25% of values are less than or equal to it.
What does Q2 represent in quartiles?
Q2 represents the 50th percentile, also known as the median.
What does Q3 represent in quartiles?
Q3 represents the 75th percentile, where at least 75% of values are less than or equal to it.
How do you calculate the 90th percentile for a data set?
Arrange the data in ascending order, compute (n + 1)k/100, and use linear interpolation if necessary.
What is the formula for calculating deciles?
Dk = P(k*10), where k is the decile number (1 to 9).
How many interior percentiles are there?
There are 99 interior percentiles, denoted as P1, P2, ..., P99.
What is the significance of the integer and fractional parts in percentile calculation?
The integer part indicates the position in the ordered data, while the fractional part is used for interpolation.
What does it mean if a score is at the 40th percentile?
It means that 40% of the scores are less than or equal to that score.
How do you interpret a percentile score of 95.5?
At least 95.5% of all scores are less than or equal to this score.
What is the first step in finding a percentile score?
Arrange the observations in ascending order.
What does the notation X(i) represent?
X(i) represents the ith ordered observation in a data set.
What is the formula for calculating quartiles?
Q1 = P25, Q2 = P50 (median), Q3 = P75.
What does the notation Pk signify?
Pk signifies the kth percentile in a data set.
What is the relationship between percentiles and quartiles?
Quartiles are specific percentiles: Q1 = P25, Q2 = P50, Q3 = P75.
What is the significance of the 75th percentile?
At least 75% of the observations are less than or equal to the value at the 75th percentile.
How do you find the 75th percentile from a data set?
Use the formula (n + 1)k/100, where k = 75, and apply linear interpolation if necessary.
What does a measure of dispersion indicate?
It characterizes how varied the observations are from each other.
What does a small value of dispersion indicate?
Data points are close together near the center.
What does a large value of dispersion indicate?
Data points are spread out and more different from each other.
What is the minimum possible value of dispersion?
0, which means no variation at all.
Which collection has a higher measure of dispersion: A = {98, 98, 99, 99, 99, 100, 100, 100, 100, 100, 100, 100, 101, 101, 101, 102, 102} or B = {20, 30, 40, 50, 60, 70, 80, 90, 100, 110, 120, 130, 140, 150, 160, 170, 180}?
Collection B, because its values are spread widely from 20 to 180.
For which collection is the mean a more reliable measure of central tendency: A or B?
Collection A, as most values are close to 100.
What are the two types of measures of dispersion?
Measures of Absolute Dispersion and Measures of Relative Dispersion.
What is the formula for Range?
Range = Maximum - Minimum.
What is the interquartile range (IQR)?
The difference between the third and first quartiles of the data set (IQR = Q3 - Q1).
What does the IQR address that the range does not?
The sensitivity towards outliers by trimming the smallest 25% and largest 25% of observations.
What does variance measure?
The average of the squared deviations of the data values from the mean.
What is the formula for sample variance?
s² = ∑(Xi - X̄)² / (n - 1).
What is the formula for population variance?
σ² = ∑(Xi - μ)² / N.
What is the intuition behind variance?
It tells us how far data values typically are from the mean.
Why do we square the deviations in variance?
To prevent negative and positive differences from canceling each other out and to give more weight to larger differences.
What is the standard deviation?
The positive square root of the variance, bringing the measure back to the original unit of the data.
What is the effect of an outlier on the range?
A single extreme value can inflate the range significantly.
Why is the range not always a reliable measure of dispersion?
It only uses the minimum and maximum values and ignores how values cluster in the middle.
What is the computational formula for variance?
s² = (n ∑X² - (∑X)²) / (n(n - 1)).
What does the unit of variance represent?
The square of the units of measure in the data set.
How does variance relate to the reliability of the mean?
The measure of dispersion tells us how consistent or reliable the mean is as a summary of the data.
What is the interpretation of an IQR of P83,500?
The middle 50% of family incomes in the community vary within a spread of P83,500.
What is the range of weights for a set of rabbits if the maximum is 15 and the minimum is 8?
The range is 7 pounds.
What is a characteristic of the range?
It is simple and easy to compute but can be affected by outliers.