PSY2811 Exam 2
1/62
Earn XP
Description and Tags
Name | Mastery | Learn | Test | Matching | Spaced | Call with Kai |
|---|
No analytics yet
Send a link to your students to track their progress
63 Terms
Descriptive Statistics
Used to organize, screen for issues, summarize main details
Inferential Statistics
Use data from sample to make conclusions about overall population
Population
total collection of things we are seeking info about
(“mu”/unknown) population parameters
any summary of numbers that describes characteristics of entire population
Does it matter what graph you use for differential statistics?
Yes
Bigger sample size = ________________ confidence interval
smaller
Two major things in hypothesis testing
Falsification, testing your prediction against the alternative possibility
Is this worded right: “I reject the null”
yes
Is this worded right: “The null is wrong”
NO- you can not definitely prove right and wrong
Is this worded right: “I failed to reject the null”
yes
SEST
as we get older we are more motivated to regulate negitive emotions, which leads to a better wellbeing
What does a Frequency distribution table help with?
organize data, detect weird values, orders raw data
What does a frequency distribution table use to organize data?
Bins
What are the rules of the bins?
exclusive, equal sized, exhaustive
What is a cumulative frequency table and what is it used for?
Accumulated scores across bins. Useful for: counting scores below or above threshold value.
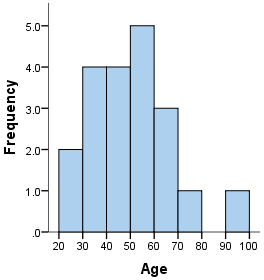
Histogram
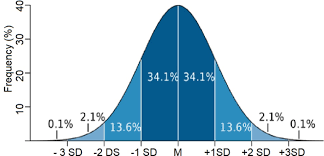
Normal
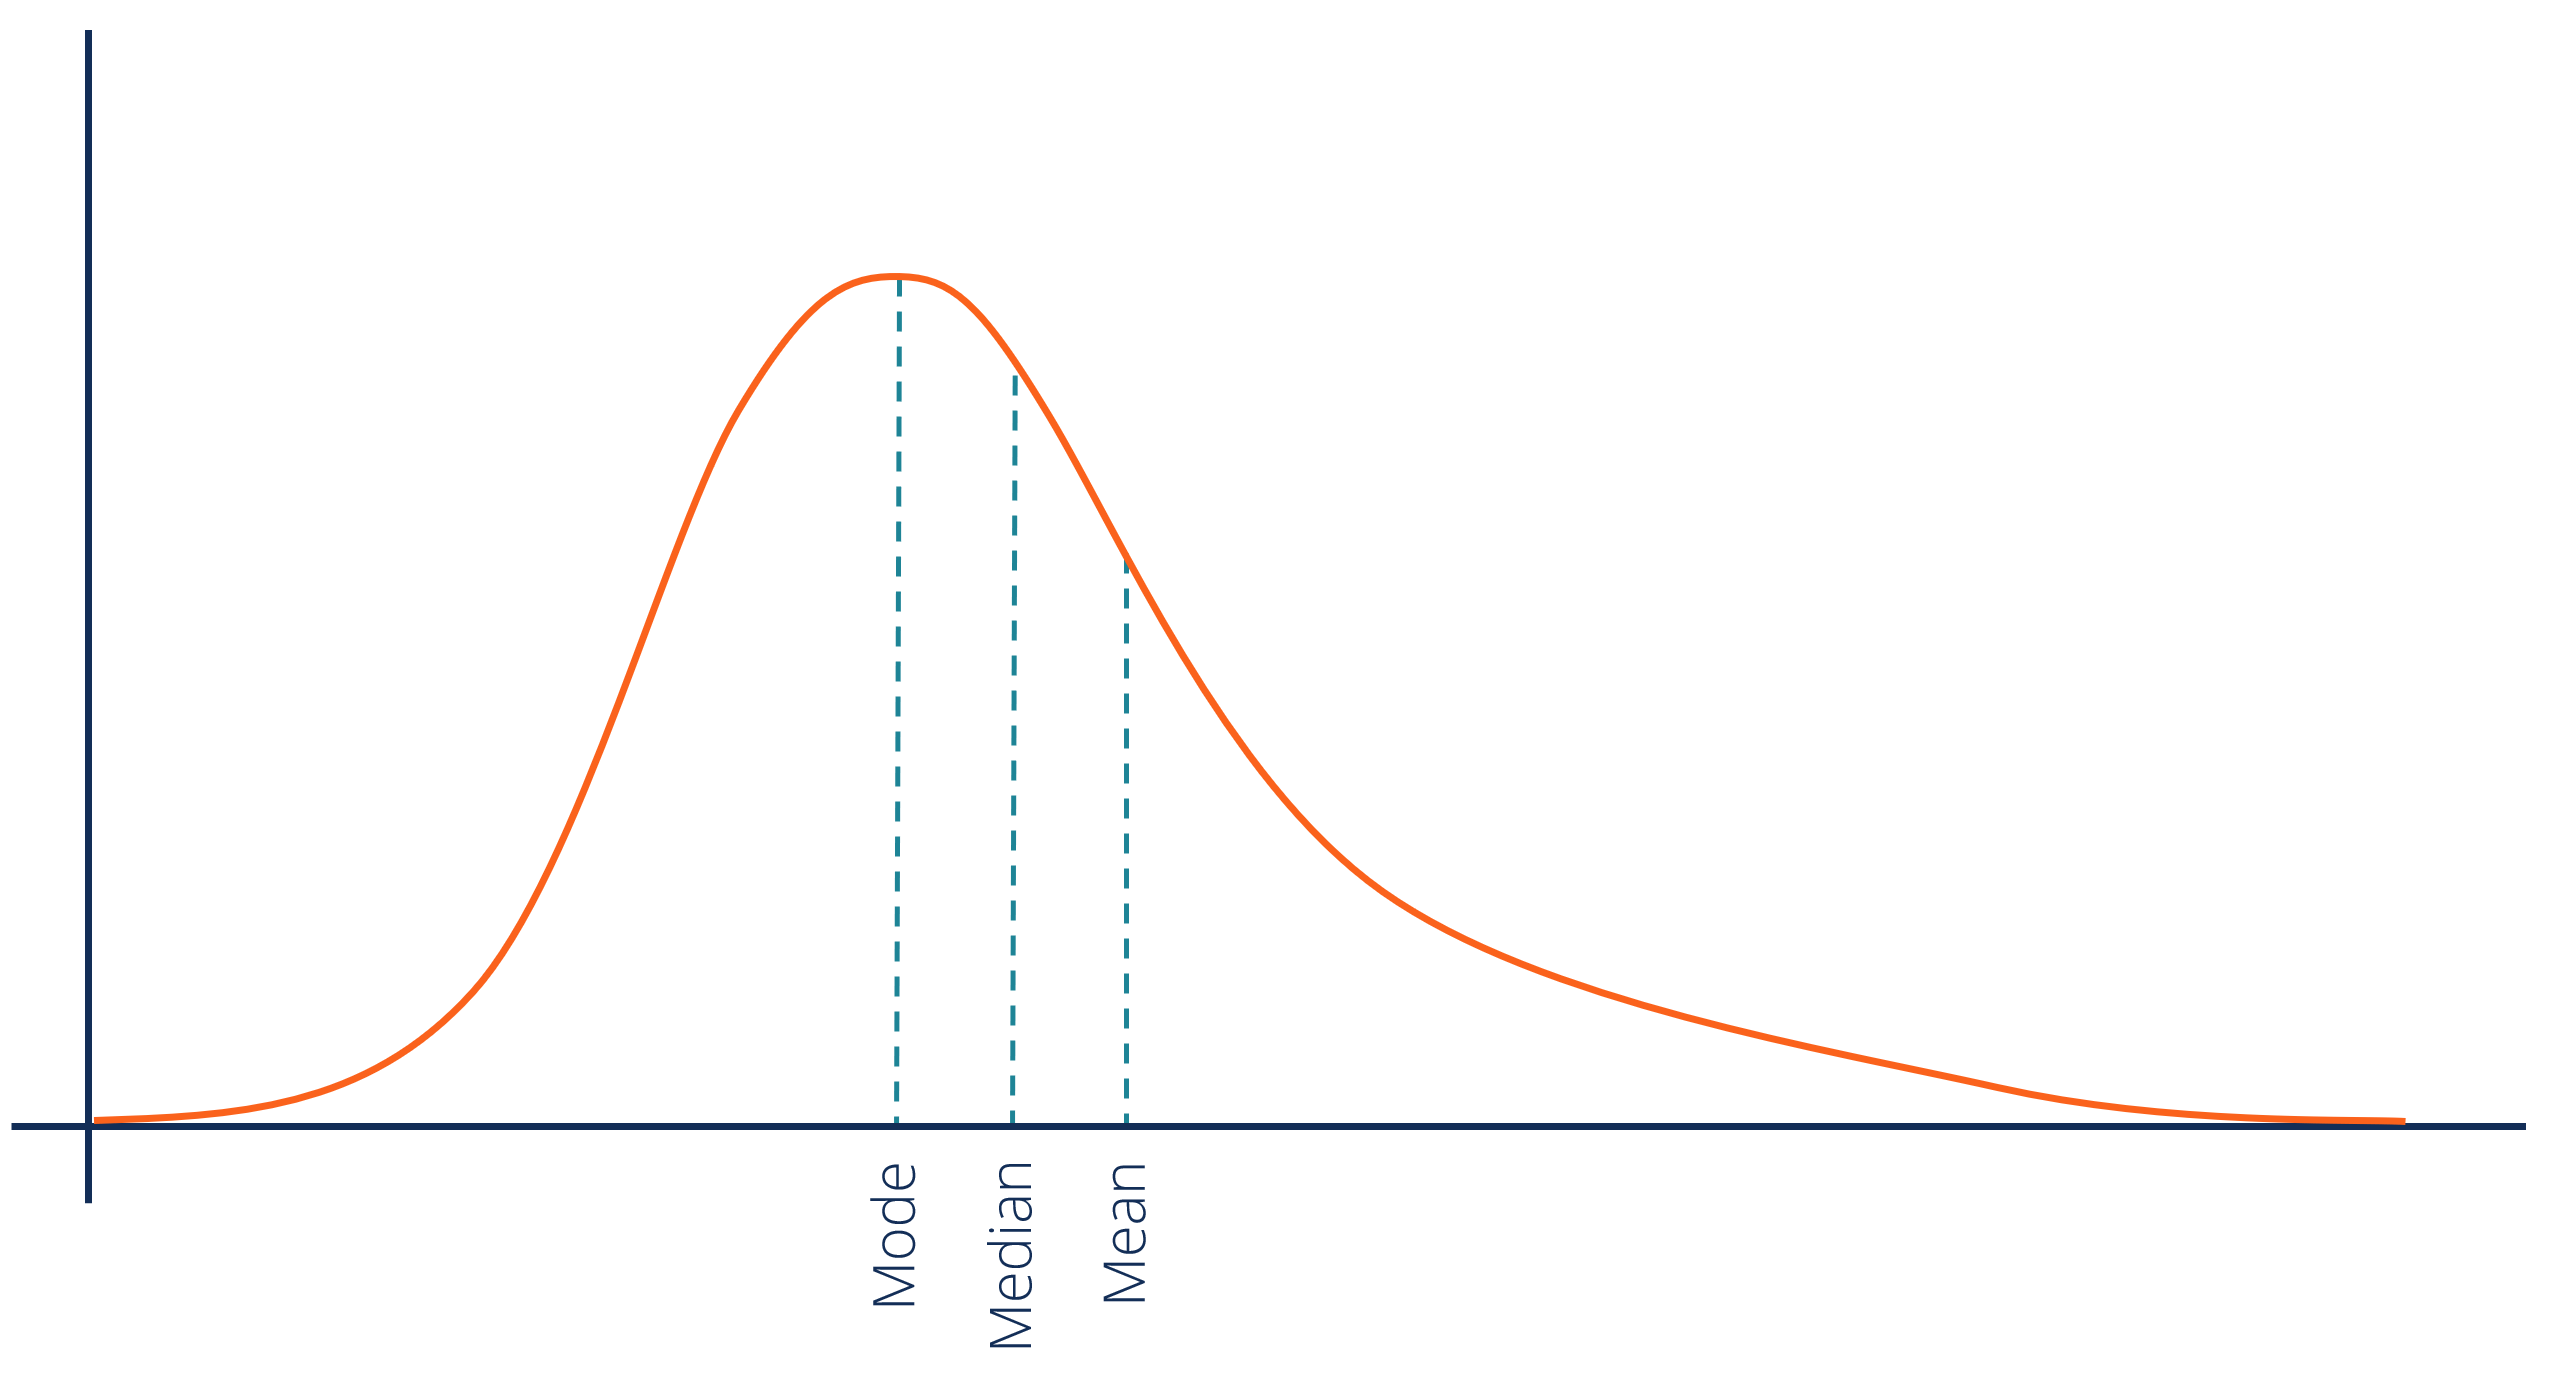
Positively Skewed
Negatively Skewed
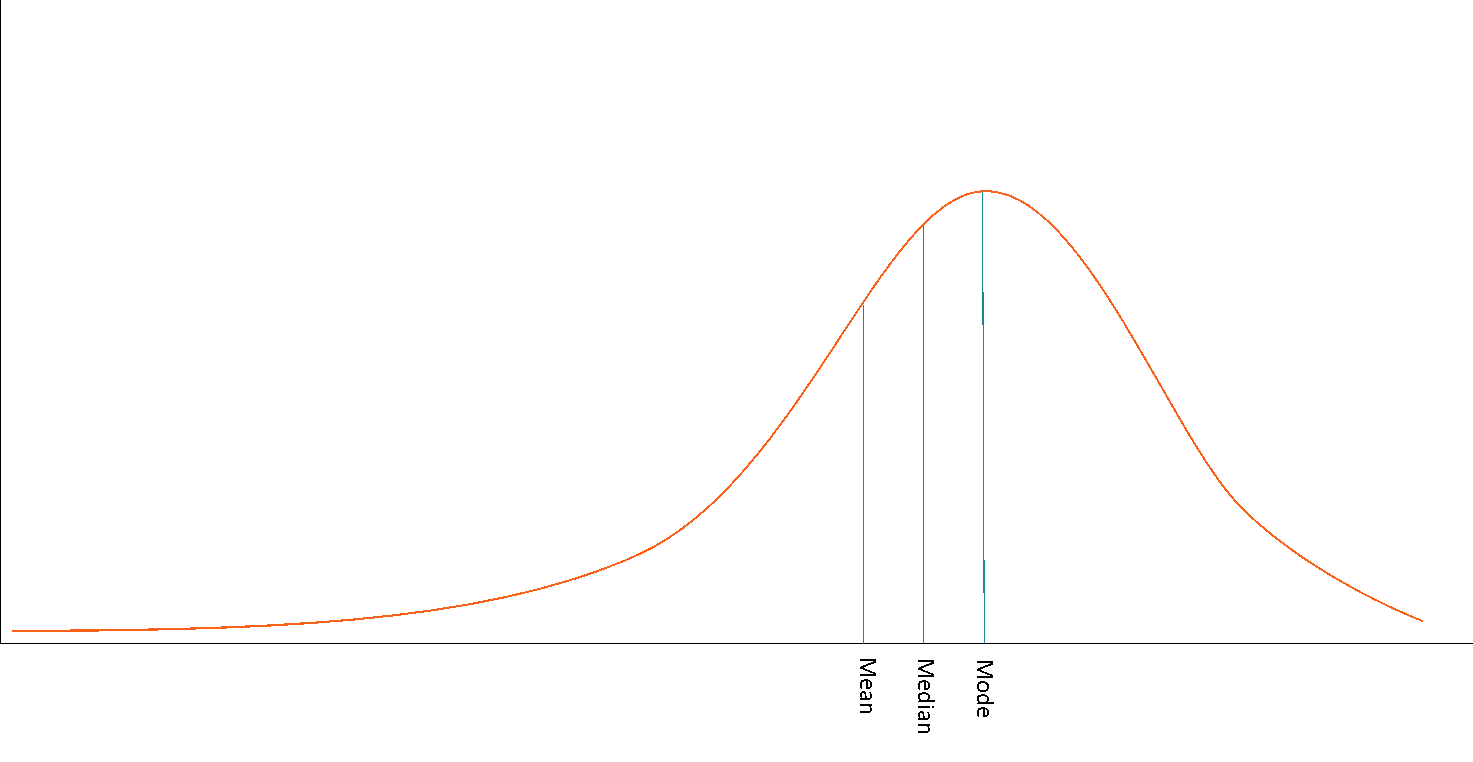
What is central tendency (3)?
Mode, Median, Mean
Central Tendency
these measures summarize the middle or most typical values for a varible
What two factors guide what central tendency we use?
1) level of measurement (nominal, ordinal etc)
2) Shape of distribution (normal, skewed)
Mode
The most common values of varibles
Nominal variables can only use what type of central tendency?
Mode
Median defination
middle value of distribution (data in order)
What central tendency should you use for a nominal value?
mode
What is the best central tendency to use if your distribution is skewed?
Median- it does not include all the data
Mean definition
arithmetic average of all variables in data
What should you use when the data is simetrical?
Mean- it is influenced with outliers
T or F: The mean is skewed by the tail
true
Variability
causes central tendencies to vary
Where does varability come from?
We are human, everyone is diffrent
Participant variability happens in four main ways….
Between subject, within day and subject, random errors, systematic
What 3 Participant varabilitys can we live with?
Between subject, within a given subject/day to day, random errors
What is the one participant validity that we have to fix?
Systematic- being constantly off set from the true score
How do we quantify variability?
With range, Interquartile Range, Box and wisker plot
What is the Range?
The diffrence between the minimun and maximun
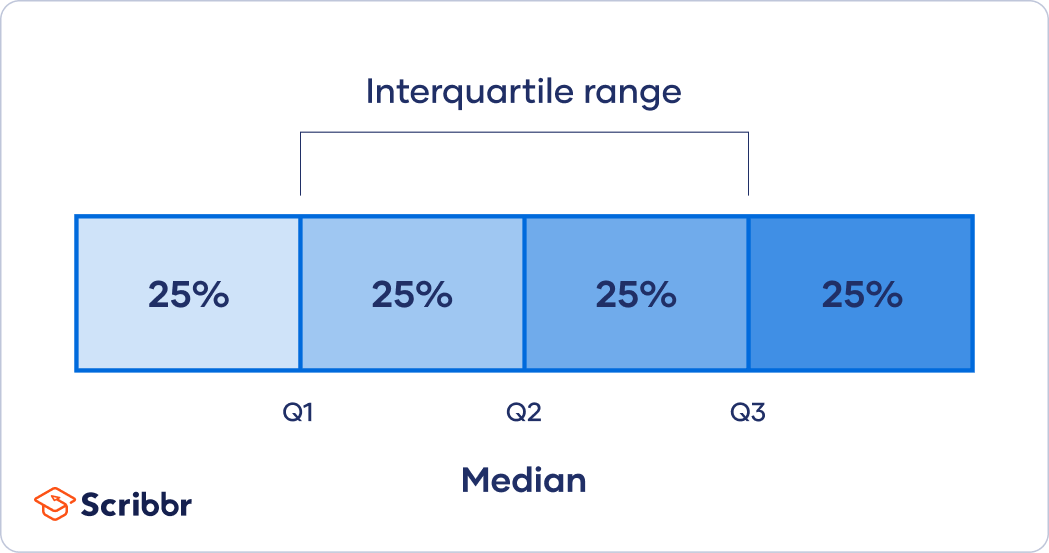
What is interquartile range?
the middle 50% of the data set (between Q1 and Q3)
Greater deviation = ____________ spread of scores
greater
mean absolute deviation
The average distance each score is from mean
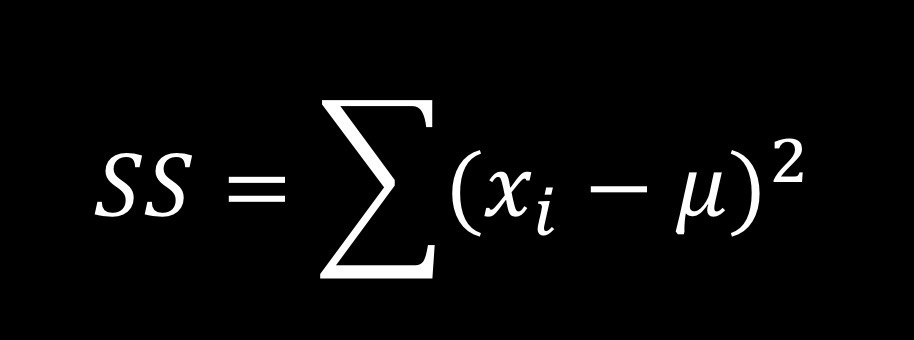
sum of squares
take each deviation from the mean
z-score = 0
equal to the mean
z-score<0
zscore is less than mean
zscore>0
greater than the mean
what is Z-score
shows how many SD a score is above or below the mean of its distribution
TorF: z-scores have a unit
FALSE- they are unit free, standardized
Column A shows what
Z-scores
Column B has what
prortion os data between mean and z-score
Column C has what
proportion of data beyond z-score
P-value
The probability that you would have seen this data of NULL was true
Power
the probability of correctly rejecting the null hypothesis
Lower alpha
lower power
lower alpha, you reduce your power makes it __________ to reject the null
harder
Type 1 error
false positive
Type 2 error
false negative
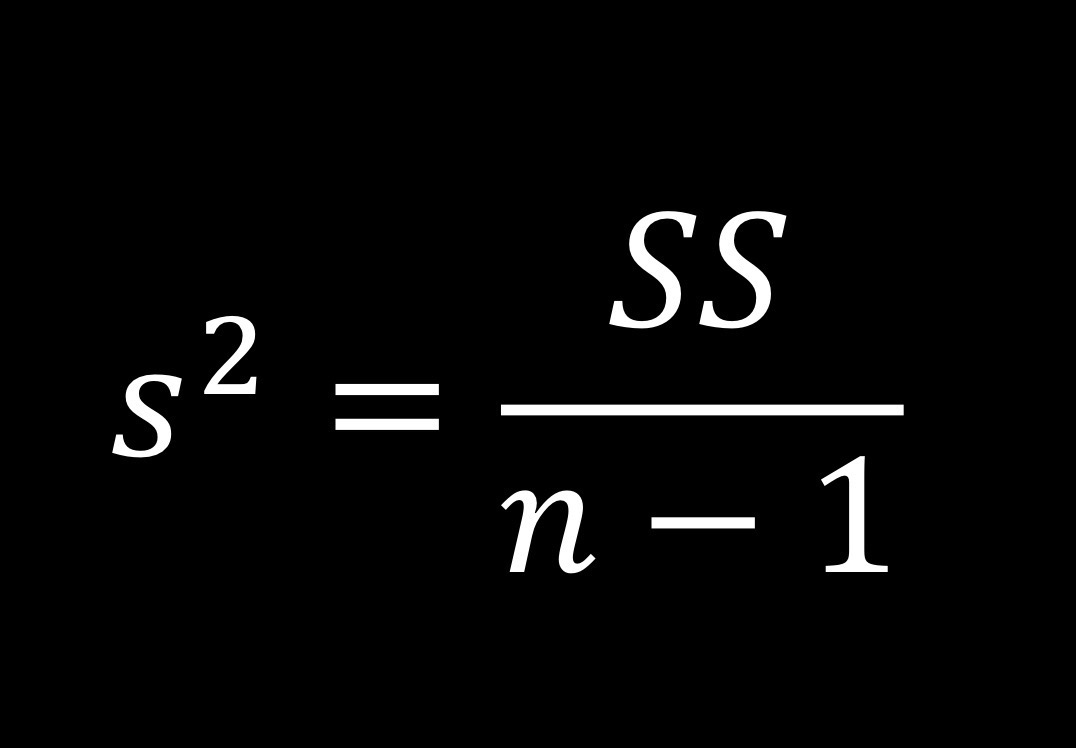
Sum of squares
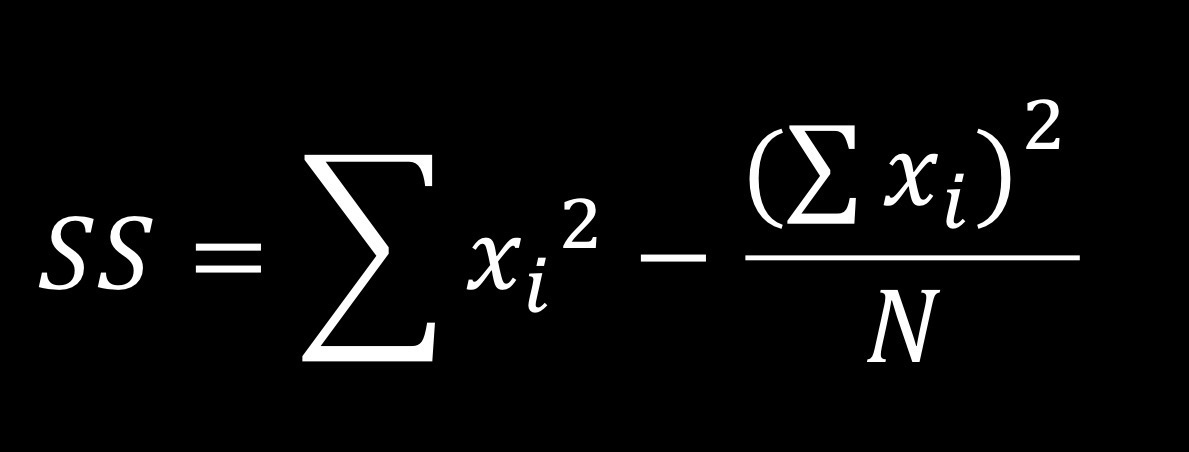
Sum of squares
Population Deviation
Sample Devation
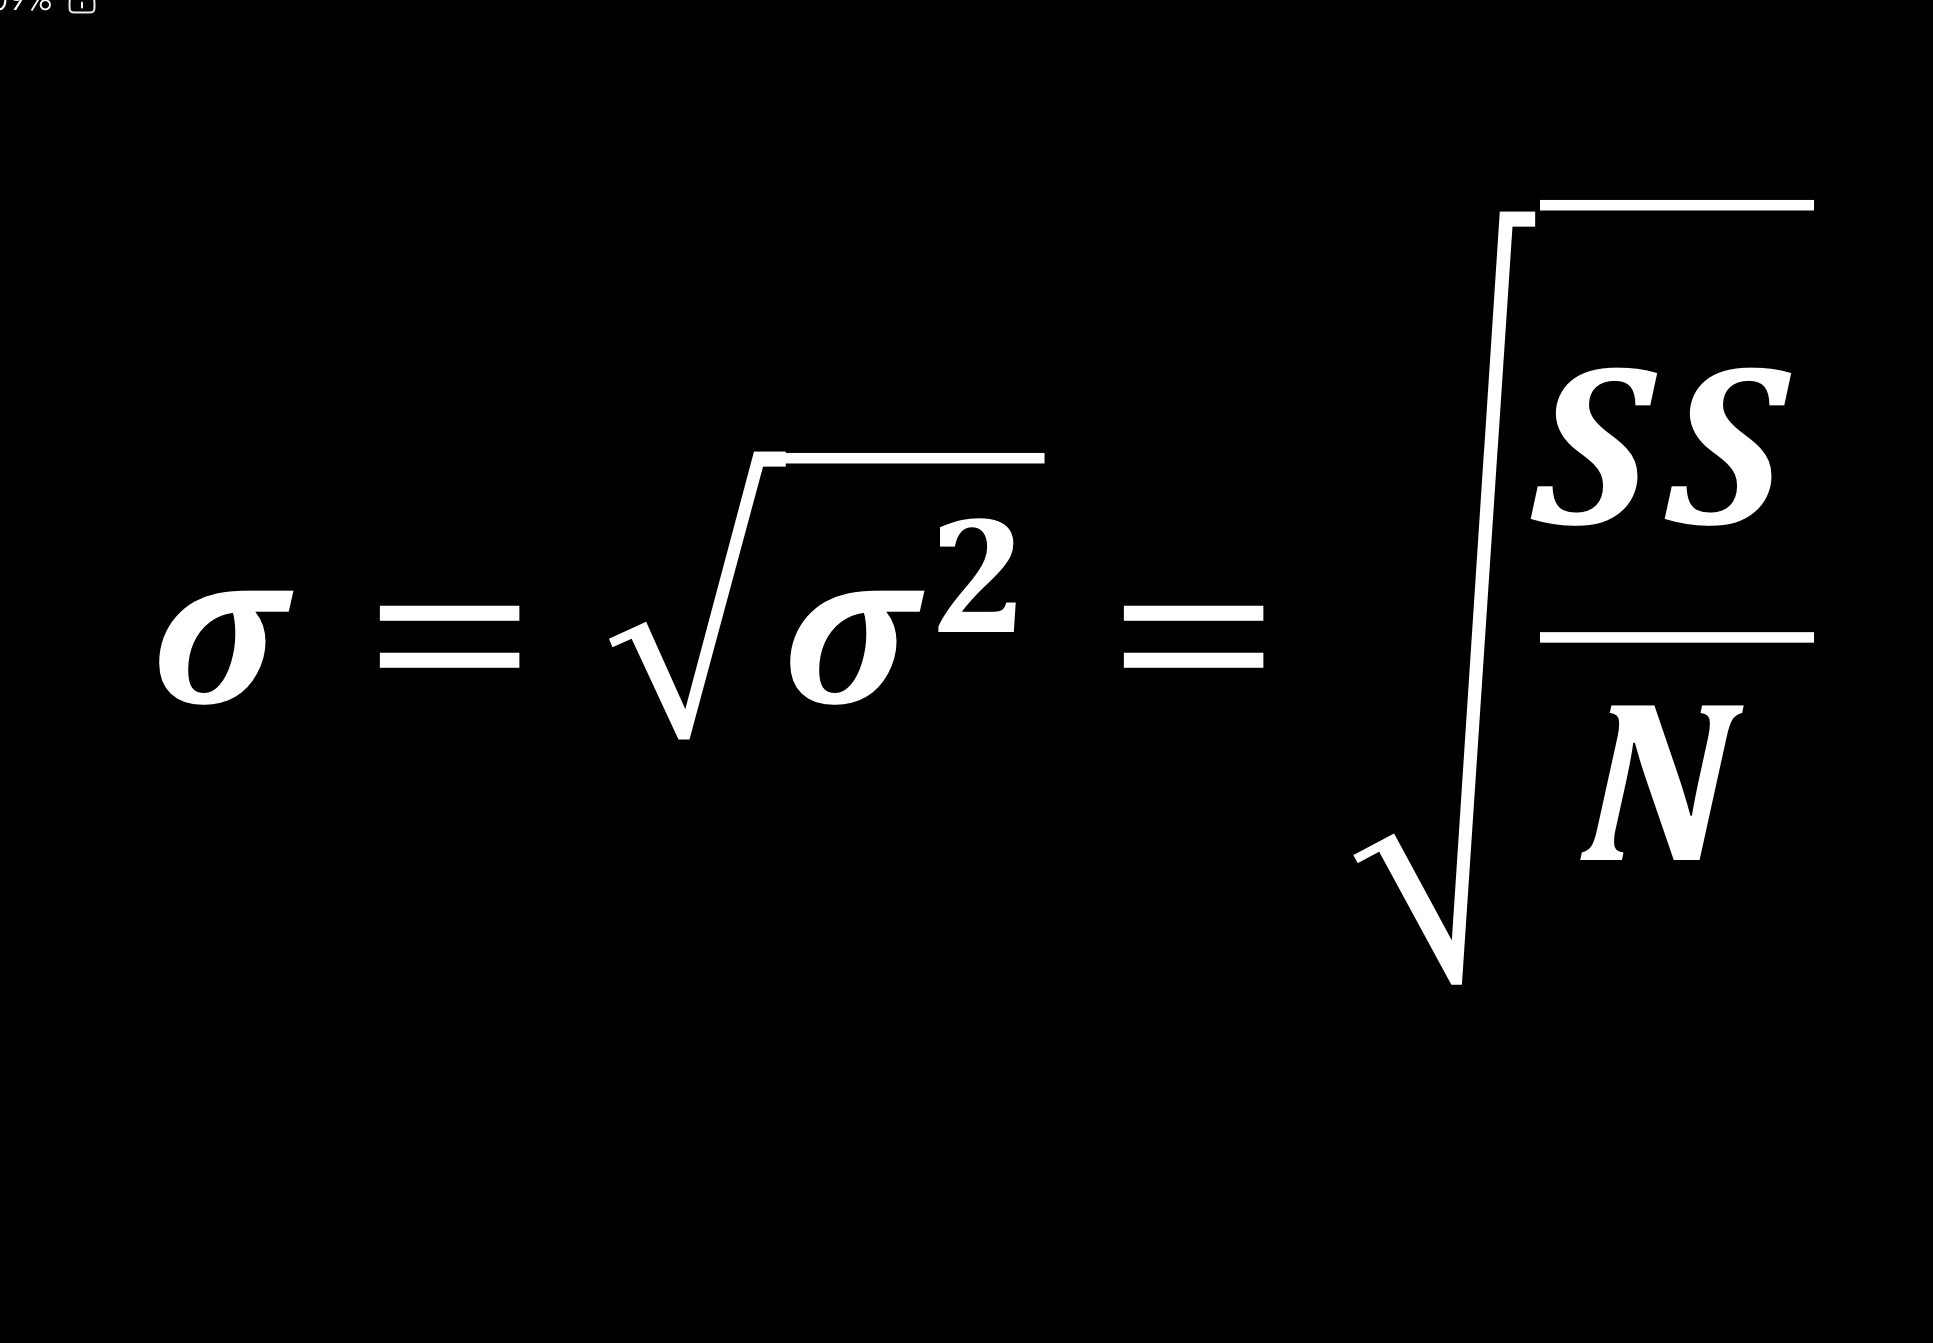
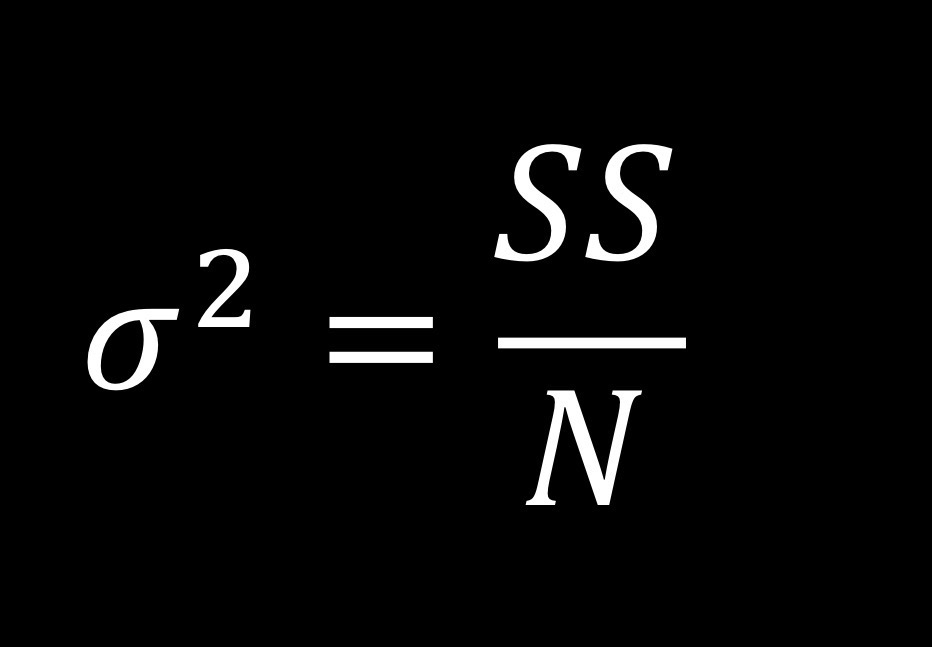
population SD
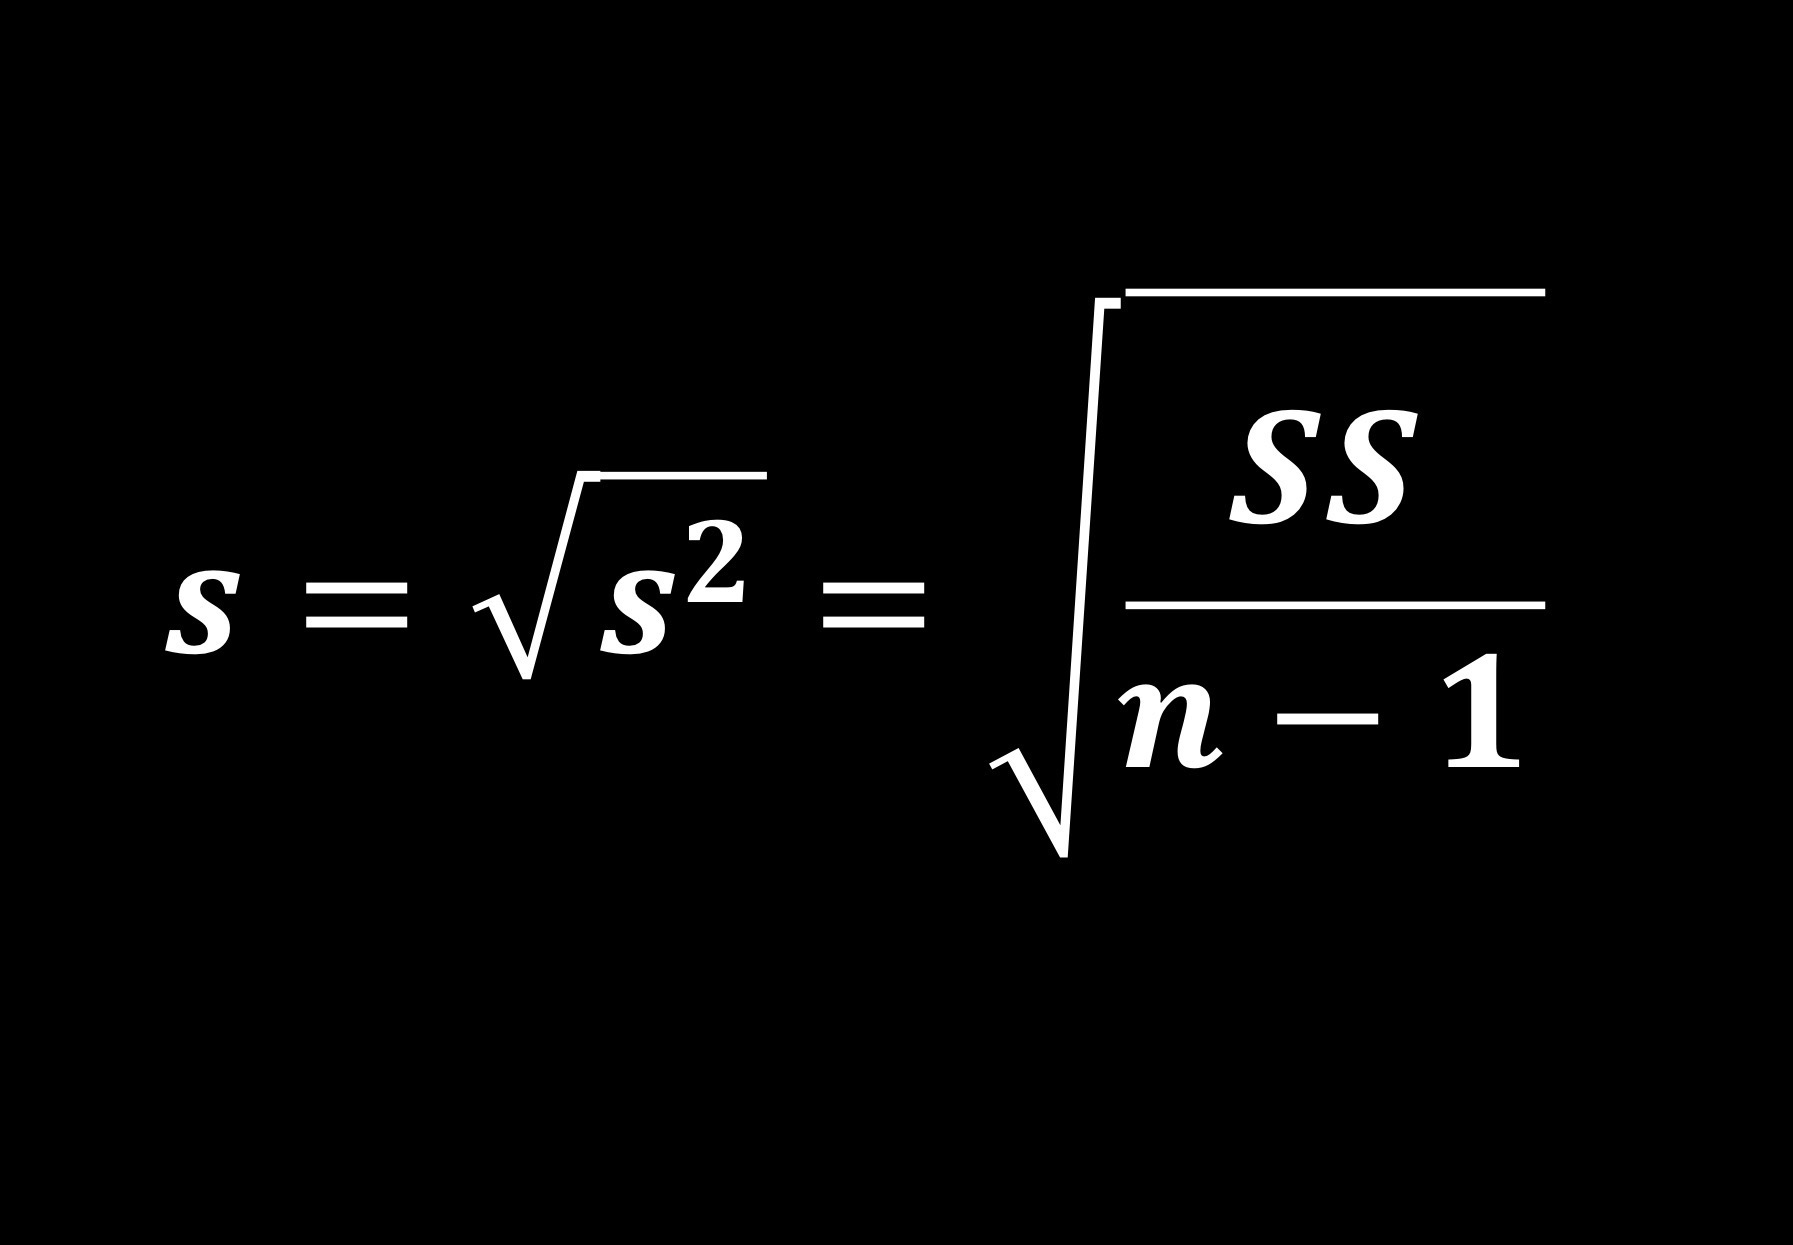
Sample SD
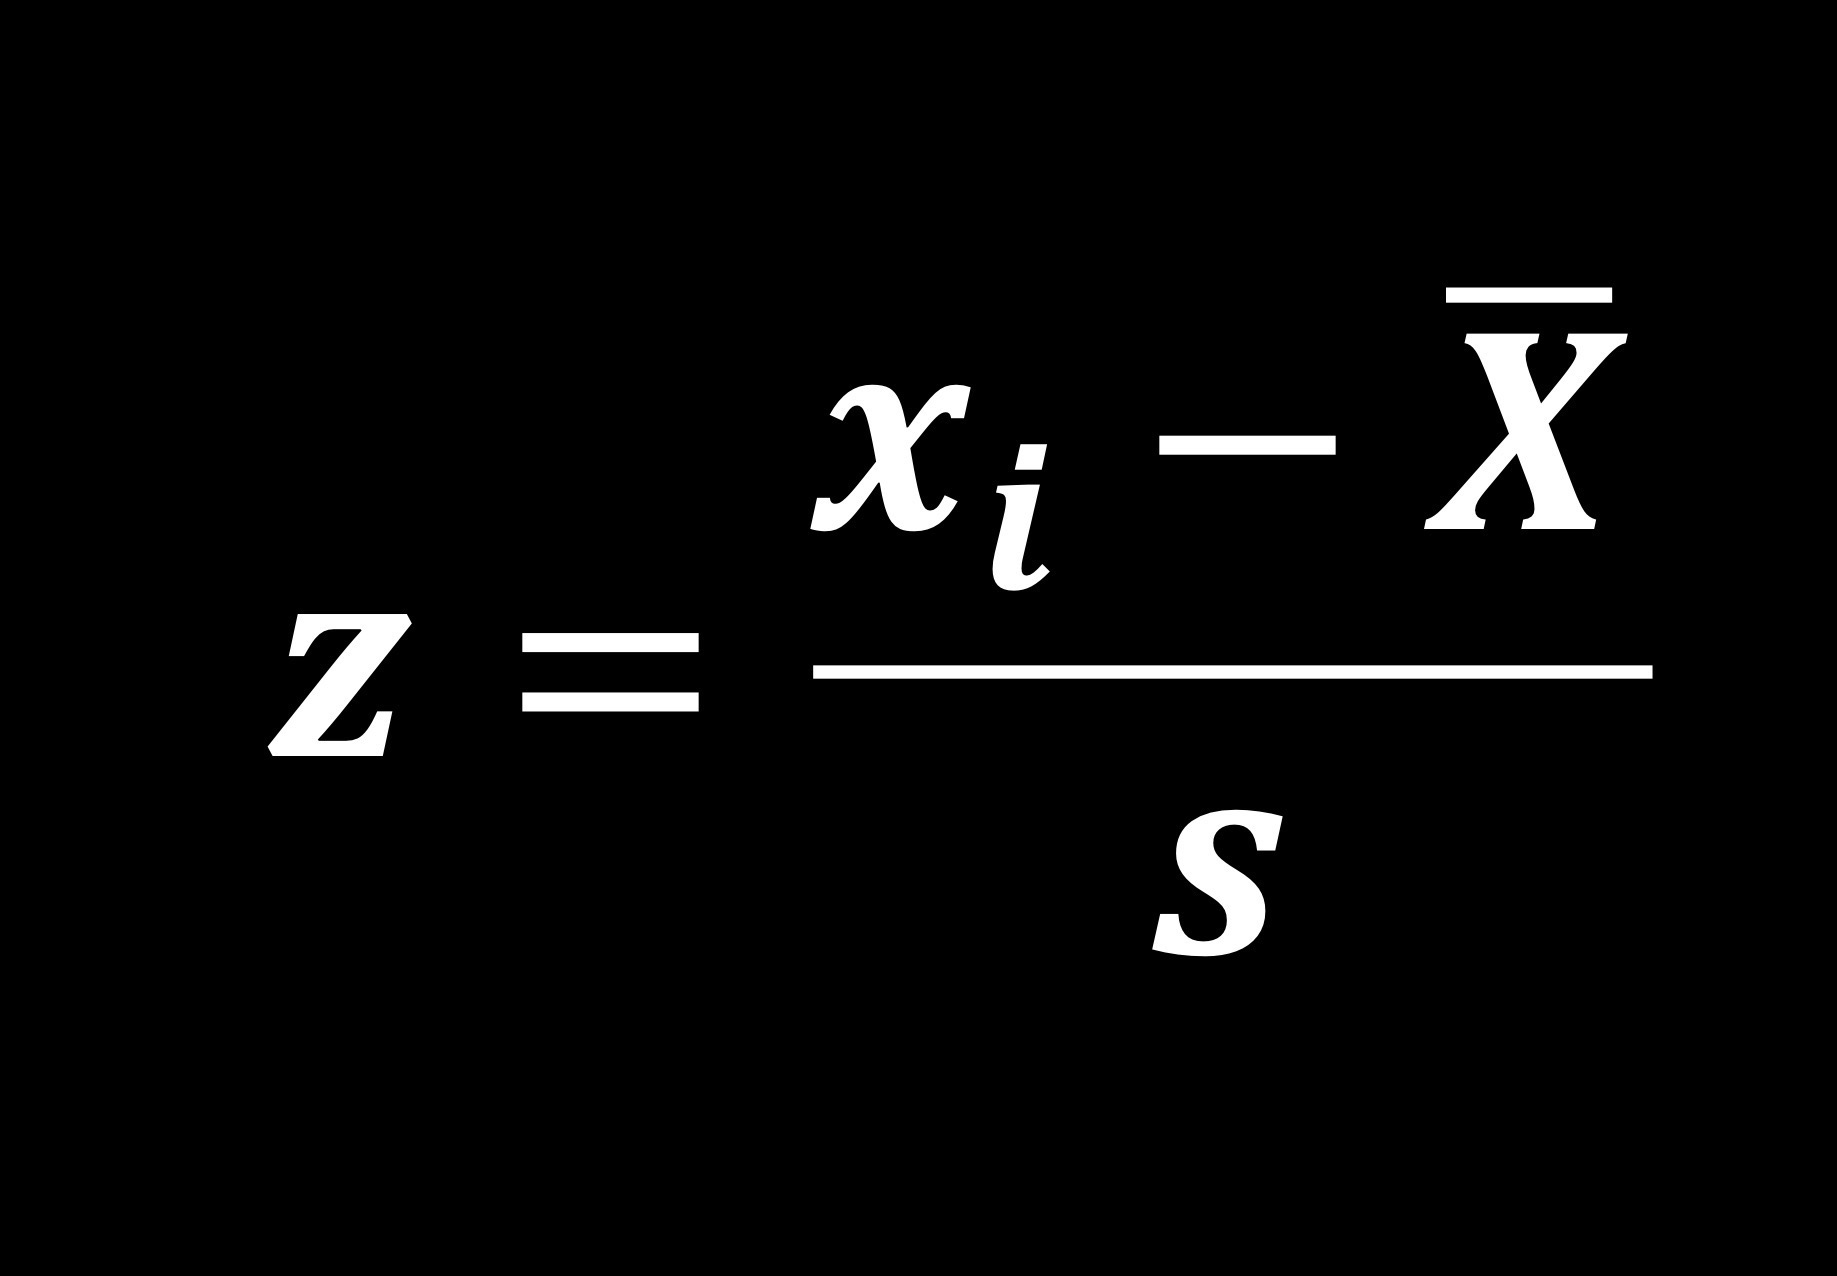
z-score