Y11 Geography Weather Hazards test
1/41
Earn XP
Description and Tags
first half of 'global hazards' topic
Name | Mastery | Learn | Test | Matching | Spaced | Call with Kai | Chat |
|---|
No analytics yet
Send a link to your students to track their progress
42 Terms
tornadoes
vertical funnels of rapidly spinning air containing clouds, strong wind, rain & sometimes hail
move at 15-30kmph and can have wind speeds of over 400kmph
flooding
a consequence of extreme weather (heavy rainfall in a short time) when water overflows its natural / artificial banks onto land that’s usually dry
thunderstorms
rain, clouds, lightning, thunder, wind
lightning
a type of extreme weather seen during thunderstorms. a bolt can contain 1bil volts of electricity
dust storms
a type of extreme weather, happens when very strong winds carry clouds of dust across an area
weather vs climate
WEATHER: the day to day changes in the atmosphere
CLIMATE: the average weather of an area based on data collected over 30 years
warm air
warm air rises - when air is heated it expands, becomes les dense and starts to rise, creating low pressure
as the air rises it starts to cool and any water vapour in the air condenses, causing clouds to form & possibly rainfall
low pressure because the air is exerting less pressure on the earth
clouds, rainfall, wind, hurricanes
cold air
cold air falls - becomes more dense & falls towards the ground, creaitng high pressure. it’s pushing down so pressure increases
no rising air = no clouds/rain, so calm, sunny, hot days in summer & clear, cold days in winter
the global circulation system
the equator receives the most heat from the sun & the north/south pole the least. this causes a surplus of heat at the equator. to provide polar areas with heat the earth operates the GCS
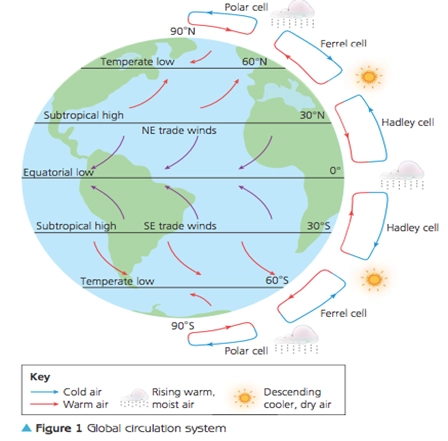
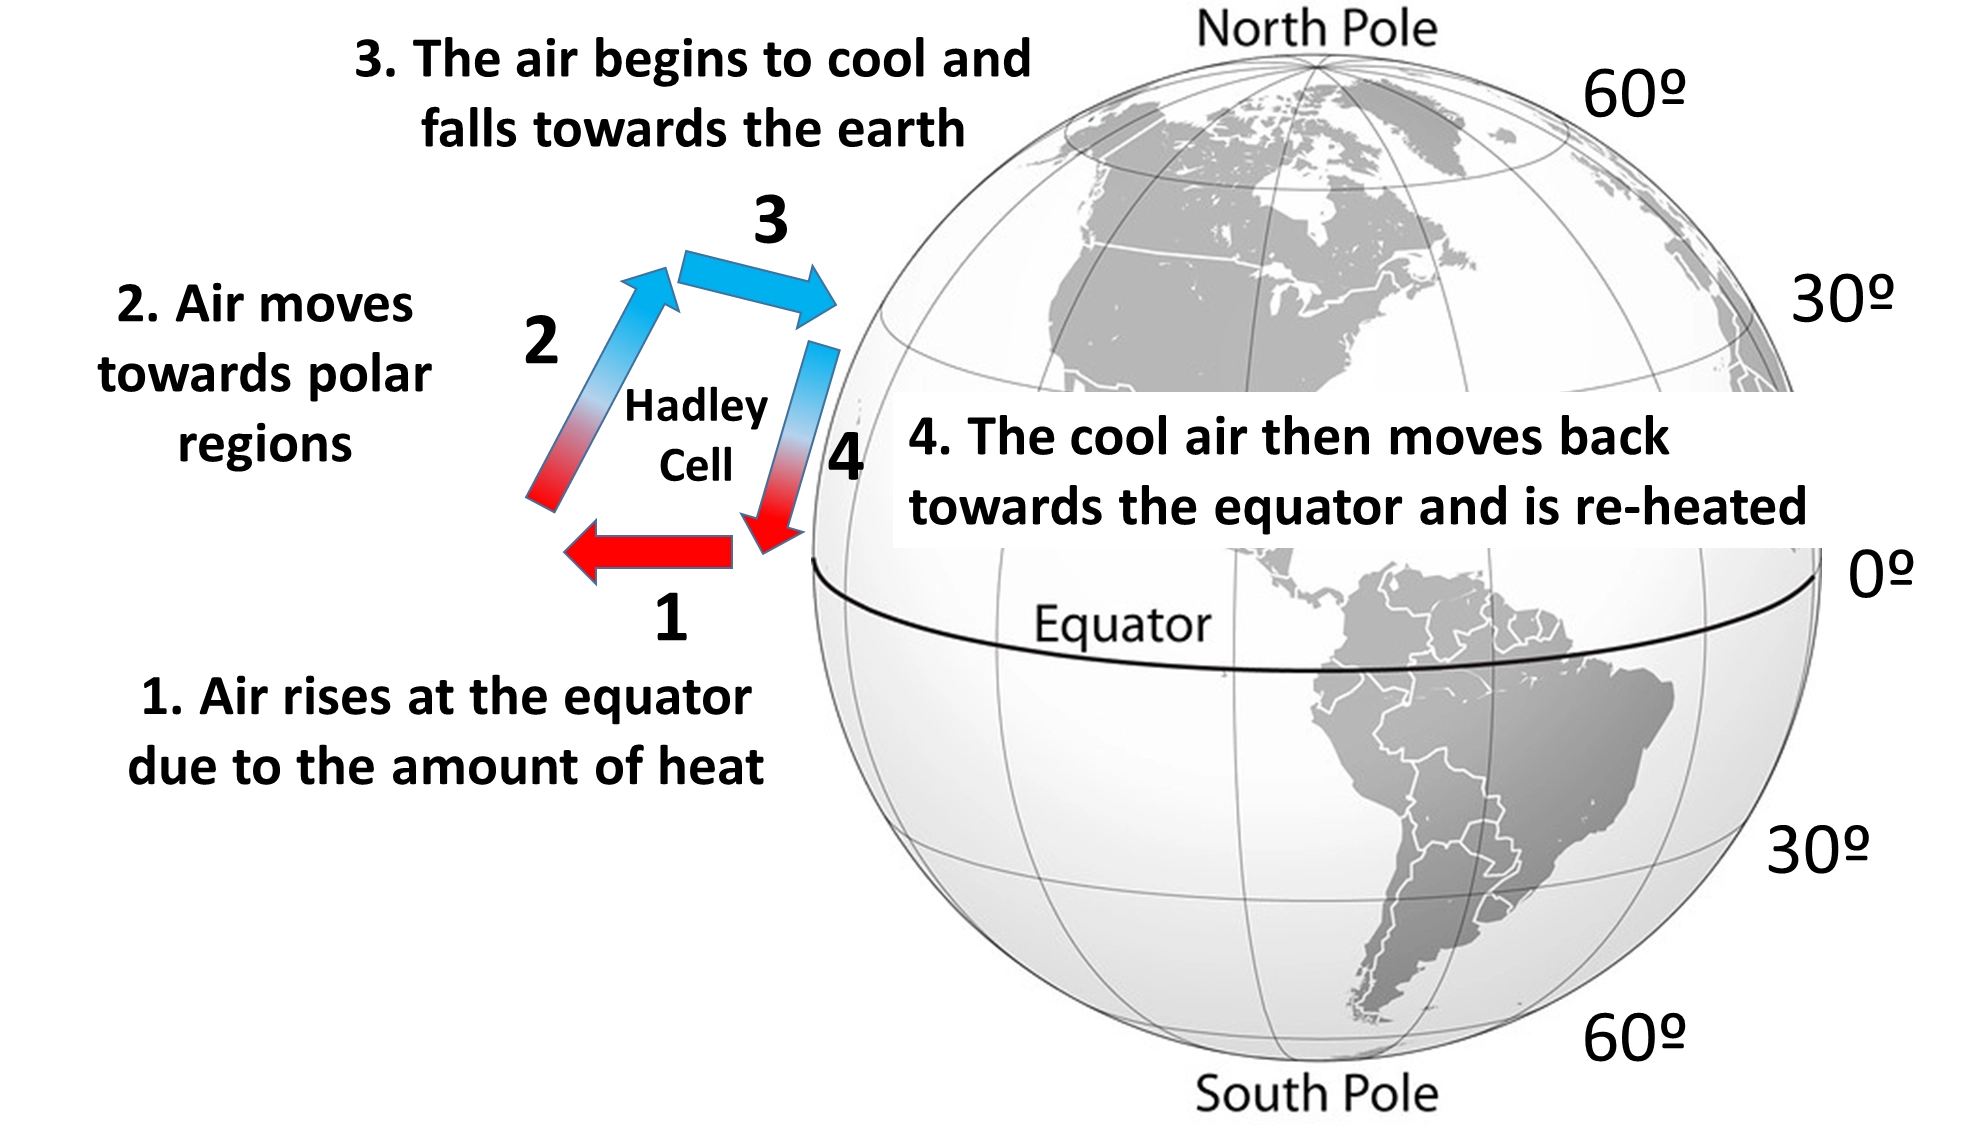
GCS: hadley cell
at the equator hot air rises creating a low pressure system & a band of high rainfall
at 30° cool air sinks creating high pressure so clear skies & desert climates
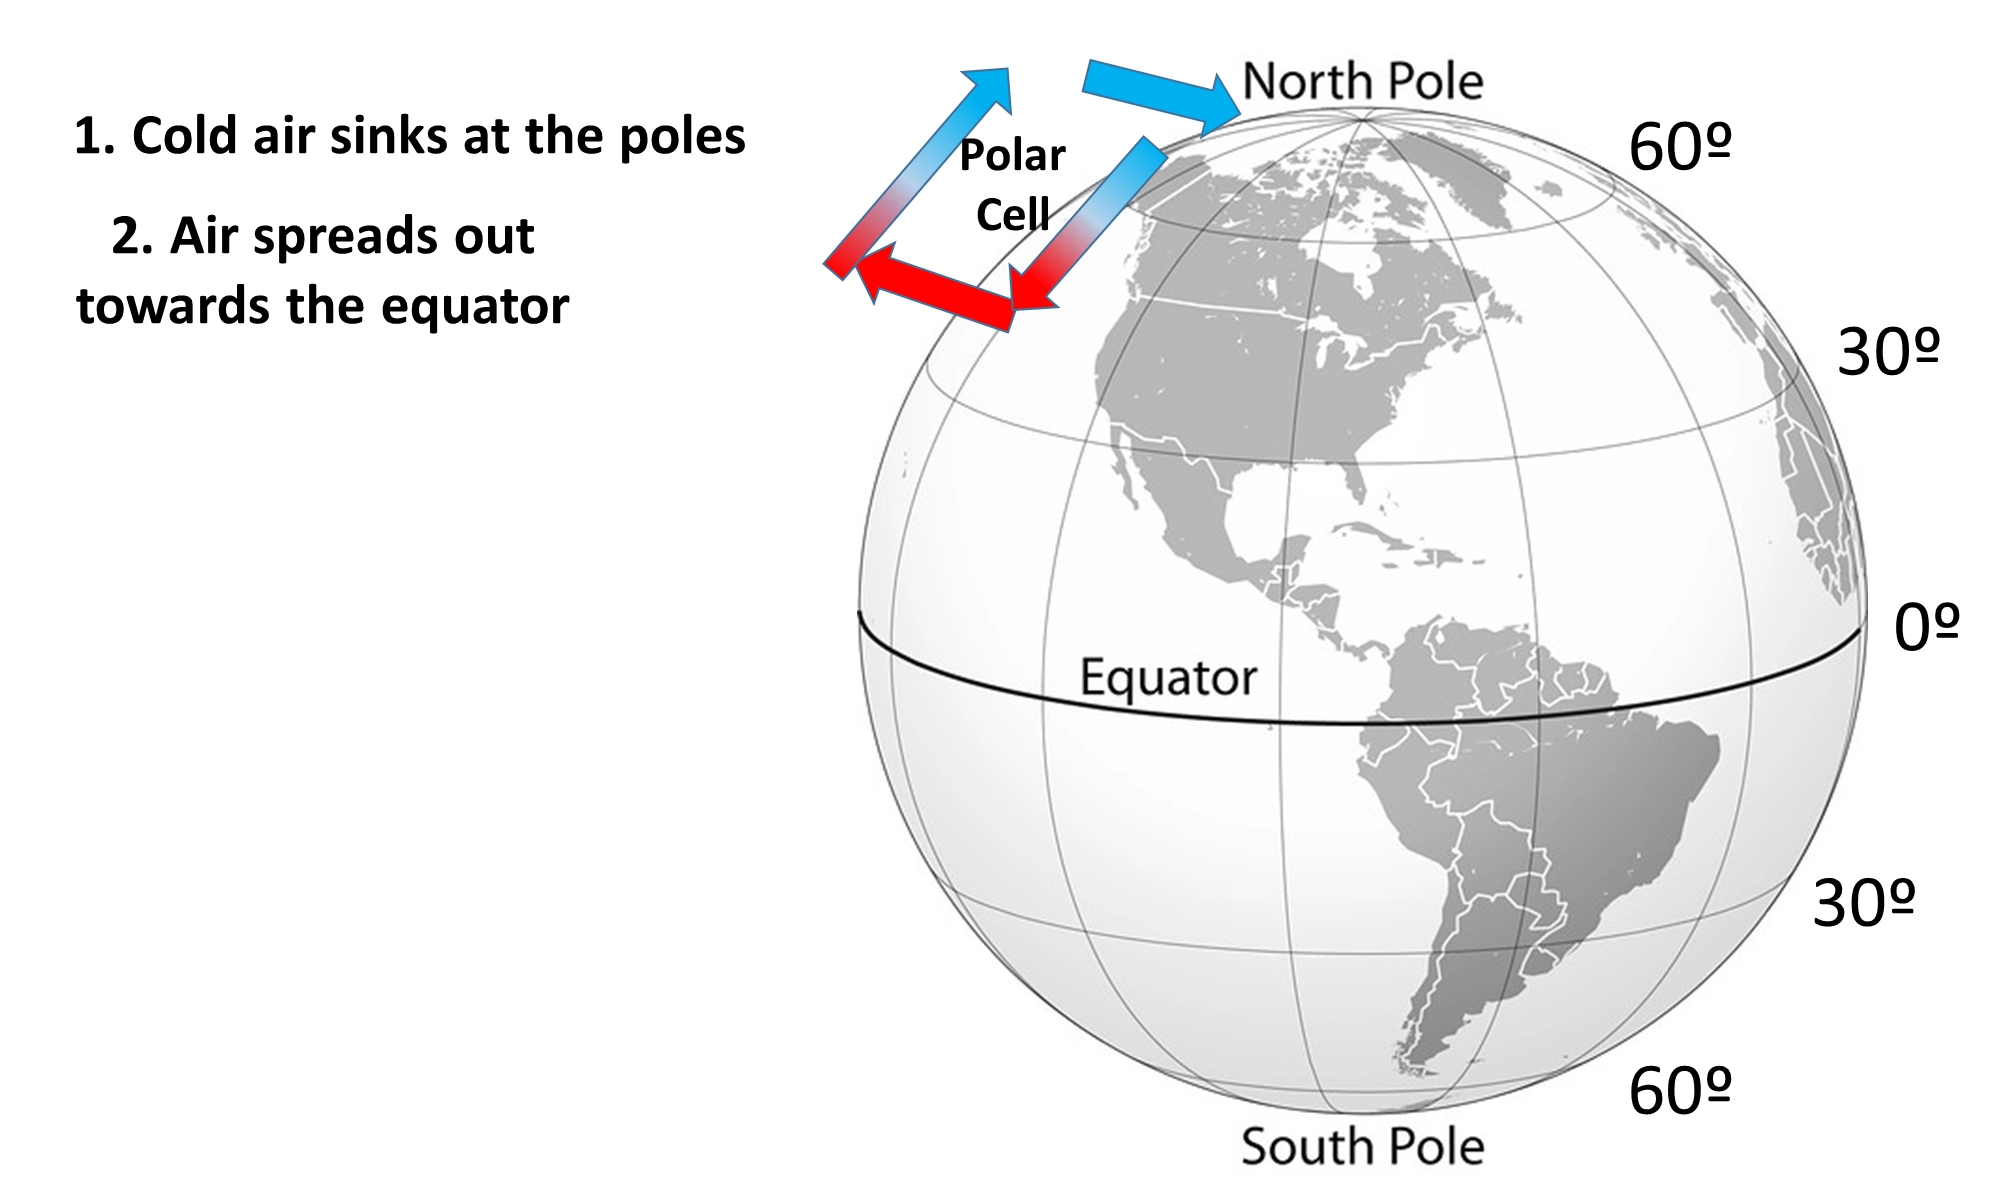
GCS: polar cell
cold air sinks and moves away from the poles
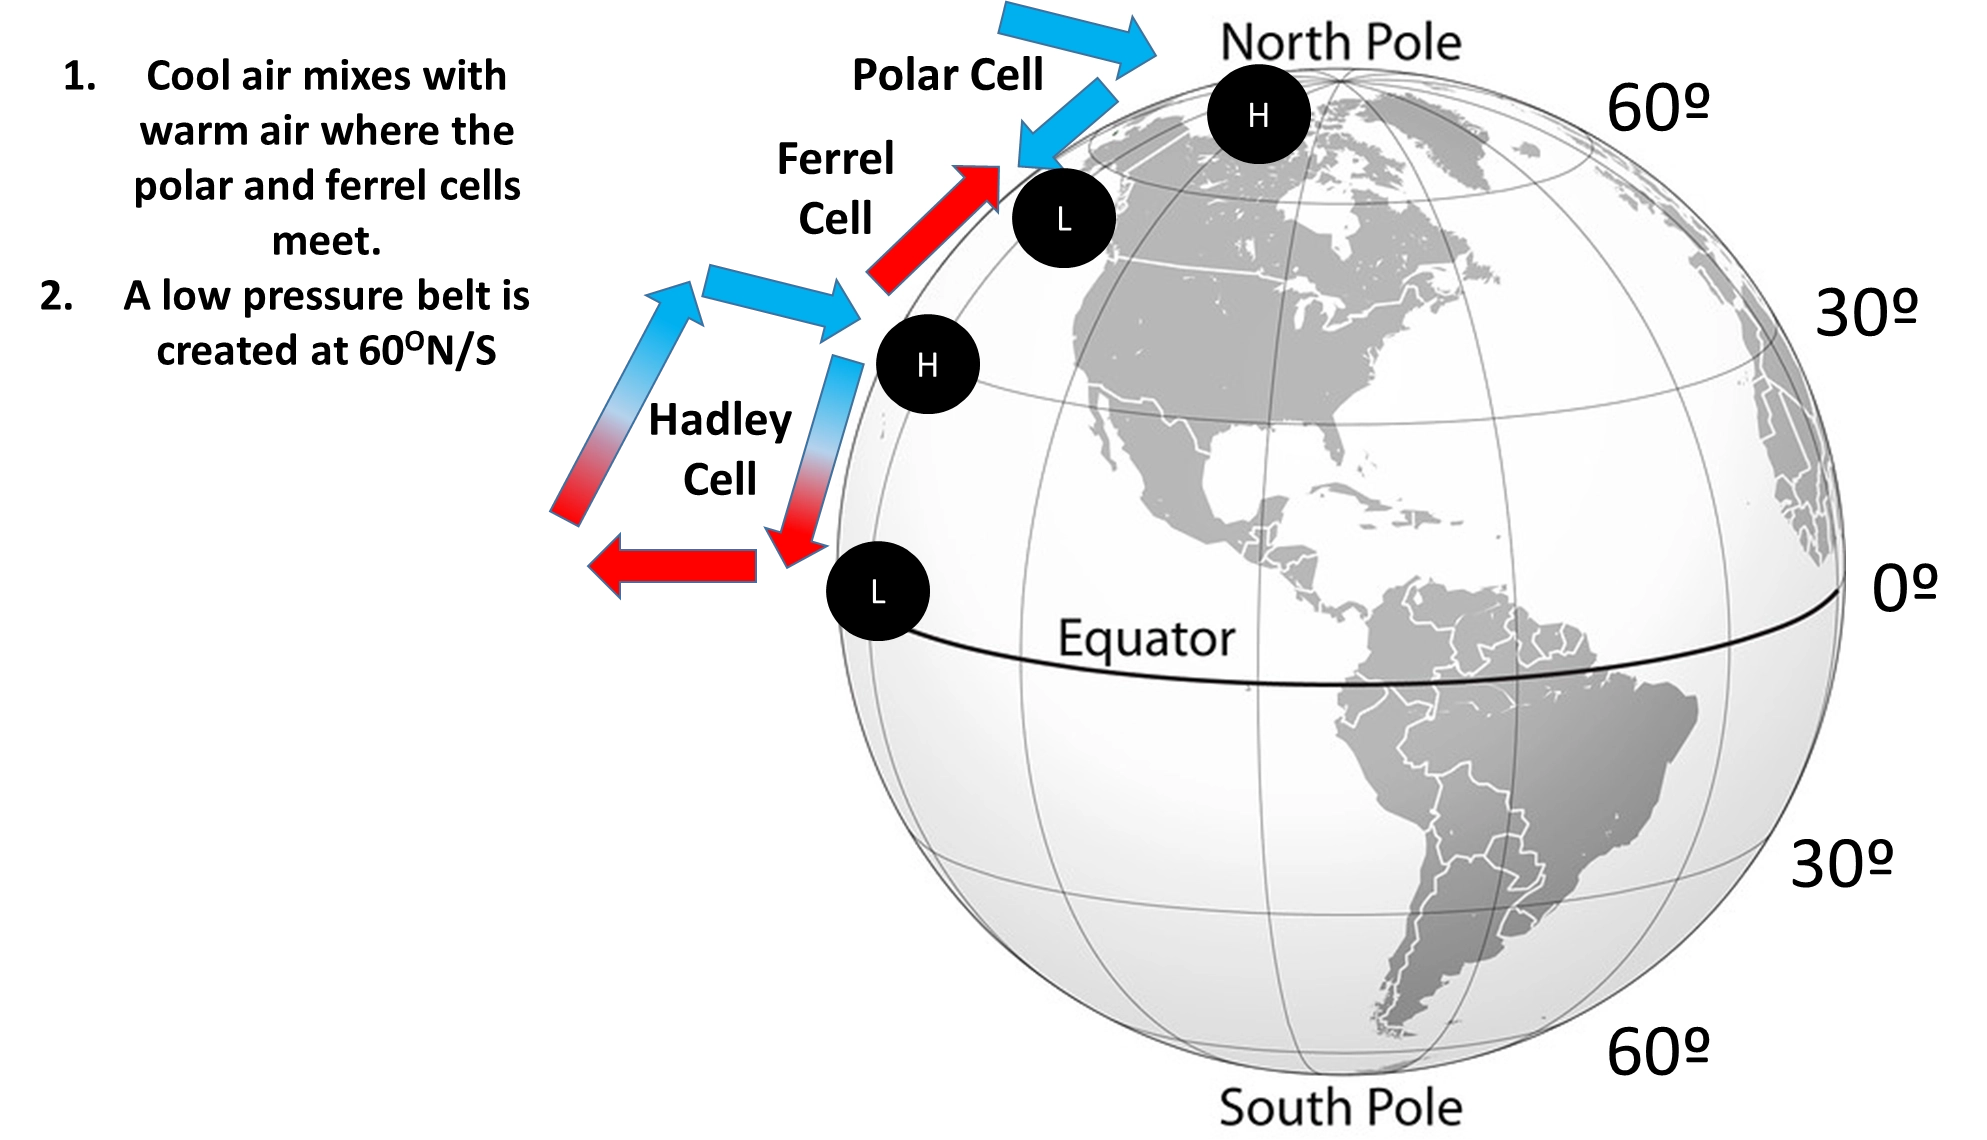
GCS: ferrel cell
at 60o there’s a band of low pressure as warm air from the ferrel cell mixes with cold air from the polar cell, creating rain
extreme weather
unexpected / unusual / unpredictable / severe / unseasonable weather
can take place over 1 day or a period of time
causes of extreme weather - temperature
the GCS can cause temps to be v high in high pressure areas around 30o. there are few clouds (sinking air) so there’s little to block the sun’s energy. temps in polar regions are very low
causes of extreme weather - the albedo effect
albedo - how much a surface reflects / absorbs the sun’s rays
polar ice has high albedo so reflects more heat so the poles are colder
oceans & rainforests have low albedo so absorb more heat so they’re warmer
causes of extreme weather - clouds
clouds can both cool the plant (reflect sunlight) and warm it (trap infrared heat). low thick clouds reflect causing cooling, while high thin clouds trap causing warming
cooling - clouds act as a white shield, reflecting incoming sunlight back into space. this reduces the amount of energy reaching the surface, particularly with low altitude clouds
warming - clouds act as a blanket, trapping radiation emitted by the surface & reemitting it. this keeps the surface warmer
high clouds - thin & cold, let most sunlight through while trapping outgoing heat = net warming effect
low clouds - thick & warm, reflect substantial sunlight & emit heat similar to the surface = net cooling effect
causes of extreme weather - ocean currents
because water is fluid, ocean currents more heat easily
the UK is warmer than other countries at similar latitudes because it’s warmed by a warm ocean current from the caribbean
causes of extreme weather - altitude
higher up, pressure is lower so temps are cooler (~1o per 100m altitude)
causes of extreme weather - precipitation
occurs when warm wet air rises & cools, causing water vapour to condense
air rises in low pressure belts so precipitation is frequent & intense in those areas. in high pressure belts air sinks & precipitation is v low
causes of extreme weather - wind
the movement of air from an area of high pressure to one of low pressure. greater pressure difference = stronger wind. (usually winds at ground level are slowed by friction)
trade winds blow from high pressure belts → low pressure belts
katabatic winds are caused by air flowing downhill
jet streams are high in the atmosphere and very strong as there’s little to slow them down
measuring wind
anemometers are used to measure wind speed by counting the number of times they rotate per minute
wind speed & direction can be shown using a rose chat
wind speed is measured using the Beaufort scale which ranges from 0 (calm) to 12 (hurricane)
australia vs uk - temperature
australia is warmer than the uk
in darwin (city in N australia) the average max summer temp is 33oC. temps over 40oC are considered extremely hot
in london the average max summer temp is 23o. temps over 30oC are considered extremely hot
australia vs uk - wind
australia has stronger extreme winds than the UK, partly because of tropical storms
strongest wind in australia is over 400km/h (recorded off the NW coast during a cyclone in 1996)
in the UK gales (winds 62kmph+) are rare. strongest every sea-level wind was over 220km/h (recorded in scotland in 1989)
australia vs uk - precipitation
australia has much lower precipitation than the UK
average annual rainfall in australia is 465mm. average annual rainfall in UK in over 1150mm
extremely wet years: 500mm+ in australia vs 1210mm+ in UK
extremely dry years: 360mm- in australia vs 950mm- in UK
tropical storms
powerful rotating storms, aka hurricanes, cyclones & typhoons depending on where they occur
form over tropical oceans & move east → west during summer & autumn, steered by trade winds
wind speeds over 120kmph, can be up to 650km wide & bring heavy rain (up to 250mm in 1 day)
a storm can last 6-14 days, bringing devastation to any land in its path
droughts
periods where there is much less precipitation over a specific time than is usual for the area, leading to water shortages. not no rainfall at all. an event of prolonged shortages in water supply, can be atmospheric (below average precipitation), surface water or ground water
can lead to food shortages, hunger & death
linked to long periods of high pressure - few clouds & so less precipitation. high temps also mean more water evaporates from plants, lakes & streams
can last for months / years / as little as 15 days
impact is worsened if people are using too much water or if water is being wasted
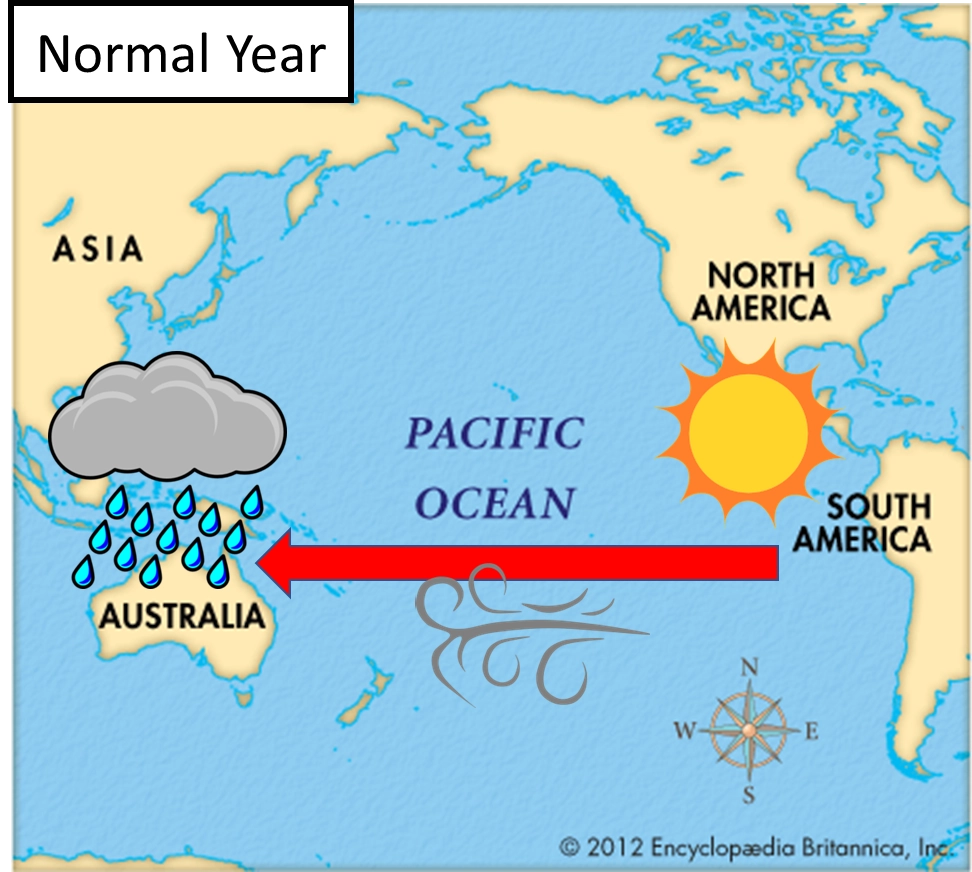
pacific normal conditions
winds blow east → west (south america → australia)
winds push warm water to the west making the sea levels in australia higher & warm. low pressure here due to warm water heating the air above it
peru = high pressure, v little rain
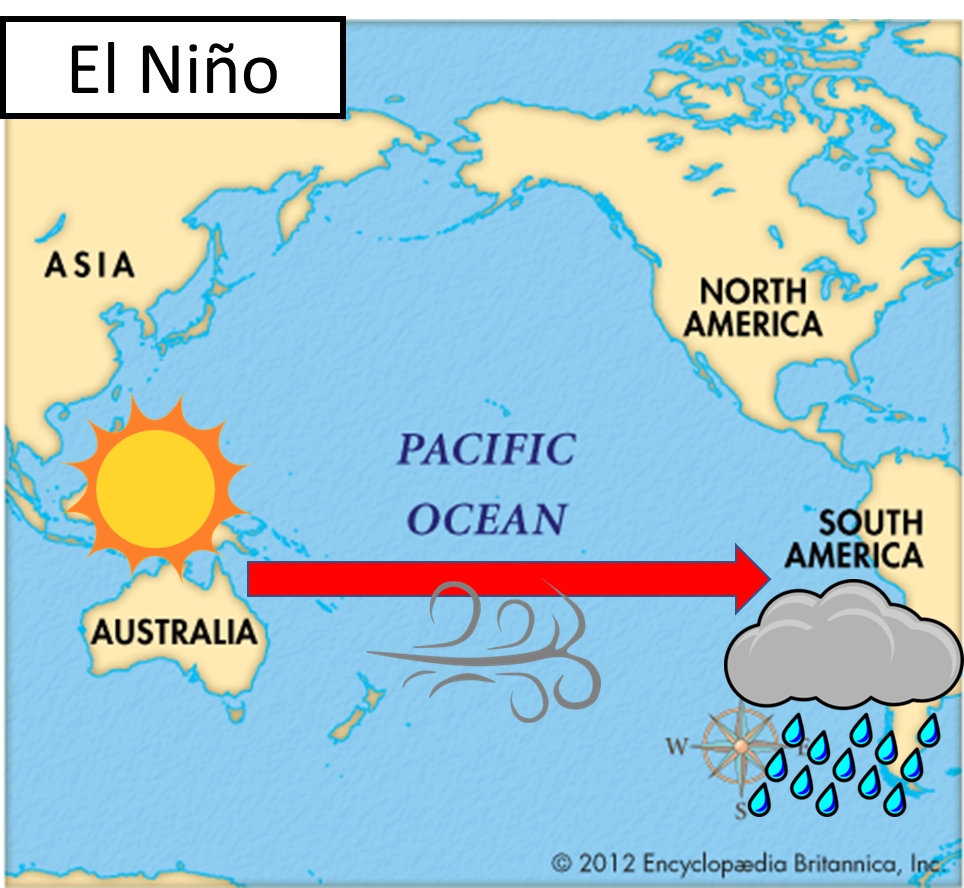
el nino
a weather event that takes place in the pacific ocean between australia & south america. happens every 5-7 years and involves a shift in the usual climate of the pacific ocean
el nino conditions in the pacific
usual winds reverse, blowing west→east
australia: cold ocean waters, falling air leading to high pressure, low rainfall, drought & wildfires
peru & south america: warm ocean waters, rising air leading to low pressure, high rainfall, storms & flooding
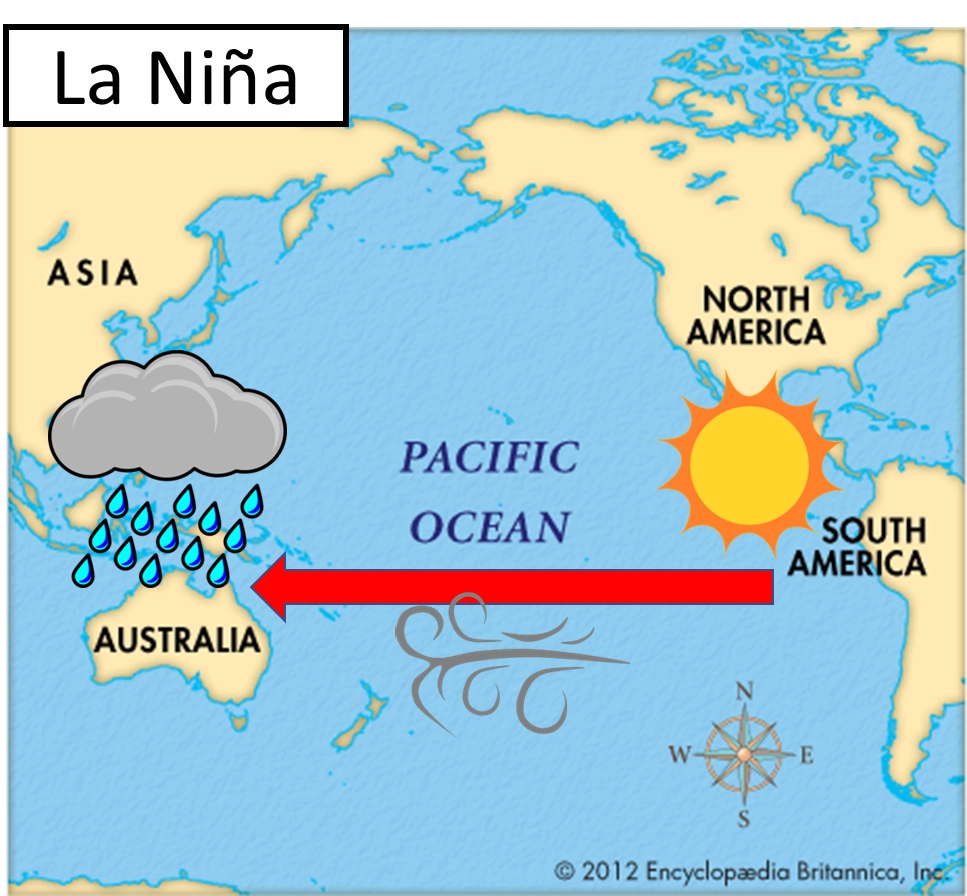
la nina conditions in the pacific
conditions are the same as a usual year but more extreme. could (but doesnt always) follow an el nino event
opposite impacts to el nino: australia = flooding, peru = droughts
tropical storm formation
occur in late summer & early autumn when oceans are warmest
form between 5o & 15o where trade winds meet. must be at least 5o so the coriolis effect can start the storm spinning
ocean must be at least 26.5oC and 60m deep. depend on a warm ocean for energy so it dies when reaching land. steered by light winds at sea
ocean water evaporates
air above the ocean warms up & rises
this creates low pressure which sucks in air from trade winds. winds spiral & absorb more moisture from the ocean
humid air forms storm clouds
cool air sinks, creating an area of calm, clear conditions (eye)
effects of tropical storms
strong winds can blow roofs of buildings, tear down trees & crops, damage communication & transport networks
heavy rain can cause short term flash flooding (especially in urban areas), mudslides & landslides, and flooding downstream
low air pressure raises the sea level (especially as the storm nears land) leading to coastal flooding
industries eg fishing, shipping, transport & tourism are vulnerable to tropical storms. millions of people living along coastlines are affected
typhoon hayan
hit the phillippines in november 2013. category 5 storm, winds over 315km/h
philippines stats
7th most populous nation in asia
population 98.4 people
LIDC, GDP per capita $2,765 (less money for preparation, defences, rebuilding)
typhoon haiyan impacts
worst impact = storm surge: 7.5m at the coast, 5m at Tacloban city where 5,800 people were killed.
90% of buildings in TC destroyed, electricity supplies cut, infrastructure & communications destroyed. 5 million people had their homes destroyed/become uninhabitable. airport unusable
estimated 6,340 fatalities, almost all in Tacloban city / the Visayas region
looting & assault during early days (only 100/1300 police officers reported for duty). relief trucks attacked & looted. martial law declared to maintain order
hospitals run low on supplies & shut (lack of staff, safety regulations)
agriculture, fishing, tourism & manufacturing industries damaged = large economic setbacks
storm surge
a sea level rise experienced in a tropical storm due to low pressure & strong winds
often causes coastal flooding & is the cause of most deaths in a tropical storm
typhoon haiyan responses
UN fundraising appeal raised $788 million. foreign nations donated total of $550 million. but total damage was over $8 billion and only 20% of those requiring aid had received it by mid november
attempts to move 1000s of people by military aircraft were slowed by miscommunication & panic
US sent marines & navy personnel, UK sent air force & navy
government grants for local fishing businesses to buy new boats. rice seed provided for farmers by oxfam. tent schools built by save the children
soft engineering schemes to reduce future storm impact: mangrove plantations & afforestation (create windbreaks & stabilise soil), Philippines Weather Service warnings via internet & social media
uk heatwave
2018 (joint hottest summer for UK). temps 35.3oC
UK heatwave causes
jet stream was further north than usual meaning high pressure weather stayed over the UK for a long time & weren’t moved away
high pressure prevented formation of clouds/rain. higher jet stream prevented clouds & storms coming
jet stream
a high altitude band of wind that blows at high speeds east → west
UK heatwave impacts
4% revenue rise for businesses. ice cream sales rose by 24%, burgers by 14.4%, sausages by 5.1%
57% of population stayed in UK for summer = large tourism increase
UK economy gained total £31 billion (increased spending & staycations)
wildfires around manchester (winter hill & saddleworth moor). on SM 18km2 burnt. fires spread quickly due to changing wind direction. only extinguished after 3 weeks. 150 people evacuated. ecological impacts estimated to last 15 years
that summer there were 663 more deaths than the average. the NHS & care homes struggled to cope
food & farming industry - yields decreased by 20% and food prices increased by 5%
underground reached temps over 40o+, roads melted, rail tracks bent
driest summer in 57 years (only 15mm of rain in june) = low reservoir stocks & water shortages
UK heatwave responses
farmers were allowed to take more water from groundwater sources & river channel flow than usual for irrigation. however this raised criticism due to environmental impact
roads were shut down (melting tarmac), gritting trucks were put on standby, speed restrictions implemented for trains
hosepipe ban in august