research methods ☑️
1/109
There's no tags or description
Looks like no tags are added yet.
Name | Mastery | Learn | Test | Matching | Spaced | Call with Kai |
|---|
No analytics yet
Send a link to your students to track their progress
110 Terms
experimental method
aim
general statement about what’s being investigated, developed usually off sophisticated theories (eg to investigate whether drinking energy drinks make people more talkative)
hypothesis meaning
pre-study statement that operationalises the variables as stated by the theory (a prediction of the research results)
hypothesis types
directional hypothesis: direct, stating a sure difference between the two conditions, has superlatives, and based on past research. (eg drinking energy drinks makes people become more talkative) - one tailed
non-directional: stating there’ll be a difference between conditions without specifying what direction (drinking energy drinks causes a reaction different from not drinking energy drinks) - two tailed
null: no specific change between signified conditions (eg there will be no change between drinking energy drinks and not drinking energy drinks)
types of variables and meanings
-independent variables (IV) - manipulated by the researcher or naturally changed, which has an affect on the DV
-dependent variables (DV) - whats measured by the researcher, any affect on the DV should be due to change in the IV
-confounding variables (CVs) - an outside influence that distorts the relationship between the independent and dependent variables, creating false correlations
extraneous variables (EVs)
variables that arent the IV that may affect the DV if theyre not controlled or removed
-participant: individual p differences (controlled by repeated measures/ matched pairs)
-situational: environmental factors (e.g. noise), controlled by standardised procedures
-researcher effects: controlled by double blind procedures
-demand characteristics/ participant reactivity: controlled by single blind procedures
demand characteristics/ participant reactivity
when individuals change their behaviour or answers in attempt to please the researcher due to cues that convey the study’s purpose, eg:
prior knowledge of study from other p’s
how researcher approaches p and acts towards them
environment
minimising effect of CVs and EVs
-randomisation: to reduce bias from researcher effects (for design, order of conditions, p selection)
-standardisation: using same, exact formalised procedures and instructions for every p (eliminates non-standardised procedures from becoming possible extraneous or confounding variables)
types of experimental designs
independent group design (between groups)
repeated measures (within groups)
matched pairs
experimental designs
independent designs
-two participant groups experience different experimental conditions (p’s only experience 1 IV level) condition A ≠ condition B, where performance of both groups is compared
-eg group 1 drinks energy drink (experimental group) and group 2 drinks water (control group)
experimental designs
independent groups design
evaluation
strengths:
no order effects, eliminated demand characteristics (less likely to guess aim), increased representation (more p’s = more variation)
weaknesses:
increased participant (EVs) can lead to CVs, more ps for the same amount of data; time consuming, costly, less validity
solution: random allocation ensures each p has same chance of being in both conditions.
experimental designs
repeated measures (within groups)
-ps experience both IV conditions (drink water + energy drink)
strengths:
fewer p’s; less money + saves time, more control as EVs are eliminated (higher validity)
limitations:
order effects (eg energy drink first affects water condition), prone to demand characteristics: easy for p’s to guess the study’s aim, time consuming for p’s
solution: counterbalancing- alternate order that group does each condition (AB-BA)
experimental designs
matched pairs
-ps matched on key mutual variables (eg age, gender, race). each single pair randomly placed into experimental or control group
strengths:
reduced order effects, minimises demand characteristics (less chance to guess aim), controls the CV of EVs
limitations:
more time consuming to recruit specific ps, cannot perfectly match pairs (participant variables with still arise), large pool of potential p’s needed, and difficult to know which variables are appropriate to match for
types of experiments
laboratory experiments
field experiments
natural experiments
quasi experiments
types of experiments
laboratory experiments
environmental factors (noise, temperature) highly controlled + standardised procedures used for accurate measurements.
strengths:
high degree or control over EVs + CVs; ensures DV is directly due to IV ∴ high internal validity, easy replication as standardised, less time consuming
limitations:
lacks generalisability; unnatural environment not reflective of everyday life; low external validity + mundane realism, higher demand characteristics, experimenter bias
types of experiments
field experiment
familiar, naturalistic, everyday setting of p’s to avoid artificiality (eg school or work)
strengths:
high external + ecological validity due to natural settings, high mundane realism (authentic behaviour ∴ accurate results), high external validity + no demand characteristics when observations are covert
limitations:
less EV control = cause and effect of DV is difficult to establish ∴ low internal validity, ethical issues due to no informed consent, precise replication is often not possible
types of experiments
natural experiments
-where two IV levels occur naturally without the influence or manipulation of the researcher, who simply records change in DV between two levels
strengths:
provides research opportunities in areas not studied for ethical or practical reasons, high external validity + no demand characteristics
limitations:
hard to replicate ∴ not generalisable, difficult to randomise p’s to experimental conditions so EVs and CVs arise, some research may be conducted in lab + may lack realism/ prone to demand characteristics
types of experiments
quasi-experiments
-IV hasn’t been determined by the researcher, but naturally exists (age, race, sexuality). p’s can be randomly assigned the IV levels
strengths:
controlled conditions ∴ high internal validity and replicable, only way to experimentally study pre-existing characteristics of p’s
limitations:
can’t randomly allocate p’s to conditions so prone to CVs and EVs, IV may not be caused by the observed change
types of sampling
random sampling
systematic sampling
opportunity sampling
volunteer sampling
stratified sampling
types of sampling
random sampling
-each p has an equal chance of being selected; from a lottery method (name/number generator)
strengths:
potentially unbiased (no researcher bias), CVs and EVs should theoretically be equally divided (enhancing internal validity), likely to provide a more representative sample
limitations:
impractical as p information is hard to obtain, small minority groups may distort results, may not be representative, volunteer bias (p’s can refuse if selected)
types of sampling
systematic sampling
-every nth number of the target population selected from a predetermined sample frame system (every 5th household on the street). usually begins randomly to reduce bias
strengths:
offers unbiased chance of representative sample, no researcher bias ∴ objective
limitations:
impractical to obtain sample frame, volunteer bias-chance of refusal
types of sampling
opportunity sample
-simply selecting anyone willing and available at the time (conveniently recruited)
strengths:
easy, quick, practical + inexpensive
limitations:
not representative not generalisable as only drawn from a specific area + researcher bias
types of sampling
volunteer sample
-self selection. ps choose to take part in response to an advert, volunteer or when asked to
strengths:
quick access to willing p’s, more engaged and motivated p’s
limitations:
volunteer bias (may attract certain types of people, could effect generalisability), risk of money motivated intentions could cause p’s to not take it seriously
types of sampling
stratified sampling
-where sample composition reflects proportions of strata in target population
strengths:
avoids misinterpretation so easy generalisation of findings
limitations:
impractical (time and resources)
can’t fully reflect the target population
ethical issues
informed consent
deception
protection of harm
privacy and confidentiality
ethical issues and solutions
informed consent
-making p’s aware of researchers aims, procedures, rights (to withdraw) and uses of findings, allows p’s to make informed decisions about participation without pressure (debrief)
-must obtain consent from p or their guardian
solutions:
prior general consent - permission to take part in many studies, where one includes deception
presumptive consent
retrospective consent - asked for consent after study
ethical issues and solutions
deception
-deliberately misleading or withholding information from p’s during study.
-only seen as justifiable if it doesn’t cause undue stress or knowledge that it could increase result validity
solutions:
-ps should receive debreif after study where nature + data use is disclosed, where they have a right to withhold data if they wish
ethical issues and solutions
protection of harm
-p’s must not be placed at any more risk than they would be in their daily lives + must be protected from physical or psychological harm, including not feeling embarrassed, inadequate or stressed
solution:
counselling
assure p’s that their behaviour was natural
constantly remind them of their right to withdraw
prior ‘cost benefit analysis’ (ethics committee weigh pros and cons)
ethical issues and solutions
privacy and confidentiality
-right of privacy states p’s can control information used and released about themselves, under the data protection act by the BPS (british psychological society); means all personal data is protected
solutions:
anonymising names, adresses and p’s details
destroying information after data collection
password protected laptops + memory sticks
pilot studies
-small scale version of an investigation done before the real study to allow potential problems to be identified + modified, saving money and time in long run
-used for experimental studies and self report methods to remove ambiguity and confusing questions, or in observational studies to check coding systems
control procedures
-single blind procedures: researchers don’t tell p’s whether they’re in control or experimental conditions, to avoid demand characteristics + bias
-double blind procedures: p’s nor researchers know what groups are used (usually controlled by a 3rd party) to avoid demand characteristics, placebo effect and investigator effects
control conditions- baseline condition to compare test condition + ensure DV change was simply due to IV
types of observational techniques
benefits of using observational techniques
non experimental methods that provide insight to what people do without having to ask + allows flexibility to study complex behaviours between variables in a natural way
used when unable to manipulate variables due to ethics, vague research questions or sensitive topics
naturalistic observations
controlled observations
covert observations
overt observations
participant observations
non-participant observations
observational techniques
naturalistic observations
-watching and recording behaviour in setting where it would usually take place (field experiments)
strengths:
high external validity due to generalisable findings, high ecological validity due to field environment, no demand characteristics, special insight to behaviour
limitations:
hard replication due to no control over CVs and EVs ∴ harder to judge behavioural patterns, low ecological validity if participants discover they’re being watched
observational techniques
controlled observation
-watching and recording behavior in structure environments (lab experiment, especially with two way mirror to not disturb)
strengths:
easy to replicate as more EVs and CVs control, allows researchers to focus on particular behavioural research
limitations:
low mundane realism ∴ low ecological validity, more unnatural behavior due to unnatural environment, likely to have demand characteristics
observational techniques
covert observations
-p’s are unaware their behavior is being watched and recorded
-must be public and happening regardless for observation to considered ethical
strengths:
no demand characteristics, natural behaviour increases internal validity, low chance of p guessing aims
limitations:
ethical issues (no informed consent + privacy invasion)
observational techniques
overt observations
-p’s are watched and their behaviour recorded while knowing they are being watched (informed consent)
strengths:
ethically acceptable
limitations:
prone to unnatural behaviour from demand characteristics ∴ reduces validity of findings
observational techniques
participant observations
-researcher who’s observing is part of the group being observed to produce a first hand account
strengths:
more insightful, increasing findings validity
limitations
p’s could discover they’re being watched
researcher could lose objectivity and start to identify strongly with p’s
observational techniques
non-participant observations
-researcher remains separate from p’s and record behaviours in a more objective manner.
-usually used when it’s impractical to blend in (eg old woman observing at all boys school)
strength:
allows researchers to maintain objective psychological distance from p’s
limitations:
may lose valuable insight
open to observer bias for stereotypes the observer is aware of (may have higher expectations than results show)
observational designs
-ways of recording data
unstructured observation
structured observation
behavioural categories
observational designs
unstructured observations
-where the researcher writes down everything they see during continuous recordings. usually only appropriate when observations are small scale and only involve few p’s
strengths:
more richness + depth in qualitative data collected
limitations:
qualitative data is harder to record, analyse and compare
greater risk of observer bias (only record ‘catch by the eye’ behaviours)
observational designs
structured observation
-researcher picks specific target behaviours to observe (predetermined list of behaviours + sampling methods)
strengths:
more systematic ∴ easier + convenient
qualitative data colected
less risk of observer bias
limitations:
not much detail depth
difficult to achieve high inter-observer reliability as filling predetermined list is subjective
observational designs
behavioural categories
-when a target behaviour being observed is broken into more precise, observable and measurable components (operationalising eg aggressive behaviour can be broken into shouting + screaming)
-similar behaviours (smile + grin) shouldn’t be listed. should be as unambiguous as possible with no further interpretation.
sampling methods
event sampling
-counting the number of times a particular behaviour is carried out by the target group/ individual.
strengths:
good for infrequent behaviours that are likely to be missed in time sampling
limitations:
if complete behaviours are observed important behavioural details can be overlooked by the observer
counting errors if behaviour is frequent
may be difficult to judge start + end of behaviour
sampling methods
time sampling
-recording behaviour with a pre-established time frame
strengths:
reduces number of observations (saves time)
limitations:
can be unrepresentative of the observation as a whole
inter-observer reliability
-single observers may miss important details or may only notice events that confirm their opinions or hypothesis (bias) so observations should be carried out by at least two researchers.
questionnaires designs
-self report technique where p’s provide information about their thoughts and feelings through pre-determined set of questions
-may be used as part of a dormant to access the DV (eg views of drugs with age)
strengths:
cost-effective
gather large data amounts due to ability to be widely distributed
reduces researcher effort, no obligation to be present
straight-forward to answer (if not ambiguous)
anonymity increases participation + willingness
limitations:
prone to untruthful responses from demand characteristics + social desirability bias
time consuming to design
participant and response bias
difficult to establish target population
open questions
-questions phrased to make p’s freely answer (no restriction to response) - collects qualitative data (rich in depth + detail, and useful for sensitive topics for elaboration but difficult to convert to statistical data)
closed questions
-offers a fixed number of responses (restrictions) - produces quantitative data (easy to analyse and compare with other data), but lacks depth and detail + can be limiting, which frustrates p’s
designing questionnaires
-likert scales (scale of five points from strongly agree (1) or strongly disagree (5))
-semantic differential scale (given two ends of an extreme and must label where you are (like a time-line scale ‘extremely happy’ on one end and ‘extremely sad’ on the other, and u have to pick how u feel between the two points))
-rating scales (scales based on a particular topic and usually ranges along the lines of ‘very interesting’ to ‘not interesting at all’)
-fixed choice option/dichotomous scale (set of predetermined questions to choose from (eg tick boxes in science exams))
self-report techniques
interviews
structured
-predetermined set of questions asked during the interview (a face to face conducted questionnaire).
-standardised and replicable; comparable to other interviews
-interviewer and interpretation bias, time consuming to analyse and interpret and not being able to elaborate can limit data richness and frustrate p’s, social desirability bias due to no anonymity
self-report techniques
interviews
unstructured interviews
-no predetermined questions; open-ended tailored questions based on research and intended information to collect (free flowing conversation with chance to extend and elaborate on their answers)
-rich data; tailored questions for wider insight, useful for complex and sensitive subjects (relaxed dialogue increases internal validity)
-requires skilled interviewers, social desirability bias and interviewer bias, hard to compare and analyse data
designing interviews
-quiet rooms to encourage p’s to open up, using interview schedule and beginning with neutral questions to encourage p to feel relaxed and comfortable, increasing p’s confidence
construction of self-report techniques
-clarity; unambiguously-phrased questions where the respondent can answer with good understanding
-sequencing questions; easy ones followed by hard ones to build p’s confidence
-filler questions; unrelated questions to prevent p’s from guessing the aim (prevents demand characteristics)
-pilot study; ensures questionnaire is suitable so amendments can be made
-overuse of jargon; arcane words specific to a field or area, should be easily understood and comprehensible
-emotive language and leading influence; (eg: ‘do u agree that boring is barbaric?’ compared to ‘do u like boxing?’)
-double barrelled questions: ask two different things at once (eg do u agree that the food was great and the service was bad?)
-double negatives
correlations
-the strength and direction of an association between two or more co-variables.
-plotted on scatter graph
-the variables are simply being measured, not manipulated
-can only be used to find associations, not cause-and-effect relationships
correlations
types of correlations
-positive correlations: as one co-variable increases, the other increases (eg as number of people increase, noise volume does too)
-negative correlations: as one co-variable increases, the other decreases (eg as number of people in the room increase, personal space decreases)
-zero correlation: no relationship found between the two co-variables (no LOBF available; correlation co-efficient of zero)
correlations
evaluation
assesses strength and direction of a relationship, allowing precise and quantifiable measure of how two variables are related. used as a starting point to assess possible patterns before committing to experimental study; quick and economical as secondary data can be used, no IVs to be manipulated
studies can only tell us how variables are relates and not how due to lack of experimental manipulation and control. cant be causal or tell us which variable is causing the other to change (does drinking caffeine make people more anxious, or do anxious people drink more caffeine as a result). intervening variables (third variable problem) can cause the relationship between the two variables can cause misrepresented correlations
correlations
correlational hypotheses’
-need to clearly state what the co-variables are, and still operationalise them
-they can be directional (eg there is a positive correlation between price and quality) or non-directional (eg there is a correlation between price and quality)
correlation co-effecient
-number between -1 and +1 that represents the direction and strength of the relationship between co-variables, where +1 represents a perfect strong correlation and a value of -1 represents a perfect negative correlation
-the closer to +1, the stronger the co-variable relationship; the closer to -1, the weaker the co-variable relationship; closer to 0 means weak or negligible
types of data
qualitative data
quantitative data
primary data
secondary data
meta-analysis
types of data
qualitative data
-expressed in words (eg interview/ counselling transcript, diary extract)
strengths: more richness and depth in detail, allows ps to elaborate on opinions, greater external validity +more meaningful insights
limitations: difficult to analyse + compare, presents researcher bias as conclusions rely on subjective interpretations (interpretative bias)
types of data
quantitative data
-numerically expressed data
strengths: can be analysed statistically and converted by graphs or charts ∴ easy to compare, more objective ∴ less open to bias
limitations: lacks depth in detail (no meaningful insight to p’s views), low external validity due to being unable to elaborate
types of data
primary data (aka field research)
-original data collected by the researcher specifically for their investigation purposes
strengths: targets intended, authentic information
limitations: requires more time, effort (planning, preparation and resources when conducting an experiment; expensive)
types of data
secondary data
-pre-existing information collected by someone other than the researcher
strengths: inexpensive and easily accessible (minimal effort required ∴ more convenient)
limitations: data could be outdated or incomplete, might not match exact needs, researcher may be unsure of quality, accuracy or validity
types of data
meta-analysis
-researcher combines results from multiple studies to form a general overview of the intended subject
strengths: easy generalisability, ensures validity if multiple sources are identical
limitations: publication bias presented with the file drawer bias problem
measures of central tendency
-averages give us information about the most typical values in the data set
-mean: most sensitive as it includes all scores within calculation; more representative of the data as a whole
-median (middle value in the data set when scores are arranged from highest to lowest) - not affected by extreme scores, less sensitive as all other values are ignored, but extreme values may be important
-mode (most frequently occurring score/value within the data set), not representative of the whole data set, however is sometimes the only appropriate method to use (in a score of 1-10)
measures of dispersion
-based on the spread of scores (how far scores vary and differ between each other)
-range: worked out by taking the smallest value away from the largest number, and adding one (to account for margin of error). influenced by outliers and doesnt indicate whether numbers are closely grouped around the mean and spread out
-standard deviation: tells us how far scores deviate from the mean; larger SD = greater data dispersion (suggests not all ps affected by the IV in the same way, vice versa). more precise than range as includes all values in calculation, but can be distorted by extreme values.
presentations of quantitative data
bar charts used with discrete (nominal) data
scattergrams used for associations, not differences (correlational data)
histograms use continuous (ordinal) data
normal distributions are symmetrical, with most people (modal, mean and median value: all occupying the same space) in the middle area of the curve and few people on the extreme ends
skewed distributions lean to one side: positive skew is where data is concentrated to the left (l shape). mode is at the highest point of the peak, median next, mean is across the tail. the opposite is a negative skew.
the role of peer review
before a piece of research can become a part of an academic journal or textbook, it must be scrutinised by minimum 3 other researchers of that field; should be objective and unknown to the researcher. done to:
allocate research funding to research projects most worthwhile
validates quality and relevance of research: hypotheses formulation, methodology chosen, statistical tests used and conclusions drawn
suggest amendments and improvments, or may conclude work is inappropriate for publication
peer review
evaluation
peer doing the review remains anonymous; likely to produce more honest, objective appraisal, however anonymity could allow researchers to sabotage each other on basis of limited research funding
publication bias - file draw problem where preference to publish positive results, or journals wanting to publish headline-grabbing results. research not meeting this criteria at risk of being disregarded or ignored, creates false impression of field.
burying ground breaking research that may contradict peers own view. findings that chime with current opinion more likely to be passed than new innovative research that challenges established order, therefore peer review could slow rate of change.
implications of psychological research for the economy
psychological research into the role of the father shows both parents as equally capable of providing emotional support necessary for healthy psychological development, promoting flexible working arrangements in the family, meaning modern parents can maximise their income and contribute more effectively to the economy (through taxes)
absence from work costs economy $15b per annum, 1/3 caused by mental health disorders. psychological research into mental health disorders plays important role in supporting a healthy workforce (eg SSRIs, CBT, SD). means many people able to manage their conditions effectively and return to work, helping the economy.
case studies
detailed, in-depth investigation + analysis of a single individual, group, institution or event. often involve unusual situations, eg person with a rare disorder (eg clive wearing), however they may be more typical, like elderly childhood recollection
-usually produces qualitative data and are longitudinal
case studies
evaluation
strengths:
-offers rich, detailed insights that shed light to atypical behaviour, so may be more preferred to more superficial forms of data collection, like experiments or questionnaires
-contribute to our understanding of typical functioning (eg HM demonstrated typical memory processing; existence of seperate stores in STM and LTM, significant)
-can generate hypotheses for future studies + one solitary and contradictory instance may lead to the revision of an entire theory
limitations:
-generalisation of findings with small sample sizes + information that makes it to the final report is based on the subjective selection and interpretation of the researcher
-personal accounts from subject or their family may be prone to inaccuracy or memory decay, meaning evidence from case study may have low validity
content analysis
-a type of observational research in which people are studied indirectly via the communications they have produced (eg texts, emails, tv, film and other media). aim is to summarise and describe the communication systemically so overall conclusions can be made
content analysis
coding and quantitative data
-the initial stage of content analysis: researcher categorises data to be analysed into meaningful units (counting amount of times a word (or semantic field) or topic is mentioned) to produce quantitative data
content analysis
thematic analysis and quantitative data
-thematic analysis is a qualitative form of content analysis; involves the identification of themes - likely to be more descriptive than coding units.
-once developed themes cover most aspects of the data, they collect a new set of data to test the validity of the themes and categories. once done, the researcher will write up the final report, typically using the direct quotes from the data to illustrate each theme.
content analysis
evaluation
-can circumnavigate ethical issues normally associated with psychological research. much of the material may already exist within the public domain (high external validity) so no issue with obtaining it without permission; able to access sensitive data
-flexible; able to produce quantitative and qualitative data depending on research’s aims
-indirectly studying someone’s communications is done decontextualises behaviour; researcher may attribute opinions and motivations to the speaker/writer that were not intended (most modern researchers are clear about how their own biases may have influenced their research)
-therefore, suffers from lack of objectivity, especially when more descriptive forms of thematic analysis are employed
reliability
-how consistent a measuring device is, includes psychological tests or observations which assess behaviour. if a test is done twice, results should be the same for the measurement to be considered reliable (ruler should find the same measurement for a particular object every time its measured)
ways of testing reliability
test-retest
-administering the same test or questionnaire to the same person on different occasions. if the test or questionnaire is reliable, the results should be the same or congruent (commonly used with questionnaires and psychological tests)
must be sufficient time between test and retest to ensure p cant recall previous answers, but not so long that their attitudes and opinions wouldve changed.
for questionnaire or test, the scores are correlated and if correlation is significant, the reliability of the measuring instrument is assumed to be good.
ways of assessing reliability
inter-observer reliability
-where two researchers conduct the same research to prevent researcher interpretation (subjectivity) bias and unreliability. one observers interpretation of events may differ widely from another’s.
-a pilot study of the observation to make sure observers are applying behavioural categories in the same way, or a comparison. the researchers watch the same event, record their data independently and correlate their findings to assess its reliability.
reliability
measuring reliability
when the correlation analysis is done, the correlation coefficient should exceed +0.80 for reliability
-any score lower than this should result in the researcher redesigning the test or questionnaire, or reassess their observational categories; closed, fixed choice, objective questions
reliability
improving reliability
interviews
-use same interviewer each time. if this isn’t possible or practical, give all researchers standardised training.
-structured interviews are more reliable as interviewer’s behavior is more controlled by fixed questions. unstructured interviews are more free flowing and are less likely to be reliable
reliability
improving reliability
observations
-behavioural categories to all be properly operationalised, measurable and self-evident. categories shouldn’t overlap and all possible behaviours should be covered on the checklist. (if this isn’t done, researchers have to make their own judgement of what to record where and may end up with differing and inconsistent records)
for experiments: standardised procedures should be used every time!
validity
-the extent to which an observed effect is genuine - does it measure what it was supposed to measure and can it be generalised beyond the research setting within which it was found?
validity
internal validity
whether the effects observed in an experiment are due to the manipulation of the IV and not another factor.
demand characteristics or ‘please-U effect’, causes low internal validity (eg criticism for milgram study that p’s responded to demands of the situation rather than the stimulus)
validity
external validity
-related to factors outside the investigation; is it generalisable to other settings, populations or eras?
-ecological validity: generalising the findings from a study to a setting; if the task used to measure the DV isn’t like everyday life (low mundane realism), the study has lower ecological validity.
validity
temporal validity
-whether findings from a particular study within a particular theory hold true over time (eg critics suggest high conformity rates in asch’ research were a product of a particularly conformist era in american history)
validity
ways of assessing validity
-face validity: a measure is scrutinised to determine whether it appears to measure what it’s supposed to measure (e.g. does a test of anxiety look like it measures anxiety)
-concurrent validity: extent to which a psychological measure relates to an existing, similar, and well-established test
improving validity in experiments
using a control group means researcher is better able to access whether changes in the DV were due to effect directly of the IV.
standardised procedures to minimise impact of participant reactivity and investigator effects on the validity of the outcome (single and double blind tests also have the same aim)
improving validity in questionnaires
many questionnaires and psychological tests incorporate a lie scale to assess the consistency of a respondents response and to control the effects of social desirability bias. validity may be further enhanced by assuring respondents that all data submitted will remain anonymous
improving validity in observations
-minimal intervention from researcher means most observation studies produce findings with high ecological validity (more so for covert observations where behaviour is more natural and authentic)
-behavioural categories that are too broad, overlapping or ambiguous may have a negative impact on the validity of the data collected
improving validity for qualitative research
-the depth and detail of case studies and interviews is better able to reflect a participants reality, so qualitative methods of research are considered to have higher ecological validity than quantitative, less interpretative methods
-researchers can demonstrate interpretive validity through coherence of their narrative by inclusions of direct quotes from p’s within the report.
-further enhanced by triangulation; the use of different sources of evidence (personal diaries, interviews with friends and family, observations etc.)
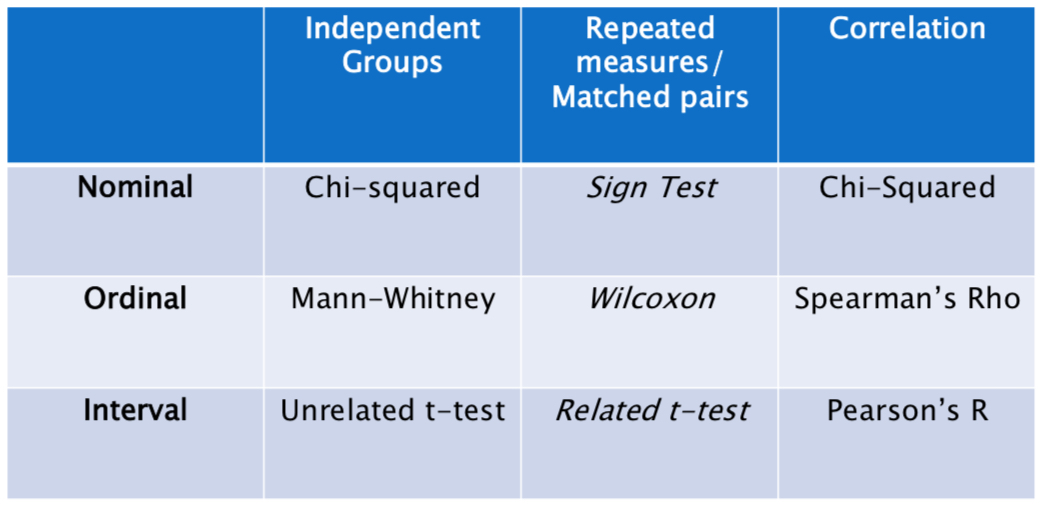
statistical tests
-used to determine whether a difference or association/ correlation found in an investigation is statistically significant; beyond what could have occurred by chance.
relevant statistical tests
copy this down!!!
Carrots Should Come
Mashed With Swede
Under Roast Potatoes
statistical tests
levels of measurement
nominal data: categorical data (eg gender, hair color) - can only appear in one of the categories
ordinal data: ordered in some way (eg scale; how much do u like psych scale of 1-10)
-lacks precision as it’s based on subjective opinion rather than objective measured, doesn’t measure observable physical entities (my version of 4/10 may differ to yours)
interval data: based on numerical scales that include units of equal, precisely defined size (public scales of measurement, like time or thermometer
-most precise and sophisticated form of data
rules for statistical tests’ significance
rule of r (for any statistical test with an r in its name, calculated value must be greater than or equal to the critical value for results to be significant)
for statistical tests without an r, if the calculated value is less than or equal to the critical value when p<0.05, results are significant and null hypothesis can be rejected.
for chi-sqaured
must know degrees of freedom (df) rather than n (number of ps), that will be shown in table uner one and two tailed hypotheses, where the level of significance (observed/calculated value) will be in table, ready to compare against chosen level of significance (critical value)
rf = (number of rows - 1) x (number of columns - 1)
probability and significance
-researchers begin investigations by writing a directional or non-directional hypothesis, depending on how certain they are on the outcome of the investigation (if prior research has been conducted and published on that particular topic)
the statistical test determines what hypothesis is true and thus whether we accept or reject the null hypothesis.
probability and significance
type 1 error (false positive): when the null hypothesis is rejected when it shouldve been accepted due to too high significance level (0.05 instead of 0.01)
type 2 error (false negative)- when the null hypothesis is accepted when it shouldve been rejected due to too low significance level
usual level of significance in pyshcology is p<=0.05 (means 5% chance that results were due to chance)
sections of a scientific report
abstract
introduction
method
results
discussion
referencing
sections of a scientific report
abstract
the first section; summary (150-200 words in length) of full study that includes all major elements: the aim, hypothesis, method/procedure, results and conclusion.
-for psychologists to read and identify which studies are worthy of further examination.