economics sac 2
1/38
There's no tags or description
Looks like no tags are added yet.
Name | Mastery | Learn | Test | Matching | Spaced | Call with Kai |
|---|
No analytics yet
Send a link to your students to track their progress
39 Terms
material living standards
the real purchasing power of income reflected in the quantity and quality of goods and services an individual can access, measured by real GDP per capita and income levels
non-material living standards
quality of life factors that cant be purchased directly with income
health and life expectancy, environmental quality, work-life balance, leisure time, stress levels, community safety, social cohesion
conflicting relationship between material living standards and non-material living standards
Environmental: An increase in material living standards can often result in climate change, greenhouse gases, extreme weather events, rising sea levels and wars over natural resources
Health and social: Rising incomes, desk type work styles and increased digital devices usage has improvements in material living standards but can negatively impact non-material living standards
Material: The government may introduce policies designed to promote non-material living standards but could potentially lower material living standards (e.g. limiting work hours to improve work-life balance may undermine national production and incomes)
compatible relationship between material and non-material living standards
Cultural enrichment: international travel and cultural experiences can increase material and non-material living standards
Longer life expectancy: higher incomes can be used to extend life expectancy and reduce daily suffering
Possibility to reduce environmental damage: higher incomes may be used to combat environmental damage and reduce pollution
More leisure time: higher incomes enable individuals to reduce working hours and stress
factors influencing material living standards
Levels of national production and income per person: measured by the annual rise in Gross Domestic Product (GDP) per capita (person)
An increase in level of national production will increase national income and consumption per head
However, national production and incomes must grow at a faster rate than population for people to enjoy higher material living standards
circular flow model
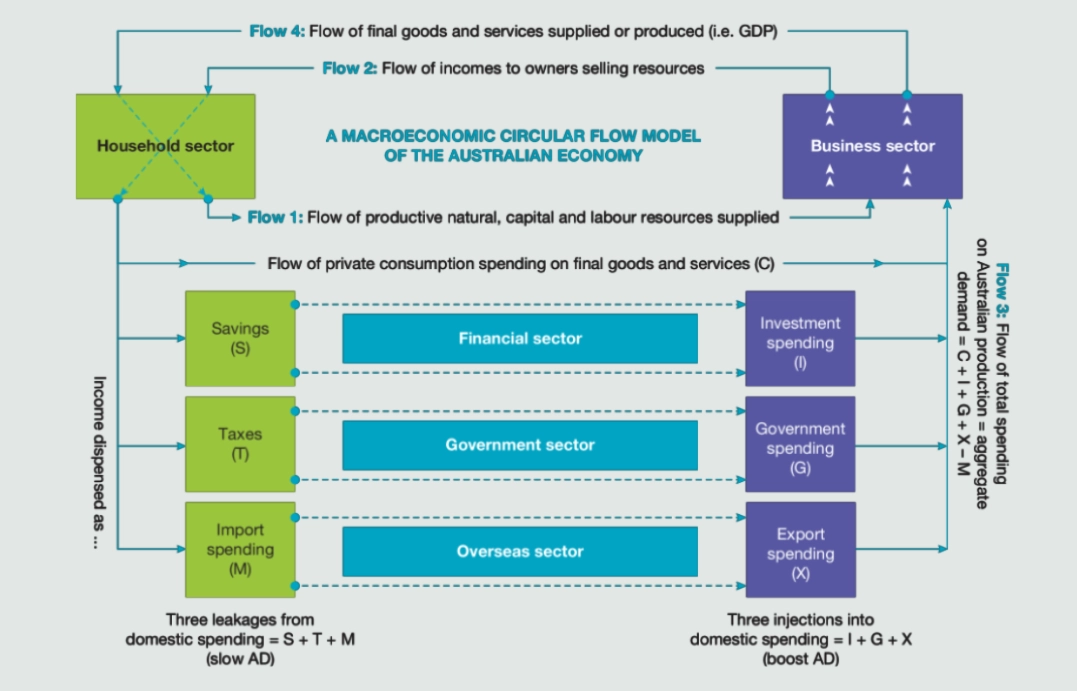
the role of each sector
Household sector: all individual members of Australia’s population who supply their resources in exchange for money/income to demand finished goods and services (C)
Business sector: all trading businesses who demand resources that are then converted into goods and services for supply
Financial sector: financial institutions who borrow the savings of households (S) to re-lend to customers who use it to finance investments (I)
Government sector: the government collects revenue from taxation (T) and use this money to provide public goods and services (G)
Overseas sector: Australians import goods and services (M) from overseas and export to people living overseas (X)
the 4 flows
Flow 1 — resources supplied to businesses: individuals of the household sector supply natural, labour and capital resources to businesses for production purposes
Flow 2 — income returned to owners of resources: businesses pay income to households as a reward for providing the resources. This can come in the form of wages for labour, rent for land or interest/dividends to capital providers
Flow 3 — aggregate demand (AD = C + I + G + (X-M)): the total value of all types of spending (demand) on Australian made goods and services by households and other sectors. Involves consumption spending and leakages + injections
Flow 4 — aggregate supply (real GDP): the total value of goods and services produced/supplied by the business sector (real GDP)
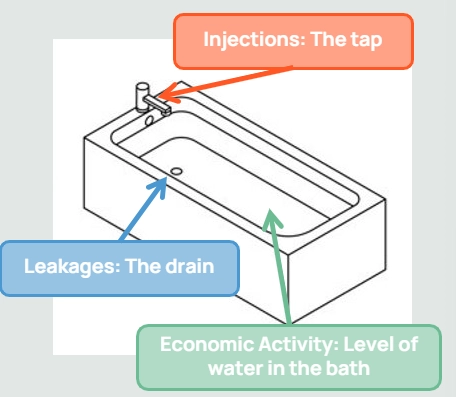
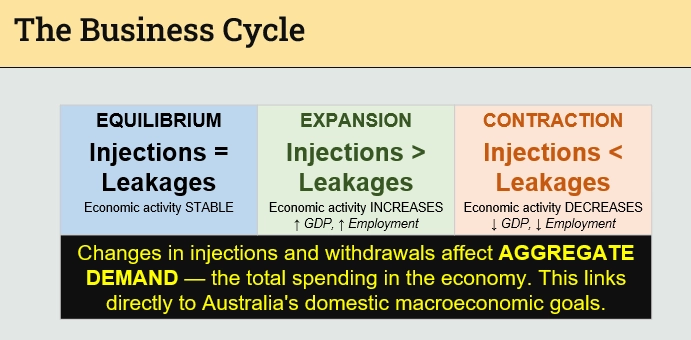
leakages and injections
Leakages occur when income leaves the economy. This decreases the level of economic activity occurring
Savings, taxes and imports
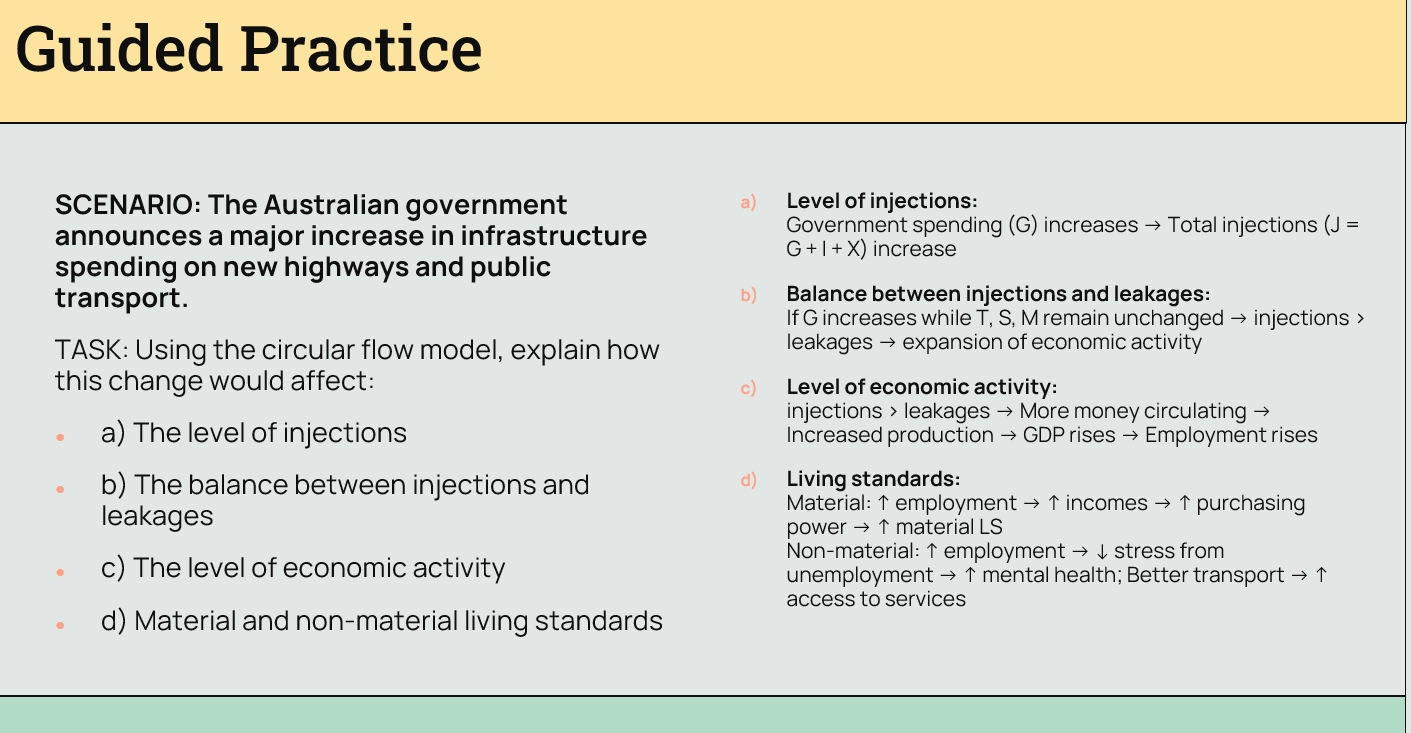
Injections occur when income is introduced into the economy. Economic activity rises as a result
Investment spending, government spending and exports
Note: consumption is not an injection
the business cycle
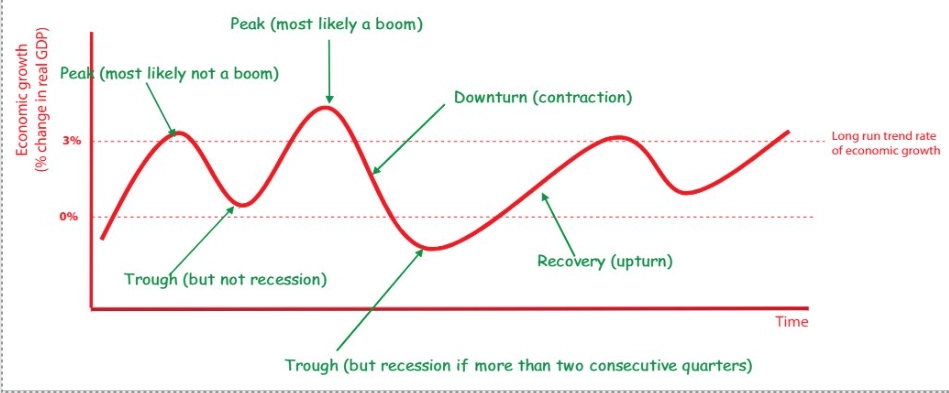
nature of the business cycle
shows fluctuations in economic activity over time, economists observe that economic activity moves in a ‘cycle’ or pattern
the 4 phases of the business cycle
expansionary/recovery phase, peak phase, slowdown/contraction phase, trough phase
expansionary/recovery phase
slow economic growth at first then gains pace
GDP increases from low levels, cyclical unemployment decreases and inflation increases
peak (sometimes boom) phase
economy is usually experiencing strong rates of economic growth
Peak: GDP at its highest, unemployment at its lowest and inflation at its highest
Boom: economic growth is excessive and unsustainable (operating outside of the PPF), increased inflationary pressures, demand for labour rises and shortages develop which increases wages that further add to inflationary pressures
slowdown/contraction phase
normally follows a peak/boom where GDP growth rate slows/may even fall below trend
GDP slower or decreases, unemployment increases and inflation decreases
Trough (sometimes recession if prolonged) phase
the level of economic activity reaches its minimum point in the cycle, which may turn into a recession (2 consecutive quarters of negative economic growth). A prolonged recession is referred to as a depression
GDP at its lowest/negative, unemployment at its highest and inflation at its lowest/negative

aggregate demand
the total spending on new final domestically made goods and services at each price level
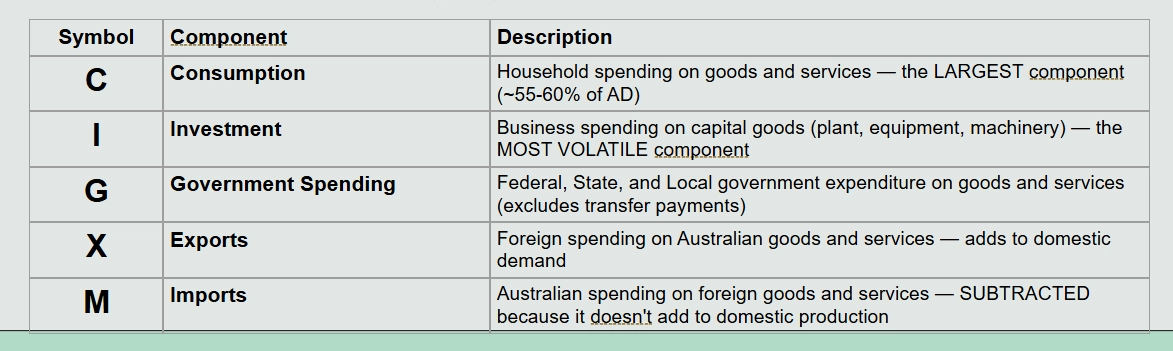
AD = C + I + G + (X - M)
AD curve
Diagram: AD curve sloping downward, price level on y-axis, real GDP on x-axis
At lower prices, more goods/services are demanded
aggregate supply
the total real value of goods and services that producers are willing and able to supply at each price level, depends on productive capacity — quantity and quality of factors of production

AS curve
Diagram: AS curve upward sloping, becoming steeper as economy approaches capacity
Higher prices motivate greater production at capacity, output can’t increase further
AD/AS equilibrium
Diagram: combined AD/AS showing equilibrium price level and real GDP
Key: changes in AD or AS shift curves and change equilibrium outcomes
AD conditions
private consumption, investment, government consumption, government investment, exports, imports
private consumption (C)
The total value of all expenditure on goods and services by households
Largest component, accounts for about 60% of total AD
Targeting this component has the most significant impact on AD
Spending on goods and services with short term economic benefits
Examples: food, transport, rent, clothing, entertainment
investment (I)
Investment expenditure by individuals and businesses on buildings and equipment with the purpose of producing other goods and services, designed to grow the businesses
The most volatile AD component — highly responsive to economic events
Less than about 22& of AD
Spending on goods and services with long term/ongoing economic benefits
Examples: Manufactured materials, machinery, buildings, computers, farm vehicles
government consumption (G1)
Government spending on the provision of public goods and services to satisfy society’s immediate needs and wants
Comprises of about 16% of total AD
Spending on goods and services with short term economic benefits
Examples: public sector wages, healthcare services, education services, defence operations
government investment (G2)
Government investment on capital or investment expenditure on equipment needed for public or economic infrastructure, expanding productive capacity and efficiency of resources
Spending on goods and services with long term/ongoing economic benefits
Only about 3% of AD
Examples: building schools, hospitals, roads, railways, telecommunication networks
exports (X)
Exports are Australian goods and services purchased by foreign households, businesses, governments and organisations
They are an ‘injection’ of funds into the domestic economy and thus increase AD
Examples: iron ore, coal, beef, wheat, wool
imports (M)
Imports (M)
Imports are foreign made goods and services bought by Australian household, businesses, governments and organisations
They are a ‘leakage’ of funds from our domestic economy and thus decrease AD
18-24% of AD each and the net impact is about 4% either way
Examples: cars, refined petroleum, electrical and electronic equipment, machinery
Net exports = X - M
factors that affect the level of AD
The AD curve can shift based on prevailing conditions in the economy
Disposable income
Interest rates (ability to borrow)
Business and consumer confidence
Exchange rates
Overseas economic growth
changes in disposable income
Total income minus taxes
An increase in the level of disposable income will cause more to be demanded at any given price
This could occur because of income tax cuts, increases in the minimum wage, increased transfer payments (i.e. money not earned, for example centrelink welfare payments)
changes in interest rates/borrowing power
The ability to borrow is affected by both the cost of borrowing (interest rates) and the willingness of financial institutions to release funds
High interest rates in recent years have decreased the demand for borrowed funds
consumer confidence
If consumer confidence is high, consumers have a more optimistic view of the state of the economy and therefore will have a greater propensity to spend (C)
In times of uncertainty, consumer confidence tends to drop
business confidence
If business confidence is high, businesses have a more optimistic view of the state of the economy and therefore will have a greater propensity to invest (I)
In times of uncertainty business confidence tends to drop (such as when a bank collapses or there is a pandemic)
the exchange rate
The exchange rate is the value of 1 currency in comparison to another
If AUD becomes relatively stronger, AD will fall due to exports becoming more expensive for foreigners and consumer spending on imports increases as foreign goods become cheaper
rates of growth overseas
Events that impact the economy of major trading partners often impact Australia’s level of AD
Better conditions overseas tend to mean more demand for exports as overseas customers will be more willing and able to buy them
Increased overseas economic growth results in increases to average incomes for those overseas, thus increasing demand for Australian goods and services as exports
How should you structure a response linking AD factors to goals?
Factor (demonstrate understanding of the factor)
AD components (AD = C + I + G + (X – M))
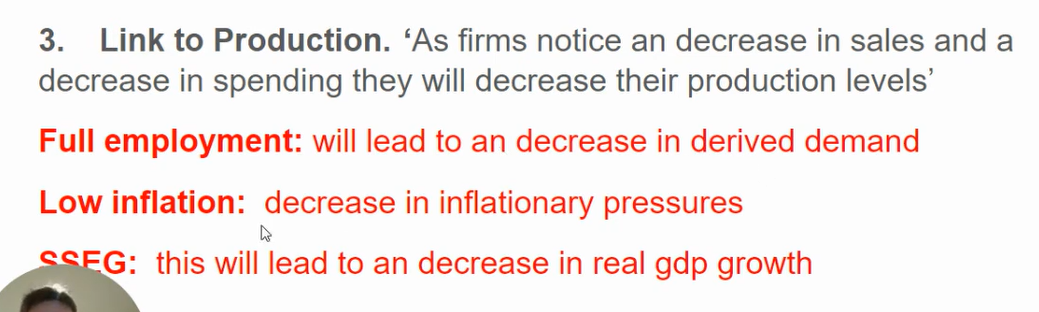
Link spending to production
Impact on the goal
AD curve
The total annual value of spending on Australian made goods and services is represented by the AD formula
The AD curve has a negative slope, as the overall quantity demanded decreases when there is a rise in the general price levels
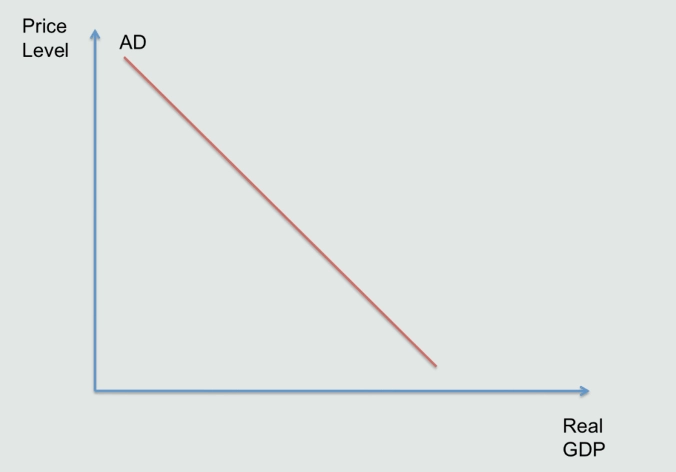
reasons for a downward sloping AD curve
Purchasing power effect
Higher prices will reduce purchasing power of savings and incomes, which will contract how much people can afford to buy
Interest rate effect
Higher price will also increase interest rates, making borrowing money more expensive which will contract how much people can afford to buy
Import substitution effect
Domestic price rises (inflation) encourages Australians to purchase cheaper imports of goods and services, decreasing spending on domestically produced goods and services
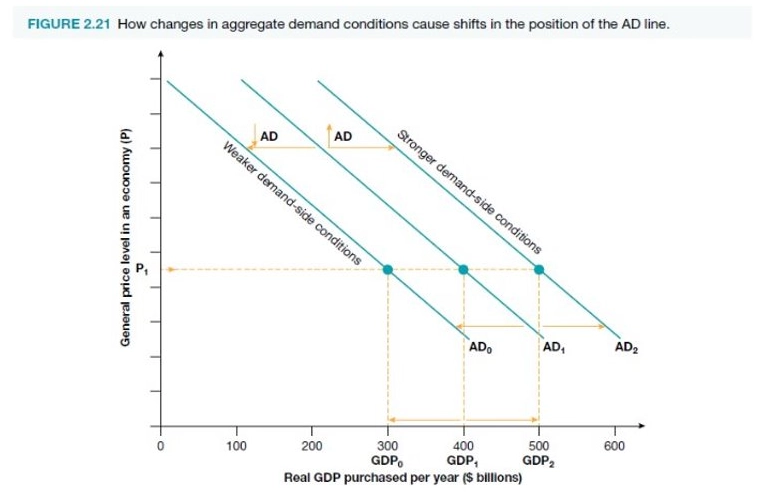
shifts of the AD curve
Changes in aggregate demand factors such as a change in consumer confidence, household disposable income etc. can alter the level of aggregate demand curve