AP Statistics Unit 1 (copy)
 Call Kai
 Learn
 Practice Test
 Spaced Repetition
 Match
 Flashcards
 Knowt Play
1/31

Earn XP
Description and Tags
32 Terms
variable
holds information about the same characteristic for many subjects
categorical data
Data that consists of names, labels, or other nonnumerical values
quantitative data
where the data collected is numerical and it makes sense to use it for numerical operations
frequency table
lists the categories for a categorical variable and displays the counts for each category
relative frequency table
lists the categories for a categorical variable and displays the percentages for each category
stem and leaf plot
A method of graphing a collection of numbers by placing the "stem" digits (or initial digits) in one column and the "leaf" digits (or remaining digits) out to the right.
dotplot
a display for either kind of data that uses a dot to represent each individual in the data set
symmetric distribution
a distribution whose shape is unimodal and each side is roughly a mirror image of the other
left skewed distribution
a distribution that has a concentration of data on the upper end and the tail on the left
right skewed distribution
a distribution with a concentration of data on the lower end and the tail on the right
outliers
values that fall outside the overall pattern of the data
mean
the average of the data values
median
the value in the center of an ordered data set
range
the maximum data value minus the minimum data value
first quartile
the value where 25 % of the data fall below it in an ordered list
third quartile
the value where 75% of the data falls below it in an ordered list
Interquartile Range (IQR)
the third quartile minus the first quartile
percentile
the place in the data where a certain percentage of the data falls below that value
5 number summary
includes the minimum, first quartile, median, third quartile, & the maximum
boxplot
a display for quantitative data that graphs the five-number summary on an axis and shows outliers if they exist
variance
the standard deviation squared, it is a measure of spread
resistant
word to describe when values that are not strongly affected by extremes
Conditional Distribution
a distribution of values for one variable that exists when you specify the values of other variables
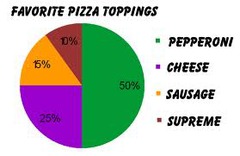
Pie Graph
used to show parts of a whole
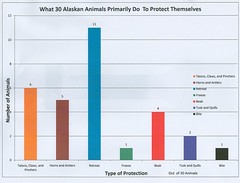
Bar Graph
a graph that uses vertical or horizontal bars to show comparisons among two or more items
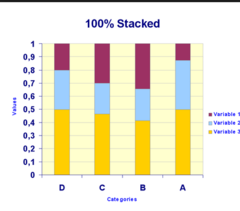
Segmented Bar Graph
Used to compare the distribution of a categorical variable in each of several groups.
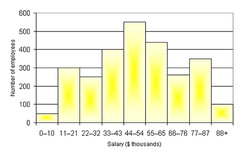
Histogram
a display for quantitative data that uses adjacent bars to represent counts or percentages of values falling in each interval
Measure of center
mean, median, mode
Measures of Spread
Range, Interquartile Range, Standard Deviation
How to describe a distribution
C-Context S - Shape O - Outliers C - Center S - Spread
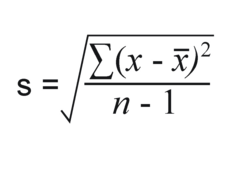
Standard Deviation
a measure of variability that describes an average distance of every score from the mean
marginal distribution
Distribution of values of that variable among all individuals described by the table.