EXAM 4
1/33
There's no tags or description
Looks like no tags are added yet.
Name | Mastery | Learn | Test | Matching | Spaced | Call with Kai |
|---|
No analytics yet
Send a link to your students to track their progress
34 Terms
When is Analysis of Variance (ANOVA) used?
used when comparing more than two groups.
Is information about the population known when doing One-way ANOVA?
No
What variables are used in one-way ANOVA?
IV (categorical) and DV (continuous)
What’s being compared in one-way ANOVA?
Variances between & within subject
What are the hypotheses in One-Way ANOVA?
Null hypothesis - the group means are the same. μ1 = μ2 = μ3.
Alternative hypothesis - at least one pair of group means is significantly different.
when there is at least one pair of group means that is significantly different, the F test is done.
Example of One-way ANOVA
Is there a difference in motivation between freshman, sophomore, juniors and seniors at GMU?
IV: academic year/class level (freshman, sophomore, junior, senior)
DV: motivation
One-Way
means one factor (1 categorial IV and 1 continuous DV)
What is the difference between “Within Subjects” and “Between Subjects”
Between Subjects
separate levels (groups)
Within Subjects
individual data points within a group
What is the new terminology of ANOVA?
Factor: the independent variable (categorical - grouping variable, e.g., Class Level)
Levels: the groups of the IV (the different conditions; e.g., freshman, sophomore, juniors, seniors)
formula of F-ratio
F = Variance (difference) between subjects / Variance (difference) within subjects
Why is f-ratio based on variance instead of sample mean difference?
because you can’t directly compare sample mean differences simultaneously among multiple groups. instead we use the sample mean variance to indirectly indicate sample variability in the sample means.
What is sample mean variance?
variance is a measure of the squared difference from the mean, indicating how much values vary from each other.
recall S² = ∑ ( x - x̄ )² / ( n -1 )
The Process of ANOVA
Find the total difference
Find within-subject difference
Find between-subject difference
Calculate the F-ratio
SS total = SS within + SS between
What are the degrees of freedom for ANOVA
df total = df within + df between
df total = N - 1
df between = k - 1
df within = N - k
k = number of groups, N = Sample size
How to get the f-statistic
compare the between-group variance to the within—group variance =
F = (SS between/ df between) / (SS within/ df within)
How to get the critical value in your F-distribution
You need df between as the numerator and df within as the denominator and use the F table
What are the assumptions of ANOVA
Assumption of Independence, Assumption of Normality, and Assumption of Homogeneity of Variance (Levene’s Test)
Effect size (Eta²)
r² (η²) = SS between / (SS between + SS within) = SS between / SS total.
Eta² represents the proportion of total variance in the dependent variable that is attributable to differences between groups defined by the independent variable.
It ranges from 0 to 1 (or 0% to 100%)
Higher values indicate more variance explained
What do you do after rejecting the null hypothesis in ANOVA.
Post-hoc tests to determine what groups are different
Tukey's HSD (equal variances and similar sample sizes)
Games-Howell (unequal variances or sample size)
Apa writing of One-Way ANOVA
One-way ANOVA was used to compare the three academic groups on their love of statistics. Results indicated significant differences between the three groups, F (2,12)= 9.63, p <.05. Post hoc comparisons using
Tukey's HSD test indicated that PhD students (M = 8.40, SD = 1.14) reported significantly greater love of statistics than undergraduate students (M = 3.60, SD = 2.07), p ‹.01. Master's students (M = 6.80, SD = 1.92) also reported significantly greater love than undergraduate students, p < .05. However, the difference between PhD students and master's students was not statistically significant, p = .354.
Non-Parametric Statistics
used to determine if what you observe in a distribution of frequency is what you would expect to occur by chance. (Chi-square test)
Difference between Parametric and Nonparametric tests
Parametric tests test hypotheses about population parameters (e.g., means, variances), while Nonparametric tests test hypotheses without assuming specific population parameters.
Parametric tests have a normal distribution of data and Nonparametric tests have distribution-free tests (sample sizes tend to be too small to even test for normality).
Parametric tests use continuous DV (Interval or Ratio data) and Nonparametric tests use categorical variables (Nominal or Ordinal data)
What are the two types of Chi-Square test?
Goodness of Fit Test and Test for Independence.
Goodness Of Fit
examines how well a single variable’s (categorical) distribution matches expectations. individuals are classified into categories.
How to compute the goodness-of-fit chi-square test statistic (obtained value)?
X² = ∑ ( (O - E)² / E) )
where
X² is the chi-square value,
∑ is the summation sign,
O is the observed frequency, and
E is the expected frequency
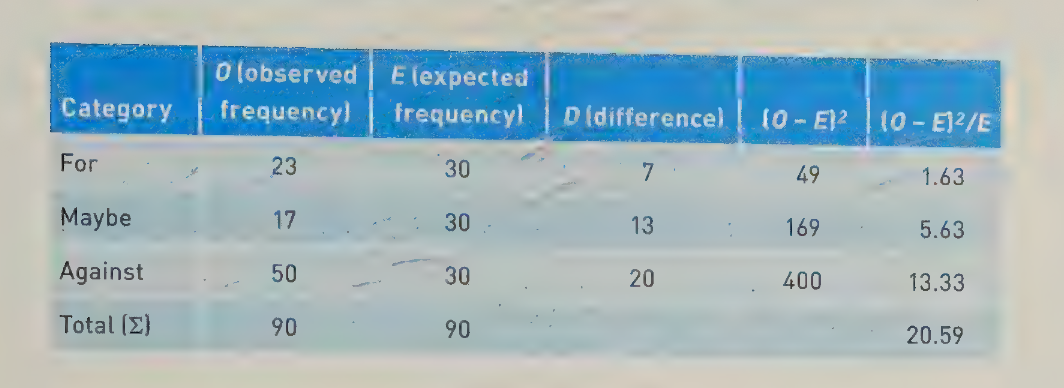
Here are the steps we took to prepare the above information.
Enter the categories (Category) of For, Maybe, and Against. Remember that these three categories are mutually exclusive. Any data point can be in only one category at a time.
Enter the observed frequency (O), which reflects the data that were collected.
Enter the expected frequency (E), which is the total of the observed
frequencies (90) divided by the number of categories (3), or 90/3 = 30.For each cell, subtract the expected frequency from the observed frequency (D), or vice versa. It does not matter which is subtracted from the other because these differences are squared in the next step.
Square the difference between the observed and expected value. You can see these values in the column named (O - E)².
Divide the squared difference between the observed and the expected frequencies by the expected frequency. You can see these values in the column marked (O - E)²/E.
Sum up this last column, and you have the total chi-square value of 20.59.
What are the hypotheses in Goodness of Fit Chi-Square tests?
Null hypothesis : H0: Observed = Expected (O = E)
The observed frequencies match the expected frequencies
Two common scenarios:
Equal proportion scenario: When no prior knowledge exists about the population, we test if categories occur with equal frequency (no preference)
Known population scenario: When population proportions are known, we test if sample frequencies match the expected population distribution (no difference)
Alternative hypothesis: H1: O ≠ E
The observed frequencies differed from the expected frequencies for at least one category
Indicates that the data does not fit the hypothesized distribution.
Eight Steps to test the goodness-of-fit chi-square test statistic
State the null and research hypothese.
Set the level of risk (or the level of significance) associated with the null hypothesis.
Select the appropriate test statistic (Any test between frequencies or proportions of mutually exclusive categories (such as For, Maybe, and Against) requires the use of chi-square.)
Compute the test statistic value (called the obtained value).
Determine the value needed for rejection of the null hypothesis using the appropriate table of critical values for the particular statistic. (first you determine the degrees of freedom (df) which df = r - 1, r equals rows.
Compare the obtained value with the critical value.
Decision time! Now comes our decision. If the obtained value is more extreme than the critical value, the null hypothesis can be rejected. If the obtained value does not exceed the critical value, the null hypothesis is the most attractive explanation and we fail to reject it.
In this case, the obtained value exceeds the critical value—it is extreme enough for us to say that the distribution of respondents across the three groups is not equal. Indeed, there is a difference in the frequency of people voting for, maybe, or against school vouchers.
results of Goodness of Fit APA writing
A chi-square goodness of fit test was performed to determine whether the proportion of student's grades in our sample was similar to the proportion of student's grades from 5 years ago. We fail to reject our null hypothesis (χ²(4) = 8.71, p > .05). The grade distribution from this year's students is similar to the grade distribution from 5 years ago.
Test for Independence
examines the relationship between two different categorical variables
What is the difference when computing the test of independence chi-square test statistic compared to the Goodness of Fit?
We follow the same steps, and use the same formula.
But note that while the formula is the same, the expected values are computed differently. In particular, the expected value for any cell is the product of the row total multiplied by the column total divided by the total sum of all observations.
Expected = (∑ Row * ∑ Column) / ∑ ALL
Examples (Goodness of Fit)
1. Student Major Selection: Categorical variable: Academic major (Business, Engineering, Arts, Sciences, Education)
RQ: Do students choose majors in the proportions the university predicted?
2. Ice Cream Flavor Preference: Categorical variable: Favorite flavor (Chocolate, Vanilla, Strawberry, Mint)
RQ: Does the observed preference match the expected distribution from previous market research?
3. Transportation Method: Categorical variable: Mode of transport (Car, Bus, Train, Bike, Walk)
RQ: Does the observed transportation usage match city planning expectations?
Examples (Test of Independence)
1. Gender and Movie Genre Preference:
Categorical variable 1: Gender (Male, Female)
Categorical variable 2: Favorite movie genre (Action, Comedy, Drama, Horror)
RQ: Is movie genre preference independent of gender?
2. Region and Food Preference:
Categorical variable 1: Geographic region (North, South, East, West)
Categorical variable 2: Preferred cuisine (Italian, Mexican, Asian, American)
RQ: Is food preference associated with geographic region?
example of Hypotheses in Chi Square Goodness of Fit Test
To test the theory of climate change, a meteorologist in Northern Virginia is interested in determining whether the weather patterns observed in July-August 2023 align with long-term trends for the summer season in the area.
What is the Null Hypothesis?
The observed frequency distribution of temperature categories in July-August 2023 matches the expected frequency distribution based on historical percentages.
Alternative Hypothesis?
The observed frequency distribution of temperature categories in July-August 2023 differs from the expected frequency distribution based on historical percentages for at least one category.