RM Test 3
1/85
There's no tags or description
Looks like no tags are added yet.
Name | Mastery | Learn | Test | Matching | Spaced | Call with Kai |
|---|
No analytics yet
Send a link to your students to track their progress
86 Terms
Bivariate Correlations
associations that involve exactly 2 variables
almost always considered a quantitative method because it measures the strength and direction of a relationship between two numerical variables.
Example of Bivariate Correlation
Level of happiness and days spent on vacation
you are measuring the relationship between exactly two variables.
both are quantitative
How do you show the association between two quantitative variables?
You use a scatterplot to visualize the association
Directions
positive: they both increase
negative: one increases, one decreases
zero: no pattern
Strength
tight cluster: strong
scattered: weak
Effect size
describes the strength of an association
all else being equal, larger effect sizes are more important, since they give more accurate predictions
Exception: when a tiny effect size is aggregated (combined) over many people or situations, it can have an importnat impact
Cohen’s Guidelines
r has 2 qualities: direction and strength
Direction is the association (+, -. 0)
direction doesn’t matter for for determining how strong a relationship is (can be STRONG negative)
Strength: how closely related the 2 variables are
the more closely related the two variables are, the closer r will be to 1.0 or -1.0
Cohens Guidelines (based on r)
0.10 or -0.10: small, or weak
0.30 or -0.30: medium, or moderate
0.50 or -0.50: large, or strong
Scatterplots are useful in examining ___
interrater reliablilty
interrater reliability ensures that the data remains consistent among more than one observer/rater in a survey. if you get the same data multiple times, then you know your data is reliable among observers
Example of when one variiable is categorical
Marital satisfaction and meeting a partner online or offline
Categorical: Online or offline
value falls into either one category or the other
Quantitative: marital satisfaction
has a numerical value
t-test vs. correlation
t-test: a statistic to test the difference between two group averages
asks: Are the means of these two groups significantly different
correlation: asks: is there a relationship between these two variables
if one variable is categorical, you can code it numerically
why is bivariate correlational research not an experimental design
becuase studies like this do not involve a manipulated variable
quasi-experimental design
similar to experimental design in that you are comparing groups
but random assignment is not involved
looking at groups that already exist in the real-world (narturally occurring groups)
outliers
Outlier: a data point that significantly deviates from other observations within a dataset
can have a significant impact on the results
can make the correlation seem stronger or weaker than it really is
should always check for them and remove them
In bivariate correlation, outliers are mainly problematic when they involve extreme scores on both variables
Small samples can be affected by outliers
restriction of range
Restriction of range: issue that occurs when the values collected do not represent the entire possible range for a variable
If there is not a full range of scores on one of the variables in the association, it can make the correlation appear smaller than it really is
Example: Looking at the correlation between SAT scores and GPA among students in a competitive college
For this group of students, they needed to get a certain score to get into the competitive school, so they wouldn't have people who scored low. So, looking at the correlation in those students, there would be an issue of restriction of range because it doesn't go from 800-1600, it’ll be 1400-1600
not the FULL range
What does the Pearson r Correlation Coefficient measure?
The strength of a LINEAR association between two variables
Curvilinear association
Curvilinear: When the relationship between two variables is not well represented by a straight line, it might be positive up to a point and then become negative
When it’s curvy, then it might underestimate the relationship or show that there is no relationship
Example: Age and use of healthcare
Use of healthcare is negative correlation till middle age, then flips to a positive correlation from middle age to old age
Using Person r, you won’t see a relationship since it's curvilinear
Internal Validity
Can we make a causal reference from association?
Three causal criteria
Covariance: must be an association between the cause variable and the effect variable
Temporal Precedence: the causal variable must come before the effect variable
Internal validity: is there a third variable that is associated with variables A and B independently
Applying the three causal criteria to BVC
Covariance
With BVC, you cannot confidently say one LEADS to the other
Temporal Precedence
With BVC, you dont know which came first
Internal Validity
With BVC, you cannot infer causality becuase there could be other variables explaining the link
Identify a possible third variable: The number of fire hydrants and the number of dogs in a city are positively correlated
Third variable: greater population = more dogs and more hydrants
External Validity: Looked at the generalizability of the link between multitasking performance and time spent multitasking
Age did not MODERATE (change) the relationship between multitasking amount and multitasking performance
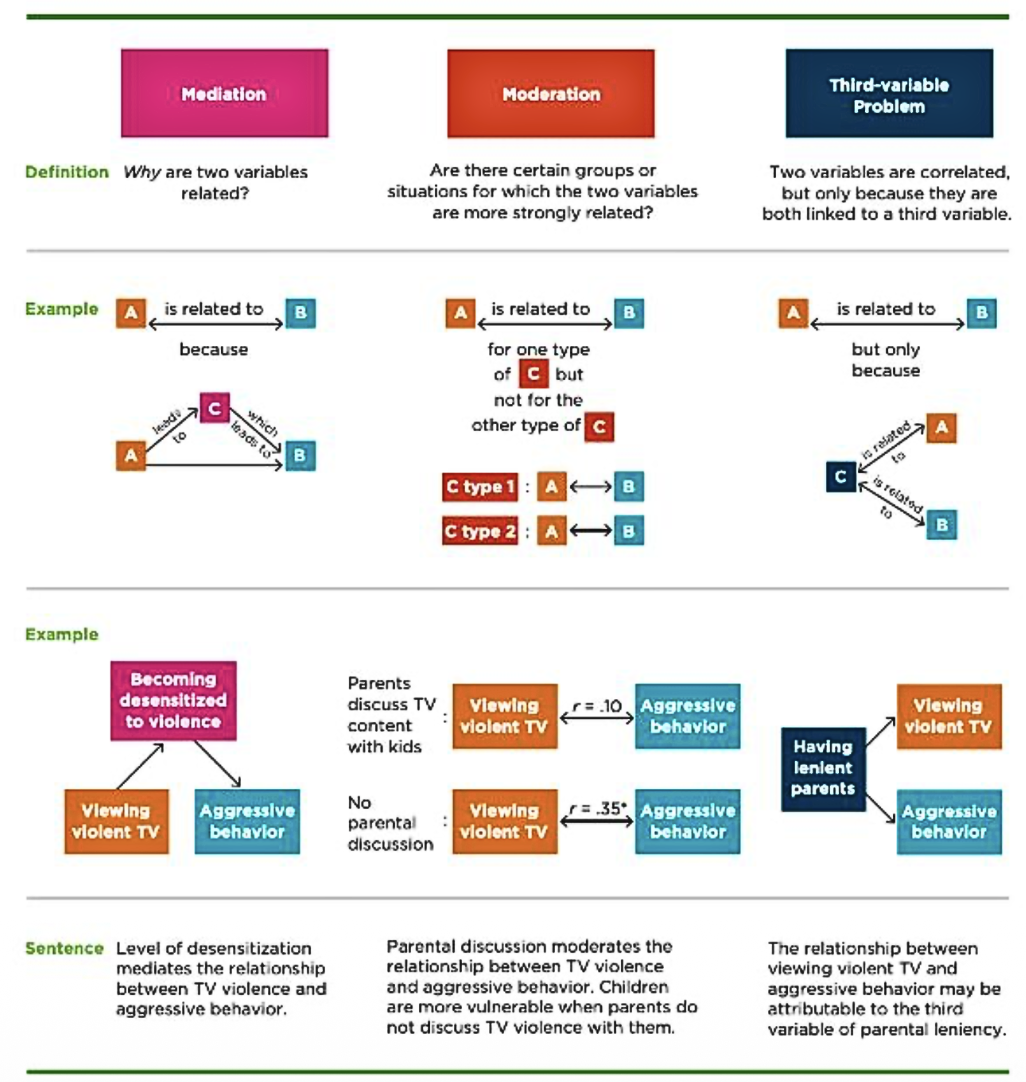
Moderator
When the relationship between two variables changes depending on the level of another variable
The other variable is called the MODERATOR
The moderator changes the relationship between variables
Identify the moderator: “Recent research shows that growing up in stressful economic conditions can disrupt brain development, alter behavior, and challenge emotions. But for boys, the outcome is worse.”
Moderator: gender
Multivariate designs
involve more than two measured variables
such as longitudinal and multiple regression designs
Longitudinal design
studying the same group of people over a long period of time, several times
same group, several points of time
Example: studying a group of 100 people for 10 years to measure how daily exercise affects their cardiovascular health
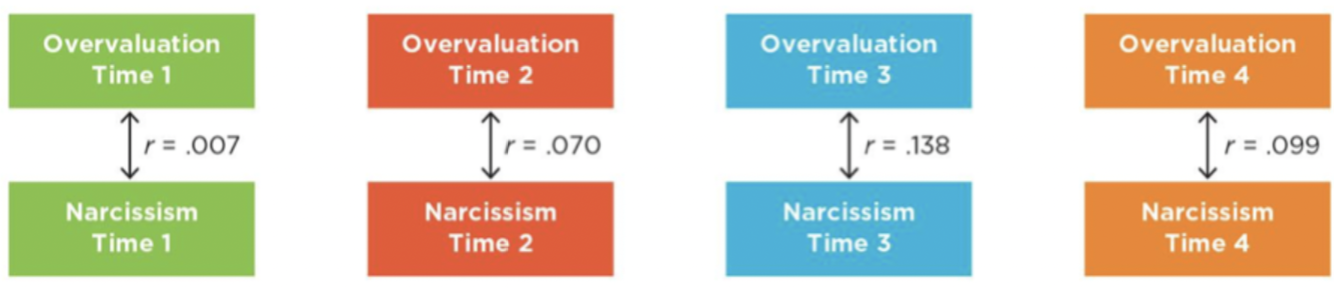
cross-sectional correlations
The correlation between two variables at the same point in time
can’t establish temporal precedence, but can help establish covariance
Example: measuring the relationship between obesity (variable 1) and diabetes prevalence (variable 2) in a group of adults at a single point in time, likely finding that higher BMI correlates with higher diabetes rates
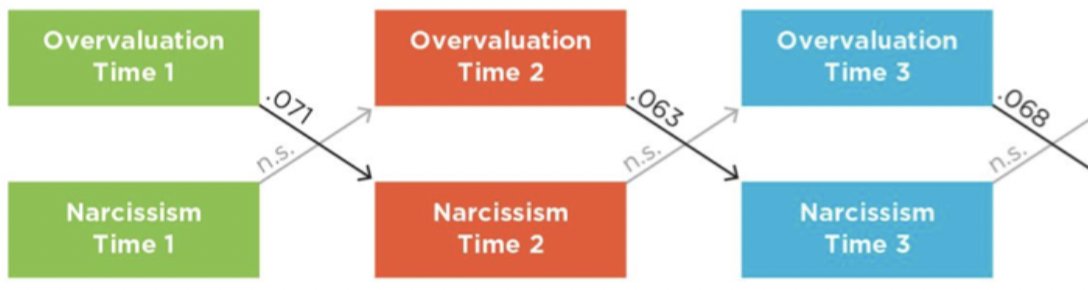
Cross-lag correlation
Establish whether an earlier measure of one variable is associated with a later measure of the other variable
looks at whether one variable predicts another variable later in time
This helps address the directionality problem and get us closer to establishing temporal precedence
Example: measuring TV violence habits and aggressive behavior in children at age 8 (Time 1) and again at age 18 (Time 2) to see if early TV habits predict later aggression, or vice versa
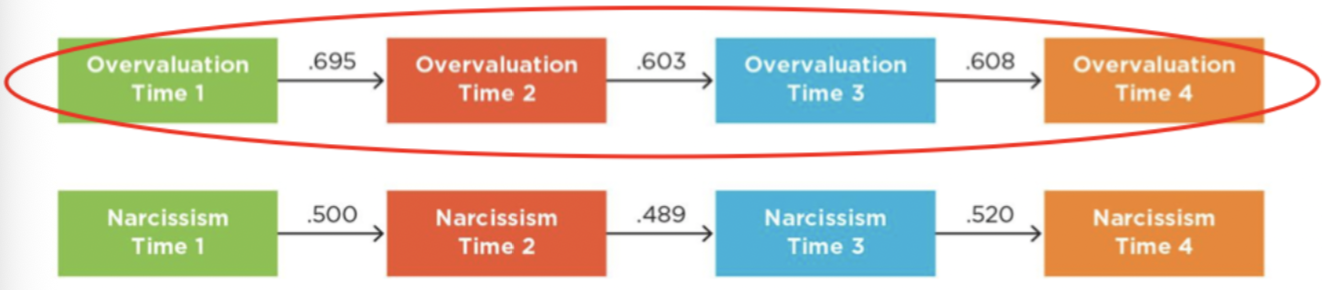
Autocorrelations
correlations of each variable with itself across time
cannot establish temporal precedence
can see how stable the variable is, but does not determine causation
Example: the weather
how can longitudinal designs provide evidence for covariance?
when the cross-sectional correlations are significant, covariance is established
we know the two variables are related
how can longitudinal designs provide evidence for temporal precedence?
if one of the cross-lag correlations is significant, but the other is not, this helps us move closer to temporal precedence becuase we get an idea of which came first
what is the best way to establish temporal precedence
The best way is to use a true experiment to definitively establish temporal precedence
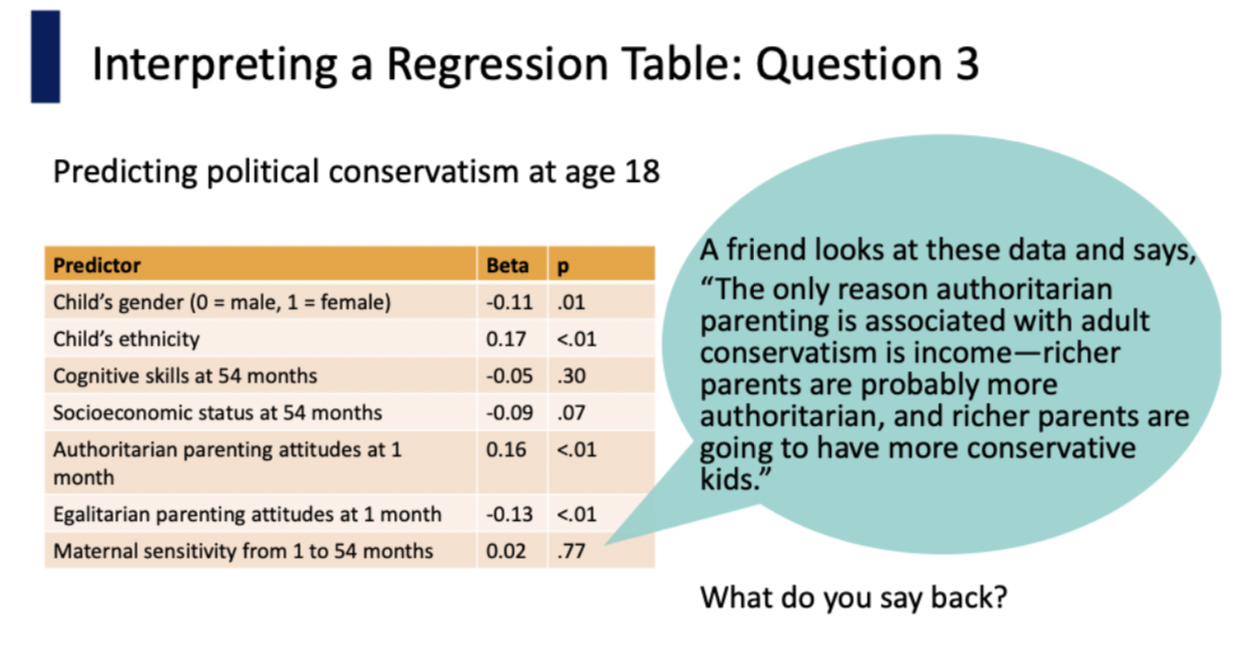
Multiple (multivariate) regressions
A statistical method that examines the relationship between one dependent variable and multiple independent variables, allowing researchers to assess the unique contribution of each predictor while controlling for others
help address questions of internal validity by ruling out third variables
Both confounding variables and moderating variables are third variables
confounding variable
Variable C: another explanation for the correlation of A and B
threatens internal validity
Example: ice cream sales (independent variable) and drowning incidents (dependent variable). As sales rise, so do drownings, but the true cause of both is the third, unmeasured variable: hot weather (confounding variable)
Moderating variables
intentionally included to see if it impacts the correlation of the IV and DV
Example: exercise (IV) leads to better health (DV), but age (Moderator) changes this: the effect is stronger in younger people
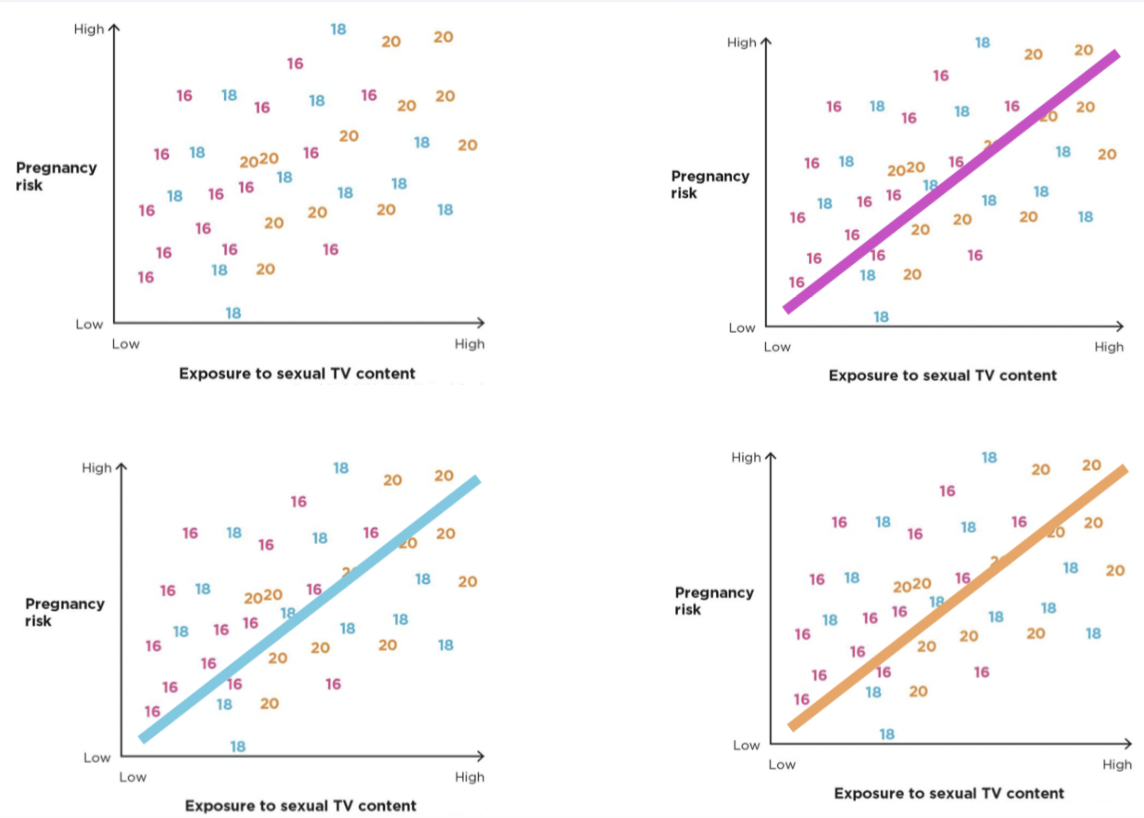
Using statistics to “control for”
to account for other variables’ effects, to isolate the unique impact of the main variable of interest on the outcome
such as age, gender, etc
Example: Looking at the effect of exposure to sexual TV content (IV) on pregnancy risk (DV), but separating the data by age (control)
criterion variables
the variables you are studying (dependent variable)
predictor variable
the variable you are using to predict this criterion variable
Example: Academic Success
Predictor variable = High school GPA/SAT scores
Criterion variable = College GPA.
What is Beta (testing for third variables)
represents the standardized coefficient in a regression analysis
Indicates the direction and strength of the relationship
One Beta variable for each predictor variable
similar to r
Interpreting B (pos/neg)
+B indicates a positive relationship between the predictor variable and the criterion variable (when the other predictor variables are statistically controlled for)
- B indicates a negative relationship between two variables (when the other predictors are controlled for)
Interpreting B (high/low)
Beta 0 or nearly 0 = represents no relationship
The higher the B, the stronger the relationship between that predictor variable and that criterion variable
Example: B = 0.25 signifies a positive correlation
What does it mean if the Beta is not significant?
The third variable is explaining the relationship
Example:
Predictor variable → family meal frequency
Criterion variable → academic success
Describing the Nonsignificant Beta
The relationship between family meal frequency and child academic success is not significant when controlling for parental involvement
The relationship between family meal frequency and child academic success can be explained by the third variable of parental involvement
The relationship between meal frequency and child academic success goes away when parental involvement is held constant
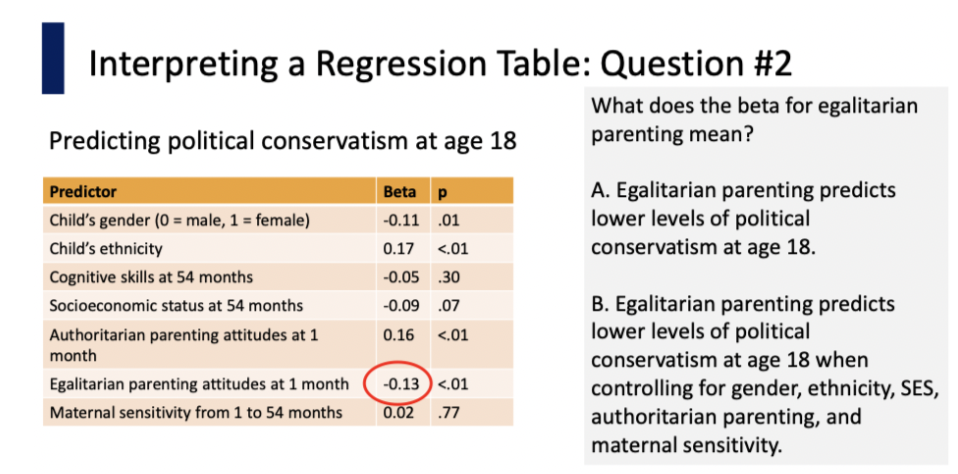
Answer: B
Make sure that you mention all the other variables being controlled for
they are wrong because the regression table already controls for socioeconomic status
Pattern and Parsimony
We can get closer to making causal claims if multiple researchers show similar patterns of results over time
simplest explanation that accounts for the data
Example: multiple studies show the correlation between smoking and cancer, if the results are the same across studies and there are simple explanations (parsimony), causality can be inferred
Rely on this in order to avoid unethical experiments (can’t make participants smoke if its known that smoking = cancer)
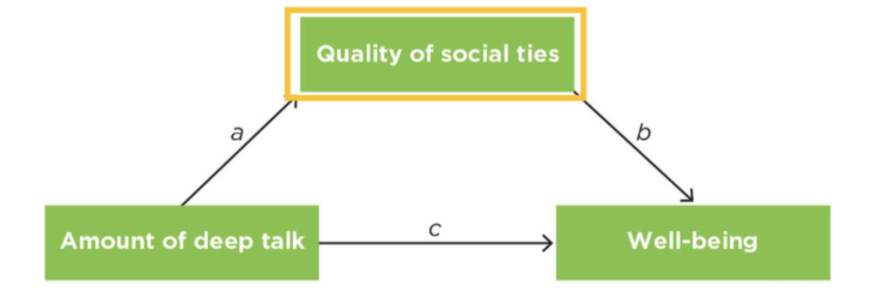
Mediation
Mediator: variables that explain the process or mechanism through which an independent/predictor variable influences a dependent/criterion variable
when there is a relationship between two variables, we often want to know why the relationship exists
They help us understand the mechanisms by which the relationship exists
Mediators ask “why,” moderators ask “for whom” or “when”
Example: You experience a failure in one aspect, which threatens self-integrity (failing an exam), so you must restore self-integrity through a different, unrelated variable (reminding yourself you are a talented artist), which in turn improves morale and performance on the next exam
Mediators vs. Third variables (similarities)
Both involve multivariate research designs
Both can be detected using multiple regressions
Mediators vs. Third variables (differences)
Third variables are external to the bivariate correlation (problematic)
Mediators are internal to the causal variable (not problematic)
Mediators vs. Moderators
Mediators ask “why or “how”
Moderators ask “for whom” or “when”— help understand if link between A and B are true for every context
Mediation vs. Moderation vs. Third-variable
Quasi-Experiment
a study similar to an experiment except the researchers do not have full experimental control
without random assignment (unethical, impractical, impossible)
need to be cautious when making causal claims
benefits: real-world settings; field settings
Four types of Quasi-Experimental Research Designs
Nonequivalent control group posttest-only design
Nonequivalent control group pretest/posttest design
Interrupted time-series design
Nonequivalent control group interrupted time-series design
Nonequivalent control group posttest-only design
Design where outcomes are compared between a treatment group and a non-randomly assigned control group, with measurements taken only after the intervention
One treatment group and one control group
Participants are measured only once
Not random assignment- using groups that already exist
Example: a teacher uses a new teaching method (Treatment group) on one class, while another class (Control group) uses the old method, and both take the same final exam.
Nonequivalent control group pretest/posttest design
Design where outcomes are measured both before and after an intervention in the treatment group and a non-randomly assigned control group
like Posttest design, except participants are measured twice
Example: a teacher uses a new teaching method (Treatment group) with one class, while another class (Control group) uses the old method. Both take the same exam before the school year and a final exam at the end of the year.
Interrupted time-series design
Design where multiple measurments are taken before and after an intervention to assess its impact over time
participants measured multiple times before, during, and after
no control group
measures throughout the study- changes after interuptions
Example: The impact of 13 Reasons Why on suicide in teenagers. Look at suicide rates in teenagers throughout the study. Look at multiple numbers before, during, and after the show. No comparison group
Nonequivalent control group interrupted time-series design
Outcomes are repeatedly measured over time in both a treatment group and a non-randomly assigned control group before and after the intervention
same as interrupted time series, except examining two groups that already exist and comparing them
Example: Classroom Attendance: A professor implements a new policy where daily attendance counts toward the final grade in one class section (treatment group). They track absences daily across the entire semester. They compare this trend to another class section (the nonequivalent control) that uses the same curriculum but has no attendance grade.
Internal Validity in Quasi Experiments
Selection effects
preexisting differences in participants prior to experiment
Design confounds
Flaw that can affect outcome
Maturation threat
participant changes over time
History threat
external event
Regression to the mean
extreme scores regress to mean when retested
Attrition threat
critical participants drop out
Testing and instrumentation threat
changes in testing measures
Observer bias, demand characteristics, placebo
OB: observer expecting to see something
DC: participant acts a certain way
PE: participant feels difference w/ no treatment
Small N Designs
studying only a few individuals
unique cases
individual data points
using repeated measures
often in a therapeutic setting
Example:
Henry Molaison (H.M.) suffered from repeated, debilitating epileptic seizures
A surgeon excised the front half of his hippocampus on both the right and left sides
After the surgery, he couldn’t form new memories
Because of this study, they then understood the role of the hippocampus
Balancing priorities in case study research
Experimental control, manipulation, and replication
with all 3 you can make a confident conclusion
hard to achieve all 3
Disadvantages of Small-N studies
External validity: such a small sample; studying one person might not be generalizable (need replication)
Internal Validity: No random assignment
H.M also had damage to cerebellum, so that could have led to memory loss
Three Small-N Designs
Stable baseline design
Multiple baseline design
Reversal design
Stable Baseline Design
a single-case study in which a practitioner or researcher observes behavior for an extended baseline period before beginning a treatment or other intervention
stable baseline before treatment to rule out other possibilities
Example: measuring a student's reading accuracy for five days until it is consistent (establishing a baseline), then introducing a new tutoring method (intervention).
Multiple-Baseline Design
Single-case design where researchers stagger their introduction of an intervention across a variety of individuals, times, or situations to rule out alternative explanations
allows you to see if the treatment is causing the change in DV
Example:
A teacher wants to reduce three students' "dropping items" behavior. The teacher measures how often Student A, Student B, and Student C drop items simultaneously for one week. All show high rates.
Intervention (Staggered):
Day 5: The teacher starts a reward system for Student A only. Student A's behavior improves; B & C remain high.
Day 10: Teacher starts the same reward system for Student B. Student B's behavior improves; C remains high.
Day 15: Teacher starts the reward system for Student C. Student C's behavior improves.
Result: Since each student only improved after the intervention started, it proves the reward system worked
Reversal Design
a single-case design where the researcher observes a problem behavior both with and without treatment, but takes the treatment away for a while (the reversal period) to see whether the problem behavior returns (reverses). They subsequently reintroduce the treatment to see if the behavior improves again.
stop treatment to see if behavior reverts
only works if the treatment doesnt have a lasting impact
Example: Improving Classroom Focus
A (Baseline): The teacher records that a student completes only 2 math problems during a 30-minute session.
B (Intervention): The teacher gives the student a 5-minute break for every 5 problems completed. The student completes 15 problems.
A (Reversal/Withdrawal): The teacher stops the break incentive. The student's completed problems drop back to 2–3.
B (Re-introduction): The break incentive is re-introduced, and completed problems rise to 15 again, confirming the incentive caused the improvement
Small-N and Internal Validity
Can be very high if the study is carefully designed
Small-N and External Validity
Can be problematic depending on the goals of the study
Small-N and Construct Validity
Can also be very high if definitions and observations are precise
Small-N and Statistical Validity
Not always relevant to small-N studies
Replicable
result has been reproduced
this is why the methods section of a paper is important
research is reliable when it can be replicated by procedures and by different researchers
Direct Replication
The process of repeating a study with different data under simillar conditions, or of conducting several different studies with the same data
repeat OG study as closely as possible to determine if the same results can be obtained
useful for establishing that the findings of the OG study are reliable
Conceptual Replication
A type of replication in which researchers test the same hypothesis as an original study but with different methods, materials, or procedures
the conceptual variables in the study are the same, but the procedures for operationalizing the variable are different
Replication Plus-Extension
A type of replication in which researchers not only replicate the original study’s methods to confirm the findings, but also add new elements to test additional questions or explore new variables
add variables or conditions to OG study
Why might replication studies fail?
selectivity publications (file drawer problem)
Problem with OG study
Contextually sensitive effects
Number of replication attemps
Why might replication studies fail? Selective Publication
Statistically significant findings (p ≤ α) are published and nonsignificant findings (p > α) are not published
Why might replication studies fail? Problem with OG study / questionable research practices
using a small sample size
There’s a chance that values can influence the data set, so the study’s estimate is imprecise and less replicable
HARKing (hypothesizing after results are known)
Predictions made before data are collected are more convincing than those made after the fact, so HARKing misleads readers about the strength of the evidence
make data seem more correct, or better aligned with the results
P-hacking, AKA data fishing or significance chasing
The misuse of data analysis to find patterns in data that can be presented as statistically significant, but are not truly such
might remove different outliers from the data, compute scores several different ways, or run a few different types of statistics
The goal is to find a p-value of just under 0.05
It is misleading when others are not told about all the different ways the data were analyzed and only the strongest version is reported
Why might replication studies fail? Contextually sensitive effects
The original findings were dependent on specific, unmeasured "contextual factors" (time, location, population, or culture) that differed during the replication attempt
especially prevelant in behavioral studies
Example: A study in the US designed to increase interest in STEM among undergraduate women
the results of this study may differ if the methodology was replicated in a different cultural context
Why might replication studies fail? Number of replication attempts
Repeating experiments multiple times will likely lead to greater success in replicating results
Improvements to Scientific Practice
larger sample size
produces estimates that are precise and replicable
Report all analyses and variables
open data, in which full data sets are provided
Open science collaboration
open materials, in which all study materials are reported publicly
practice of sharing one’s data and materials freely so others can collaborate, use, and verify the results
preregistration
specifying your research plan in advance of your study and submitting it to a registry
publish hypothesis, study design, or statistical analyses before data collection and analysis begin
Meta-analysis
A quantitative technique for synthesizing the results of multiple studies of a phenomenon into a single result by comboning the effect size estimates from each study into a singualr estimate of the combined effect size or into a distribution of effect size
a quantitative technique that combines the results of multiple studies on a particular topic to calculate an overall effect size
Way of mathematically averaging the results of all the studies (both published and unpublished) that have tested the same variables to see what conclusion that whole body of evidence supports
Strengths and limitations of Meta-analysis
file drawer problem: tendency for only studies with significant results to be published
The idea that a meta-analysis might be overestimating the true size of an effect because negligible effects, or even opposite effects, have not been included in the collection process
Null results and opposite results are rarely published
When is it important for external validity to be high
If your research is applicable to other experiments, settings, people, and times
Ecological Validity
an aspect of external validity in which the focus is on whether a laboratory study generalizes to real-world settings
a study’s similarity to real-world settings
Theory Testing Mode
A research approach focused on testing a theory’s general principles, often under controlled and rigorous conditions— test if a theory works
External validity matters less than internal validity— the goal is to test the theory, not represent the whole population
It is more important to establish a relationship between two variables in this case than it is to see if that relationship is generalizable
Generalization mode
A research approach focused on determining how widely findings apply across different populations, settings, and contexts— apply broadly
Frequency claims (which mode)
always in generalization mode
describing a population
Association and Causal Claims
Can be Theory-Testing Mode OR Generalization Mode
Cultural psychology
A subdiscipline of psychology focusing on how cultural contexts shape the way a person thinks, feels, and behaves
They point out that most people are not WEIRD
Western, educated, industrialized, rich, and democratic