research design and analysis
1/103
There's no tags or description
Looks like no tags are added yet.
Name | Mastery | Learn | Test | Matching | Spaced | Call with Kai |
|---|
No analytics yet
Send a link to your students to track their progress
104 Terms
inductive method
aim to generate new theories/ ideas
deductive method
aim to test theories and establish whether they are valid or not
theory
a statement of cause and effect/ a statement about the relationship between two or more variables
categorical variables
varies by type or kind, like gender, religion, uni course - nominal measurement
continuous variable
varies by degree or amount eg reaction time, height, age etc - interval/ratio measure
extraneuous variables
variable/s that compete with the IV in explaining the outcome or DV. ( nuisance variable)
confounding variable
a variable that is systematically related to both IV and DV in study, in such a way that any change in DV cannot be directly attributed to IV/ confound exclusively. reduces internal validity
causation
condition in which one event ( cause) generates another event (effect)
criteria for identifying causal relationship
cause (iv) must be related to effect (dv) [ relationship condition]
changes in iv must precede changes in dv [temporal order condition]
no other plausible explanation must exist for the effect
inferring causality
well designed and appropriately controlled and conducted experiment can allow inferences about causality
perform action (manip iv)
measure consequences (changes in dv)
control for other possible explanations ( eg extraneous factors)
experiment should be
carefully designed
rigorously controlled
replicable
ethical
disadvantages of experimental appraoch
does not test effect of non-manipulated variables ( many potential ivs cannot be directly manipulated like age, gender etc)
artificiality/generalisability: refers to potential problems in generalising findings from lab settings to real world
population
totality to which/whom you wish to generalise your study findings
sample
participants in study
sampling procedures
non-probability: convenience, purposive, snowball
probability: simple random, systematic random, stratified, multi-stage cluster
probability sampling
way to ensure sample is representative of population ( on characteristics deemed important for the study )
basic principle of proability sampling
sample will be representative of problem if all members of population have an equal chance of being selected in the sample
allows researcher to calculate the relationship bw sample adn population
simple random sample
each member has an equal and independent change of being selected
define population, list all members, assign numbers
may not have under rep group in research
systematic random sample:
every kth person
randomly selected the first person, then divide the population by the size of the desired sample and use this to determine the interval (?) at which sample is selected
eg to selected sample of 1000 ppl from list of 10,000, randomly selected the first person then selected every 10th person from the list
stratified sampling
tries to solve issue of simple sample. better for generalising broader population, sample of each clusters
f you want to make sure the profile of the sample matches the profile of the population on some important characteristics e.g., age, location, ethnicity
Researcher divides population into subpopulation (strata) and randomly samples from the strata
NB: can have proportional representation or disproportionate representation (but disproportionate sample would not be used to generalise to entire population, only the subgroups)
Why use stratified sampling?
Can reduce sampling error by ensuring ratios reflect actual population (e.g., ratio of different ethnic groups)
To ensure that small subpopulations are included in the sample
multi-stage cluster sampling
begin with sample of groupings then sample individuals
eg
List of towns- randomly sample that list
Within towns, randomly sample ppl
Wont get every town, want to reduce both kinds of bias (towns and ppl)
Random sample within them will reduce bias within them
Just need random clusters to sample from
multiphase sampling
larger sample obtained first in order to identify members of sub-sample
sub sample then randomly chosen for study
good but costly way to identify not readily identifiable subgroups
non-probability sampling
not every member of population has equal chance of being part of sample.
always risk of bias, wont always know if sample is exactly like sample trying to generalise
may use bc : There are no lists for some populations under study, e.g.,
The homeless
Certain occupations (e.g., farmers)
Hidden or specific populations (e.g., farmers with mental health issues)
Convenience/resource restrictions)
convenience samples
sample of avaliable participants
easy, inexpensive
no control over representativeness, bias
snowball sampling
used mainly for hard to study population
involves collecting data with members of population that can be located. then ask those members to provide info/contracts for other members of the population
quota sample
non-probability sampling equivalent of stratified random sample. want to reflect relative proportions of population. arent/ dont sample randomly frmo each straa as you do in stratified random samples
some ppl in groups you want to equate on demo variable
purposive/judgement sampling
clear purpose to sampling: select key informants, atypical cases, deviant cases or diversity of cases.
selected sample based on knowledge of population, its elements and purpose of study
often used to select cases:
especially informative
difficult to reach population
in depth investigation
sampling methods used should:
be fully explained and caveats about likely generalisabiltiy of results made accordingly so reader can review results in informed way
determining sample
largerly determined by analysis plan to conduct with data
generally more complex analysis, the larger sample required
statistically predict sample size ( power analysis)
larger sample sizes needed when:
sample if heterogeneous ( composed of widely different kinds of ppl)
want to breakdown sample into multiple subcategories ( look at genders separately)
want to obtain narrow/more precise confidence interval
expect small effect/weak relationship
for some statistical techniques
five rules for determining sample sizes
if less than 100, use entire population
larger sample sizes make it easier to detect and effect or relationship in the population
compare to other research studies in area by doing lit review
use power table for rough estimate
use sample size calculator ( eg g power)
operationalisation
description of operations that will be undertaken in measuring a concept
specific procedures by which researcher measures and/or manipulates variable
turning abstract concepts into concrete variables that we can measure/manipulate
more careful and complete operational definition, more precise measurement of variable
levels of measurement
nominal
ordinal
interval
ratio
interval
a true number in the sense that there are equal intervals implied, but no true zero point
eg temp in degrees
ordinal
a rank order. ordinal variables do indicate an underlying quantity. do not obey mathematical laws ( cannot meaningfully subtract, divide etc)
nominal
somehting which is purely categorical information (about teh quality or kind of thing)
a discrete quality that something has
ratio
a true number. distinguishing feature of ratio scale is that it has a meaningful zero point, that participants could use to indicate the quantity is completely absent
validity ty[es
consider overall validity of design/piece of research ( internal/ external validity)
validity of variables within study
types of validity
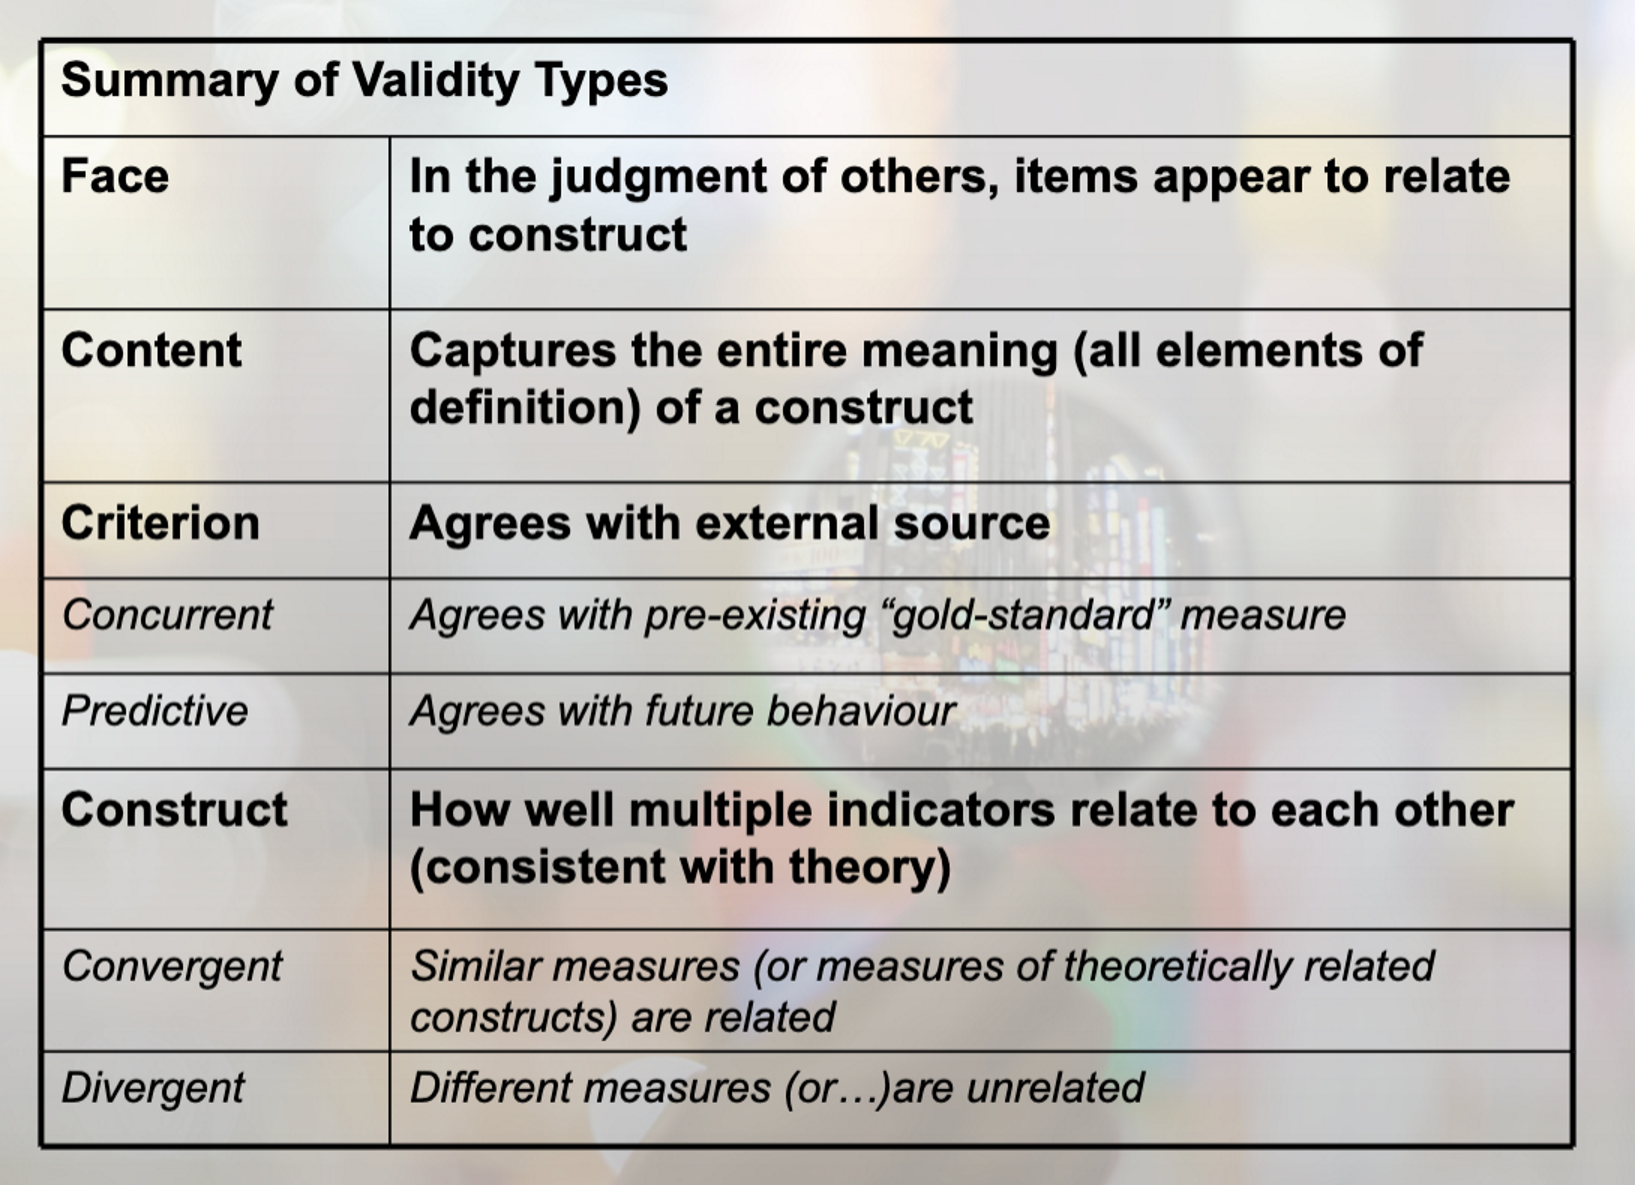
face validity
content validity
concurrent
criterion-related
predictive
construct
face validity
Asks the question:
• On the face of it, does my measure seem to relate to the construct?
• e.g., On the face of it, which of the following is a more valid measure of worker morale:
• No of grievances filed with the union or
• No of books borrowed by workers during off-duty hours
• Measures that lack face validity have the potential to alienate research participants
(what are they really trying to measure?)
• A weak, subjective method for assessing validity, but a first step
content validty
extent to which teh measure represents a balanced, adequate sampling of relevant dimensions. consider what should go into meausre and what should stay out
how much does the measure cover the content of the definition
criterion related validity
involves checking the performace of measure against some external criteiorn
two types: concurrent, predictive
concurrent validity
establish teh validity of measure by comparing it to a gold std ( eg existing validated measure of same construct)
predictive validty
does measure predict something that its theoretically supposed to predict?
does measure differentiate bw ppl in way taht you would expect
what should a measure of following constructs predict?
construct validity
demonstrating that hte measure relates to the theoretical construct of interest. two types: convergent, divergent
convergent validity
demonstrating that the measure relates to measure of similar and related constructs
divergent validity
demonstrating the measure does not relate to unrelated construct
summary of validity types
reliability
the consistency or repeatability of measurement
types of reliability
stability of the measure
internal consistency of measure
agreement/consistency across raters
stability of the measure/ test retest
address stability of measure
administer the measure at one point in time (time 1)
give same measure to participant at later point in time ( time 2)
correlate scores on the two measure
problems with test retest
memory effect
practice effect
Other considerations: how long between intervals?
If too short, there's a greater risk of memory effects
If too long there's a risk of other variables ( e.g., additional learning) influencing results
split-half reliability ( internal consistency)
Administer a battery of questions
Split the measure into two halves
Correlate the scores on the two halves of the measure
Higher correlation means greater reliability
Strength: eliminates memory and practice effects
Limitation: are the two halves equivalent?
inter-item reliability
Assesses the internal consistency of your measure
i.e., tells you how well the items or questions in your measure appear to reflect the same underlying construct
You will get good internal consistency if individuals respond in approx the same way to questions on your survey
Cronbach's alpha can range from 0 ( when the items are not correlated with one another) to 1.000 (when all items are perfectly correlated to each other). The closer the alpha is to 1.00, the better the reliability of the measure
inter-rater/inter-observer reliability
Checking the match between two or more raters or judges, e.g., research investigating the relationship between communication and family functioning
Coding videos for hostile– need to check the agreement amongst the coders
Calculation of inter-rater reliability
Nominal/ordinal scale
The percentage of times different raters agree
Interval or ratio scale
Correlation coefficient
Other stats methods- beyond 210 scope
interpreting reliability coeffiecints
What kind of reliabilities co-efficient should I be aiming for?
Test- retest coefficients > .70
Internal consistency > .70 ( but ideally much higher)
Rating consistency > .90
These are relatively arbitrary but serve as a benchmark
reliability and measurement error
measurement error weakens our statistical tests
all other things being equal, more error in measurement means lower reliability
choosing a measure which is highly reliable decreases measurement error and increases the power of the design
relationship bw reliabiltiy and validity
measure can be reliable but not valid
can be consistent measure that does not actually measure the construct
measure can be valid but not reliable
Example of valid tool but is unreliable - something that is hard to implement ( e.g., skin fold tests- require technical skill)- may be unreliable across multiple administrators
summary of reliability types
Summary of Reliability Types

Test-retest

Same Q given on two occasions and data

correlated

Split Half

Split Q in half and correlate data from two

halves

Inter-item reliability

Overall correlation between items in the scale

Inter-rater

Checking for agreement between multiple

raters or judges internal validity
how sound is the design, how strongly can we assert that changes in our DV are down to our IV and not other things we have not controlled for ( extraneous variables
external validity
how generalisable are our findings ( tied in with representativeness of sample), how representative of the real world ( tied in with our artificial our study is)
The more we try control/ensure internal validity, the potentially more artificial the study becomes, and hence less representative of reality, less generalisable… hence less externally vali
four steps to internal validity
sound operationalisation of DV
measures should be reliable and valid
strong design logic
sound operationalisation our iv(S)
consideration and use of appropriate remedies to control for extraneous variables
types of research design
experimental
quasi-experimental: similar to experimental, but less randomisation of key ivs
non-experimental
experimental design
experimental design involves experimental manipulation directly determined by researcher in controlled environment
quadi-experimental
where manipulation not controlled by researcher. E.g., where levels in IV determined by participant characteristic i.e. individual manipulation e.g., demographics, self report measures
manipulation of iv (2 ways)
experimental manipulation
individual difference manipulation
experimental manipulation
experimenter determines which level of the iv the participant is tested at;
event manip
instructional manip
individual difference manipulation
characteristic of participant determines level of the iv at which they are tested
demographics
self report measures
( not strictly experiment, quasi-experimental)
types of experimental research design
repeated measures
between groups
mixed
repeated measures ( within groups, dependent groups)
each participant tested at each of the IV:
Need less subjects
More sensitive design ( easier to detect the effect of interest, as individual differences controlled for)
Cant always use this design
between groups ( independent groups)
each participant tested at only one level of the IV
Less sensitive design
Often forced to use this design
If IV individual difference variable e.g., gender
If participating in one condition precludes participating in another
mixed
more than one IV, with at least one IV manipulated between groups and at least one within groups
cannot use repeated measures design if:
Participation at one level of the IV precludes later participating at another level: For example by causing permanent change in the participant. e.g. Exposure to one therapy may result in permanent improvement
Cant really study developmental change with real confidence
Cross sectional study looking at developmental change, can u infer that with cross section design
It is not physically possible for a participant to participate at all levels. E.g. can’t be both computer anxious and not computer anxious or short and tall.
cannot use between groups design
if which to detect change in individuals across time
eg. learning studies, development studies
factorial design
more than one IV
may have all repeated measures ivs or all bw groups ivs
Mixed: more than one IV with at least one IV manipulated between groups and at least one within groups
Allows examination of interplay between two or more IVs and the splitting up of these effects into interactions and main effects
factorial design strengths
more than one IV allows for more precise hypotheses
Control of extraneous variables by including as an IV
Ability to determine the interactive effect of two or more IVs
main effects of factorial design
The influence of one Ivon the DV
One main effect for each IV in a study
In example we can look at the main effect of age ad main effect of alcohol
Interaction effect: looks at whether the effects of one UV is different at different levels of the other IV
factorail design notation
2x2 design
Number of numerals= number of IVs=2
Each number indicates the number of levels for each IV
IV1= 2 levels
IV2=2 levels
2 x 3 design
2 IVs
IV1= 2 levels
IV2= 3 levels
Are very strong - reign in predictions that you make
weakness of factorail designs
Using more than two IVs may be logistically cumbersome
Examples
2 x 2 design= 4 cells, 2 main effects, and 1 interaction
2 x 3 design= 6 cells, 2 main effects, and 1 interaction
2 x 2 x 3 design= 12 cells, 3 main effects, and 4 interactions
Higher order interactions are difficult to interpret