Bio Stats Midterm
1/17
There's no tags or description
Looks like no tags are added yet.
Name | Mastery | Learn | Test | Matching | Spaced | Call with Kai |
|---|
No analytics yet
Send a link to your students to track their progress
18 Terms
Parameter
Describes the entire population
Value is Constant (fixed)
Source is Census or population data
Notation is Often Greek letters
It is a fixed characteristic of the whole group you are studying.
Statistic
Describes a sample (subset)
Value is Variable (depends on sample)
Source is Survey/sampling data
Notation is often roman letters
Purpose is to estimate the parameter
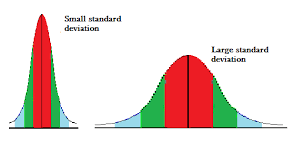
Standard Deviation
a statistical measure quantifying the amount of dispersion or spread of data points relative to their mean (average). A low standard deviation indicates data points are clustered closely around the mean, while a high standard deviation indicates they are spread over a wider range. It is calculated as the square root of the variance
Mean
Average, best for symmetric/normal distributions (e.g., human height) as it uses all data points. It is sensitive to outliers (extremely high or low values).
Median
Middle Value, best for skewed distributions (e.g., salaries, home prices) or when outliers are present, as it is not heavily influenced by extreme values.
IQR Rule
Q1-IQR*1.5 lower boundary and Q2+IQR*1.5 Upper Boundary
Simple random sampling
Every person/item has an equal chance of being chosen.
Example: Randomly picking 50 student names from a school list.
Systematic sampling
Choose every kth person/item after a random starting point.
Example: Pick every 10th student entering the library.
Stratified sampling
Split the population into groups, then randomly sample from each group.
Example: Randomly choose students from each grade level.
Cluster sampling
Split the population into groups, randomly choose whole groups, and survey everyone in them.
Example: Randomly choose 3 classrooms and survey all students in those rooms.
A data set has sample standard deviation s = 0. What must be true?
ll data values are exactly the same.
Histogram Best Uses
Best for showing the shape of numerical data.
Shows patterns like spread, center, skew, and peaks.
Scatterplot Best Uses
Best for showing the relationship between two numerical variables.
Helps reveal trends, clusters, and outliers.
Pie Chart/Bar Chart
Best for showing categorical data.
Pie charts show parts of a whole; bar charts make categories easy to compare.
Box Plot
Best for showing the spread and summary of numerical data.
Shows median, quartiles, range, and possible outliers.

Zero

Which scenario fits a binomial distribution?
B
In a binomial distribution, as n increases while p stays constant, what happens to E(X)?
C