Psychology 120 Final Exam Flash Card Set
1/109
There's no tags or description
Looks like no tags are added yet.
Name | Mastery | Learn | Test | Matching | Spaced | Call with Kai |
|---|
No analytics yet
Send a link to your students to track their progress
110 Terms
What is Science?
A set of methods for answering questions that encompass this belief system, goals, values, and attitude of consuming and creating good knowledge (epistemology).
What are the values of science?
1.) Empiricism
2.) Skepticism
3.) Parsimony
4.) Tentativeness
5.) Publicness
What is empiricism?
When objective evidence often comes from research studies and experiments (data and measurements are evidence) (the value of objective evidence)
What is skepticism?
The constant questioning, consideration of alterative explanations, and search for weaknesses in evidence.
What is parsimony?
The value that the simpler the explanation or a piece of evidence is the better. Simpler is better if the evidence is equal.
What is tentativeness?
The openness to new information and the ability to update beliefs based on evidence.
What is publicness?
When science is done openly and transparently and welcomes scrutiny.
What conditions determine causality?
1.) Cause and effect must be distinct constructs.
2.) Cause and effect change together.
3.) Cause must precede effect in time.
4.) Elimination of rival explanations.
What is the independent variable (IV)?
The condition that the experimenter manipulates.
What is the control group of the IV?
The same as the experimental group, except that it has not been exposed to the treatment.
What is the experimental group of the IV?
The group that received the treatment.
What is the Dependent Variable (DV)?
The variable that is measured or affected by the manipulation of the IV.
What is an Extraneous Variable?
Any variable other than the IV that affects scores on the DV.
What is a Confounding Variable?
Any variable other than the IV that systematically affects DV differently across the levels of the IV.
What is random assignment to groups?
When each participant is equally likely to be assigned to experimental or control group. Done properly, it can eliminate the effects of extraneous variables (on average across conditions to be 0) so that they cannot become confounding.
What is between-subjects design?
When different people are in the control and experimental groups.
What is a within-subject’s design?
When the same people are measured twice—once after receiving the control procedure and once after receiving the experimental procedure.
What are different levels of an IV called?
Conditions of an experiment (ex. control v.s. experimental).
How do you control for extraneous variables in a within participants experiment?
1.) Participants are their own, exactly matched control, so any extraneous variables are distributed equally and already controlled for.
2.) Effects of time and order become a potential confound, so we counterbalance or randomize (mix up) the order of conditions among participants.
What is causation?
Causation is a sort of gold standard of knowledge, and it can be found by running a true experiment.
What is a construct?
A conceptual name for a phenomenon of theoretical interest.
What are traits?
Stable, broad, enduring characteristics (e.g., personality).
What are states?
Temporary, fleeting, specific to a moment (e.g., feelings).
What is the operational definition?
How you identify and measure a construct.
What is reliability?
The extent to which we get consistent measurements and scores from a test or measure. (Consistency).
What is validity?
The extent to which a test or score measures the construct that it purports to measure? (Accuracy).
What is Nominal Data?
When data has only a name. It is categorical, and has no meaningful quantitative order. No mathematical operations are possible.
What is Ordinal Data?
When data has a name and is meaningfully ranked. We are unsure of the distance between points on the scale. No mathematical operations are possible.
What is Interval Data?
When data has a name and is meaningfully ranked. There is an equal distance between points on the scale. The scale has no true zero. Addition and subtraction is possible.
What is Ratio Data?
When data has a name and is meaningfully ranked. There is an equal distance between points on the scale. The scale has a true zero. Addition, subtraction, multiplication, and division is possible.
What is an assumption?
A condition that must be met for statistics to work correctly
What is a parametric statistical test?
A statistical test that assume interval or ratio data.
What are continuous variables?
Variables that cannot be nominal or ordinal and that allow fractions.
What is a discrete variable?
Variables that cannot allow fractions.
What is simple frequency?
How many people gave a particular measurement/score in your sample’s data.
What is a frequency distribution?
It is an organized portrayal of frequencies, that can be a table, but is usually a graph.
What is a histogram?
A graph that has bars touching, and it shows the distribution of interval/ratio data.
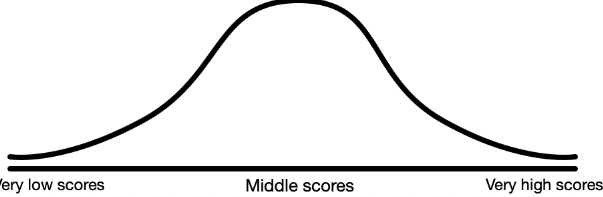
What is the normal distribution?
The normal distribution is a symmetrical, bell-shaped, hump in middle, and the ends of the curve are known as tails.
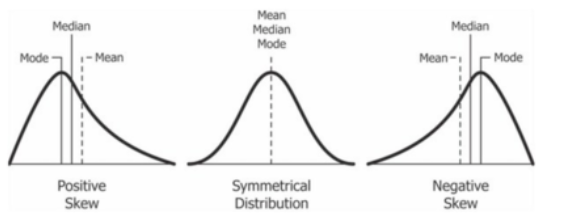
What is a negatively skewed distribution?
When there are a few extremely low scores that skew the left tail.
What is a positively skewed distribution?
When there are a few extreme high scores that skew the right tail.
What are descriptive Statistics?
Central tendency (mean, median, mode), Variability (range, variance, standard deviation), Percentiles, Descriptive Z-Scores
What is central tendency?
It is a number that helps us to understand the median and typical score or value in a data set.
Mean = Average
Median = Middle Most Score
Mode = More frequently/commonly occurring score
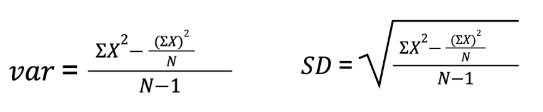
What is variability?
The variation or spread of the different scores of measurements within a dataset. Variability can quantify how different the scores are.
Range =
Variance = average distance (difference) of scores from their mean in squared units
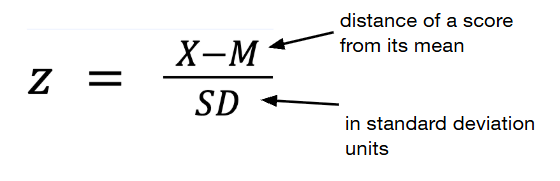
Standard Deviation = average distance (difference) of scores from their mean in original (raw score) units
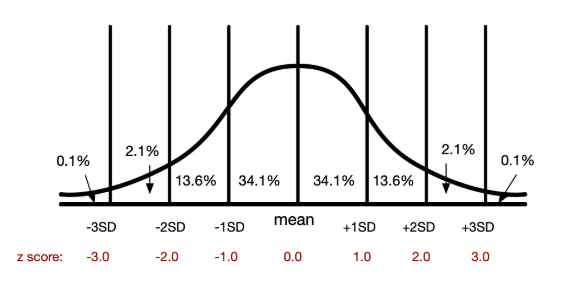
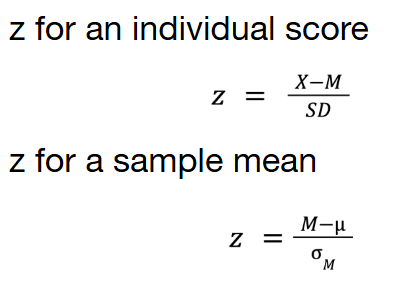
What are Z-Scores?
The distance of a score from its mean in standard deviation units.
You report it as __ % of scores are at or below the raw z score (usually it is between 1-99)
What is sampling?
Sampling is the act of selecting some specific research circumstances over others (Usually experimenters will pick the study’s participants, but it can also be stimuli, context, ect…)
What is the population?
Everyone to whom you want your results to apply.
What is a sample?
The people who are actually measured.
“N” = sample size
“n” = sub-sample
What is representativeness?
A representative sample is a sample that matches the population’s important characteristics.
What is Generalizability?
The extent to which we can draw conclusions about entire populations from a sample.
Bigger sample size usually means there is also more generalizability.
Randomness allows for the findings of a sample size to be generalized.
What is random sampling?
When every member if the population has an equal chance of being measured. Selection is based on chance alone.
What is convivence Sampling?
When you sample whomever is available.
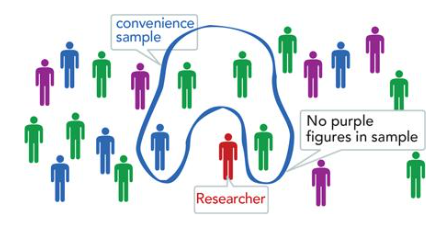
What is judgment Sampling?
When a researcher uses judgement to rationalize representativeness of convivence sample for their research question.
What is chance?
When something happens unpredictably without discernable human intention or observable cause.
What is Probability?
Quantifies chance in the long run (over time). Ranges from 0 to 1
What are inferential statistics?
When we can use statistics to make descisions when faced with uncertainty. (uncertainty = chance).
What is mu?
The population mean.
What is sigma?
The population standard deviation.
What is sampling error?
Sampling error is the error made when we use statistics to estimate parameters. For means, sampling error occurs when chance give you a value for M that does not equal mu. (The error is the difference between M and mu)
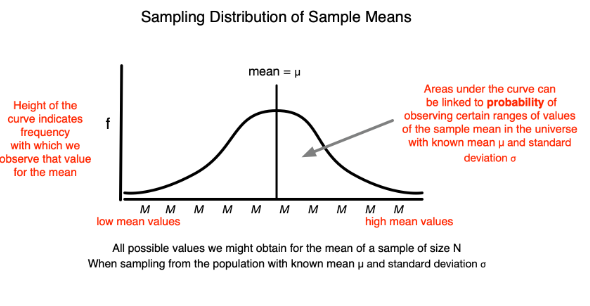
What is the sampling distribution of sample means (SDSM)?
It is the frequency distribution of all possible values of M when samples of size N are randomly selected from a population.
Has a normal distribution.
Has mean as mu.
Has a known standard deviation called standard error of the mean.
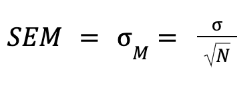
What is the standard error of the mean?
The standard deviation of the sampling distribution of sample means. It is a measure of sampling error (The average error we make when we use M to estimate mu).
What is the inferential Z-Test?
(1) A statistical test used when you have a sample of N interval or ratio scores with mean M from a normally or approximately normally distributed population
(2) You know the population mean and standard deviation (𝛍 and 𝜎)
(3) You want to know if the sample mean M is significantly different from the known population mean 𝛍
What is a type I error?
When you reject a true Ho. Claimed a real difference when the observed difference was actually due to sampling error.
What is type II error?
When you fail to reject the false Ho. Claimed an observed difference was due to sampling error when it was a real effect.
What is the single sample T-Test?
(1) You have a sample of N interval or ratio scores with mean M from a normally or approximately normally distributed population
(2) You know the population mean (𝛍) [or you know a specific value you wish to compare to your sample mean]
(3) You do not know the population standard deviation(𝜎)
(4) You want to know if the sample mean M is significantly different from the known 𝛍.
What is an independent sample T-Test?
Use when
You have a two independent samples of interval or ratio scores with means M1 and M2 with approximately equal variances from a normally or approximately normally distributed population. (e.g., if you have an experiment with one group eating breakfast, and another one not eating and to see if there scores on a DV differ).
AND
You want to know if the means are statistically significantly different from each other
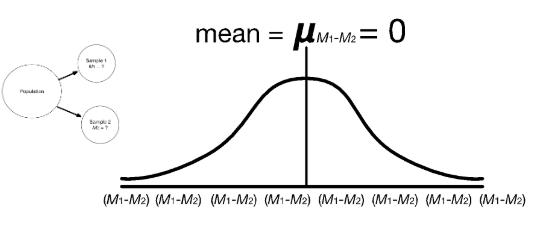
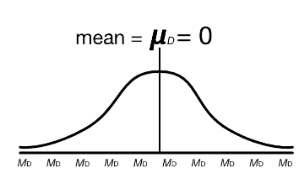
What is the sampling distribution of differences between means?
Frequency distribution of all possible values of (M1 - M2) when two samples of sizes n1 and n2 are randomly selected from the same population over and over and over…. This sampling distribution is showing that there was no difference between means.
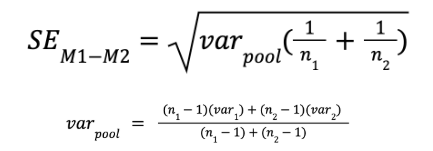
What is the error of the difference between means?
Average error we make due to chance when we use (M1 - M2) to estimate µM1-M2
Measure of sampling error for independent sample t-test
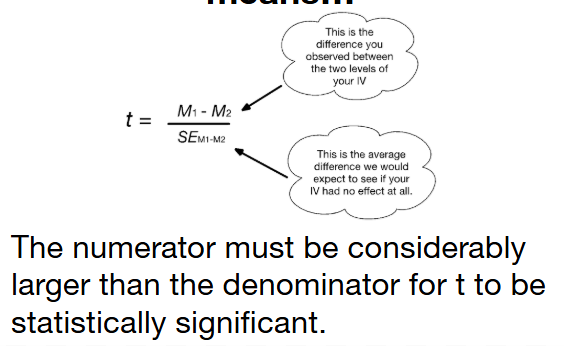
What is Tobt?
T is a value which takes the mean difference, and divides it by the error we make due to chance when we use (M1 - M2) to estimate µM1-M2.
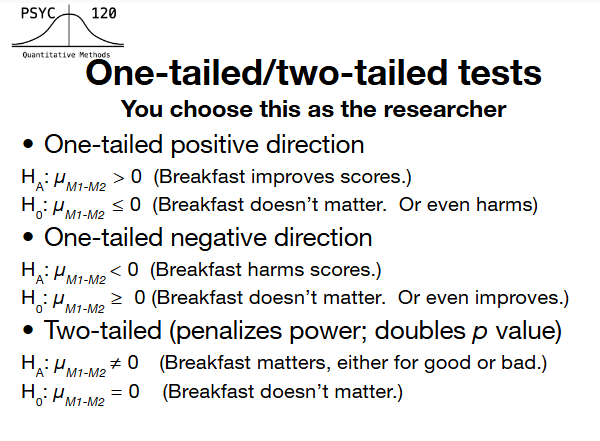
What is the null hypothesis for an independent T-Test?
What is Alpha (criterion)?
The criterion for deciding if a difference is so unusual that it is very unlikely to have come from sampling distribution where Ho is true.
What is the P-Value?
probability of getting your observed difference (or one even larger) from sampling distribution where H0 is true
so p < .05 is “statistically significant”
What is a dependent samples t-test?
Use when: You have IV with two levels in a within-subjects design
Or any other design with 2 matched/related groups
Use when you have a two group within-subjects design
Assumptions:
Data are interval or ratio.
Distribution of differences (measurement 1 – measurement 2) is approximately normal.
What is the sampling Distribution of Mean Differences?
Frequency distribution of all possible differences we might get due to sampling error when there was no difference in repeated measurements.
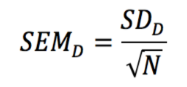
What is the standard error of mean difference?
SD of the sampling distribution of the mean difference
Average error we make due to chance when we use MD to estimate μD
Measure of sampling error for dependent t-test
What is the NHST for a dependent samples T-Test?
What are the assumptions of the one-way ANOVA?
1.) Scores are measured on an interval or ratio scale. 2.) Scores are sampled from a normally distributed population of scores. 3.) The variance of scores between groups is about equal or homogeneous across all populations sampled. (homogeneity of variance).
What are confidence Intervals?
A process that produces a range of scores within which the true population parameter would fall in 95% of samples.
What are degrees of freedom (df)?
The denominator of variance (MS), which is used to relate the number of participants contributing to our estimates and the things we are estimating.
What are error bars?
A visual indicator of variability on a bar graph. They can represent the standard deviation, standard error of the mean, and or the 95% confidence interval.
What are the mean squares (MS)?
The average distance of scores from their mean in squared units (it is the calculation of variance).
What is k?
K is a variable used to represent the number of levels of the IV in an ANOVA.
What is statistical power?
The statistical ability to reject the null hypothesis when it is false. It can be affected by the sample size, variability of the DV, alpha (criterion), and effect size. The more statistical power, the better, preferably, you want to have statistical power greater than 0.80.
What is the Cohen's d?
The measure of effect size for differences between two means
What is the F statistic?
The F statistic is a family of distributions that we can use to make informed decisions about the probability that we found our obtained F as the result of a real effect as opposed to sampling error.
What is the one-way ANOVA?
A statistical test used when you have one independent variable with more than two levels.
What is the Sum of Squares (SS)?
The numerator of the variance (MS), that represents the sum of squared differences from a mean.
Why are Post-Hoc Tests Used?
Because ANOVA is an omnibus test (meaning that it looks for all possible differences at once), we use post hoc testing to further break down a statistically significant analysis to see which pairwise analyses are actually significant.
What is treatment variance?
Variance is introduced to the data by the independent variable.
What is error variance?
Variance is introduced to the data by other (unknown) reasons.
What is variance?
The variety of scores that different people get on any dependent variable that we measure.
Within Groups Variance
Error Variance
Between Groups Variance
Error Variance + Treatment Variance
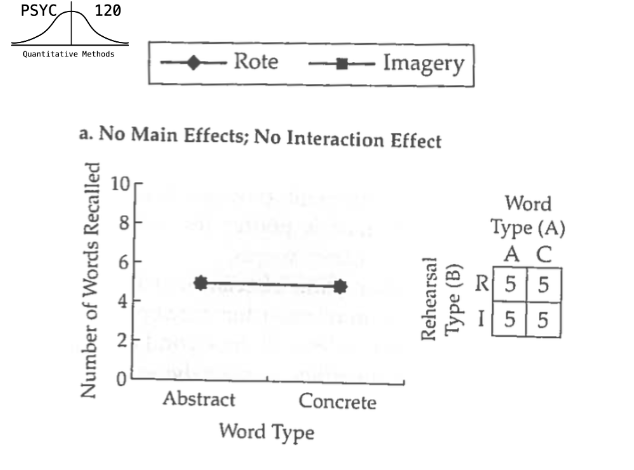
What is a significant interaction?
A significant interaction means that the effects of one independent variable (on the dependent variable) are different across the levels of the other independent variable.
What is a Two-Way ANOVA?
A statistical test used for when you have two independent variables, each with multiple levels of the IV and one dependent variable. This kind of statistical test can be useful because it can detect the effects of two independent variables alone (main effects), as well as interactions between the independent variables.
What is a Main Effect?
The effect of one IV alone ignoring the IV.
What is an interaction?
A significant interaction means that the effect of one independent variable (on the dependent variable) are different across the levels of the other independent variable.
What effects does a Two-Way ANOVA look at?
1.) The effect of the first IV by itself. 2.) The effect of the second IV on itself. 3.) The effect of any interaction between the first and second IVs.
What is collapsing?
Collapsing is the process of calculating the M, sum of values, and n for each independent variable alone. We complete collapsing so that we can measure the effects of the 2 IVs independently.
What is the Tukey- Kramer HSD?
A procedure for comparing every possible pair of group means to pinpoint specific differences after running an ANOVA exam.
Flat Line Interaction?
Tend to indicate no effect (same mean on Y-axis)