Schedule risk analysis
1/9
There's no tags or description
Looks like no tags are added yet.
Name | Mastery | Learn | Test | Matching | Spaced | Call with Kai |
|---|
No analytics yet
Send a link to your students to track their progress
10 Terms
Risk
Risk = probability * impact
The black swan case
The probability is almost 0 that the event will happen
But the impact is really huge.
And the history is define by those black swans
Schedule risk analysis steps
Define point of reference (baseline schedule)
Identify the risk (uncertainty) - add distributions of the duration of each activity
Analyse the risk with Monte Carlo Simulation (risk analysis technique where the computer runs thousands of project scenarios based on uncertainty inputs (best case / most likely / worst case) for each task, and the output provides the probability of completing the project by a certain date)
Interpretation of the output
Output interpretation indexes
CI - criticality index
The probability that an activity lies on the critical path (slack = 0)
CI = P (SL = 0) - probability that slack = 0
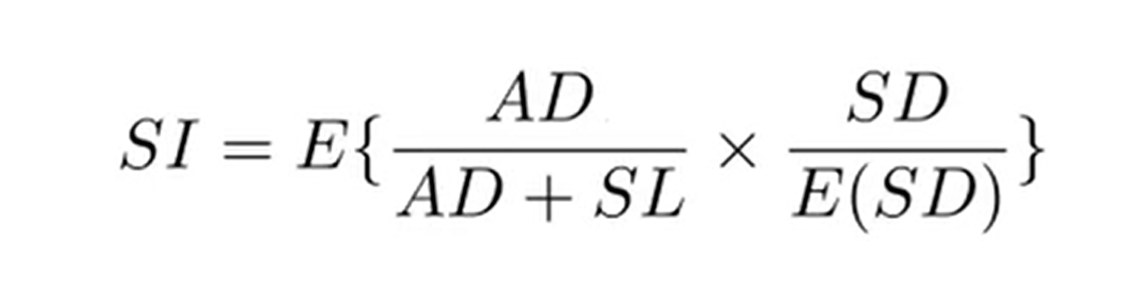
SI - significance index - measures the impact of variability in activity durations on the total project duration.
AD - activity duration
SL - slack
SD - simulated duration
E{x} - expected value of x (average value of all simulations)
SSI - schedule sensitivity index - multiplies the standard deviations of the activity durations and project duration (approximately impact) with the criticality index (probability)
SSI is almost equal to CI*SI
More or less, as criticality index = probability, si = impact, but in some extreme cases the product of those two will be different from the actual ssi.
Step 2. Define uncertainty
Uncertainty:
In activity duration
Probabilistic branch = the relationship btw activities is not always correct (in parallel instead of sequential)
Probability activity existence - activity might not exist
Methods:
Statistical estimates (hard to calculate distributions that will correspond to reality)
Three-point estimates - similar to PERT
Risk classes (pragmatic) - often used in reality - group into variation (small variation), foreseen uncertainty (known unknowns), unforeseen uncertainty (unknown unknowns)
On what to focus which metrics to use
For the risk analysis, use SSI more than CI or SI - control efficiency. Under the condition that you use it as an excellent manager (not a control freak or lazy one)
The problem with CI/SI only: you see problems too late
How to capture the money risk
CRU - cruciality index - correlation between the activity cost and total project cost.
Also measures correlation of time
Schedule risk analysis efficiency for serial and parallel networks
Schedule risk analysis works better for parallel networks.
Serial networks - > more likely that activities will lie on a critical path (CI increases), as activities become critical slack decreases (SI increases) → SSI increases. All of them will increase up to 100%, showing all activities as risky ones, hard to focus.
Prioritize risk proposals
Look at the probabilities and impact,so use SSI for that. Highest value - top priority, as it shows the most dangerous activities
Also look at CRU - cruciality index. In case of the most expensive activity, the proposal could be accepted, even if SSI is not very high, but CRU should be found (by rerunning Monte Carlo simulations)