MAS-1
1/82
Earn XP
Description and Tags
MAS-1 Flashcards
Name | Mastery | Learn | Test | Matching | Spaced | Call with Kai |
|---|
No analytics yet
Send a link to your students to track their progress
83 Terms
Local regression should not be used in a (pick one) low dimensional setting/high dimensional setting.
high-dimensional setting. Because Local regression can perform poorly when p>>4 predictors are used in modeling.
How many degrees of freedom does a chi square goodness of fit test have if we have k categories and r estimated parameters?
DOF = k - (r+1) or k - r - 1
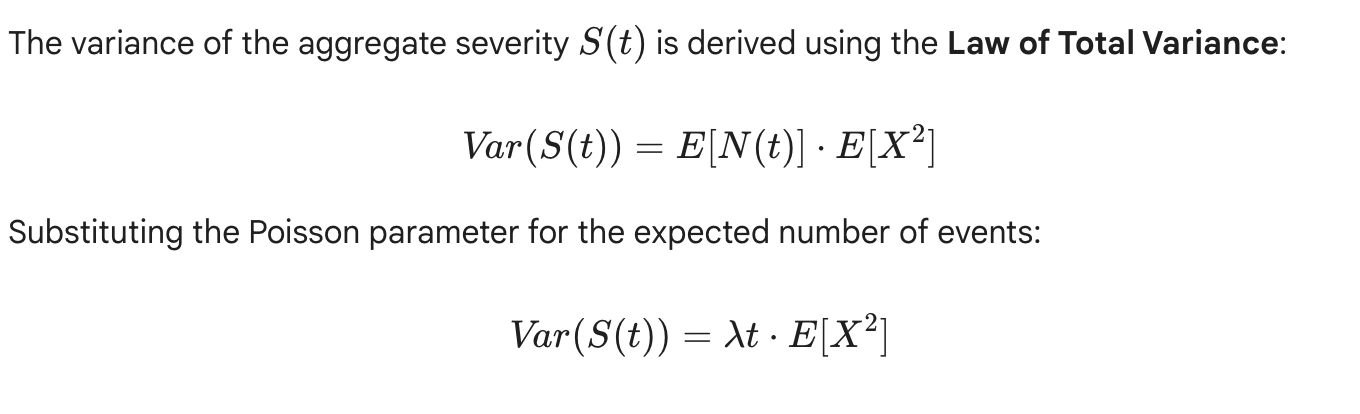
What is the formula for the variance of the severity of a Poisson Process?
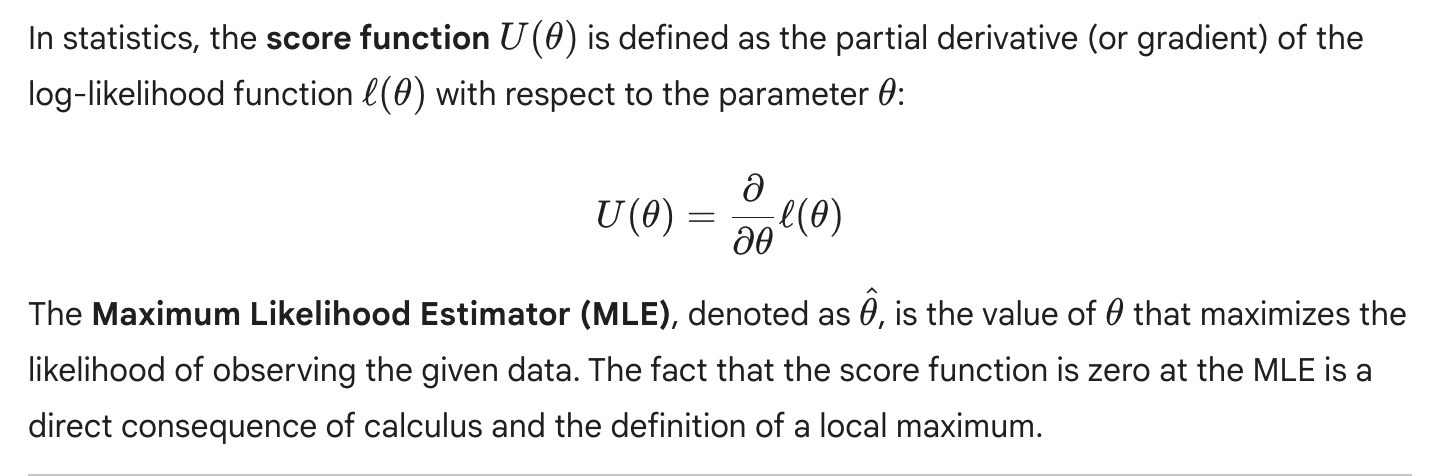
At the MLE, the score function is _____ because _____
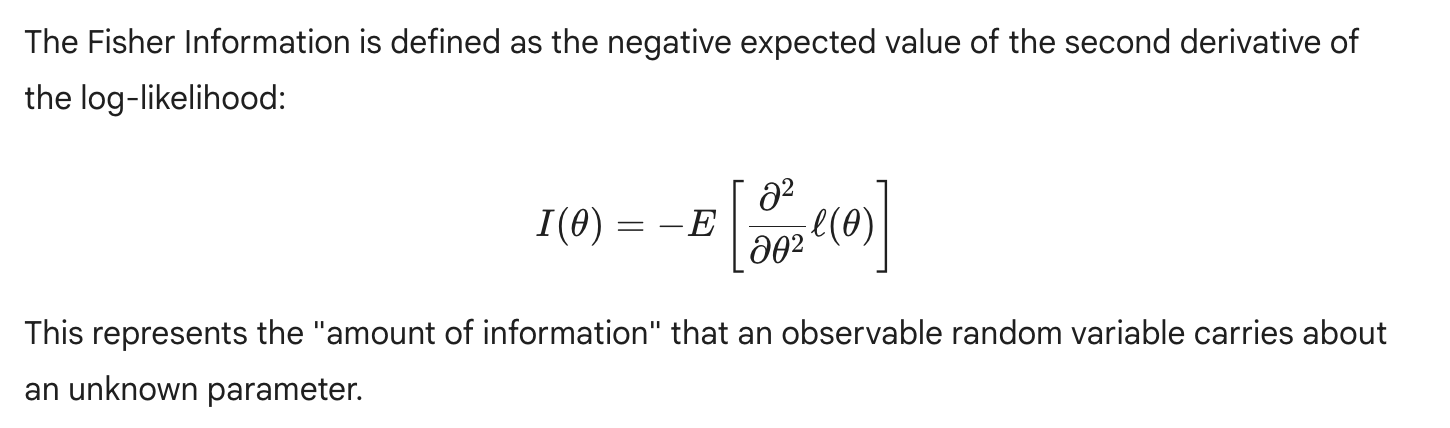
Fisher information is defined as…
Nice shortcut: The information for n observations is ____
n times the information for one observation
High leverage point is ____ times the average, where the average is _____
High leverage point is three times the average, where the average is (p+1)/n.
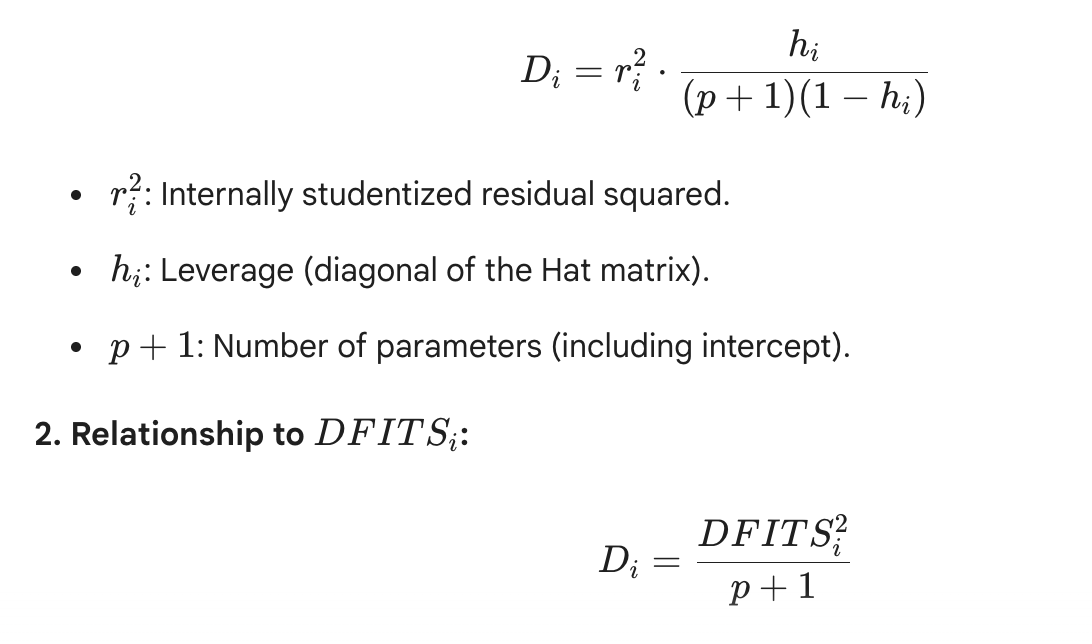
An observation is considered influential if it has both a high ________ and high _______. Measures that combine these two quantities, such as _________, are used to assess influence.
An observation is considered influential if it has both a high standardized residual and high leverage. Measures that combine these two quantities, such as Cook's distance, are used to assess influence.
State Cook’s Distance Formula and explain what the letters represent
The validation set approach is a simple strategy for ______________. You randomly divide your available data into two parts: a ___________ (used to _____ the model) and a _______(used to ______ the model).
The validation set approach is a simple strategy for estimating a model's performance on unseen data. You randomly divide your available data into two parts: a “training set¨ (used to fit the model) and a validation set (used to test the model).
Validation Set Approach. The data is split so that _____% is used for training.
50%
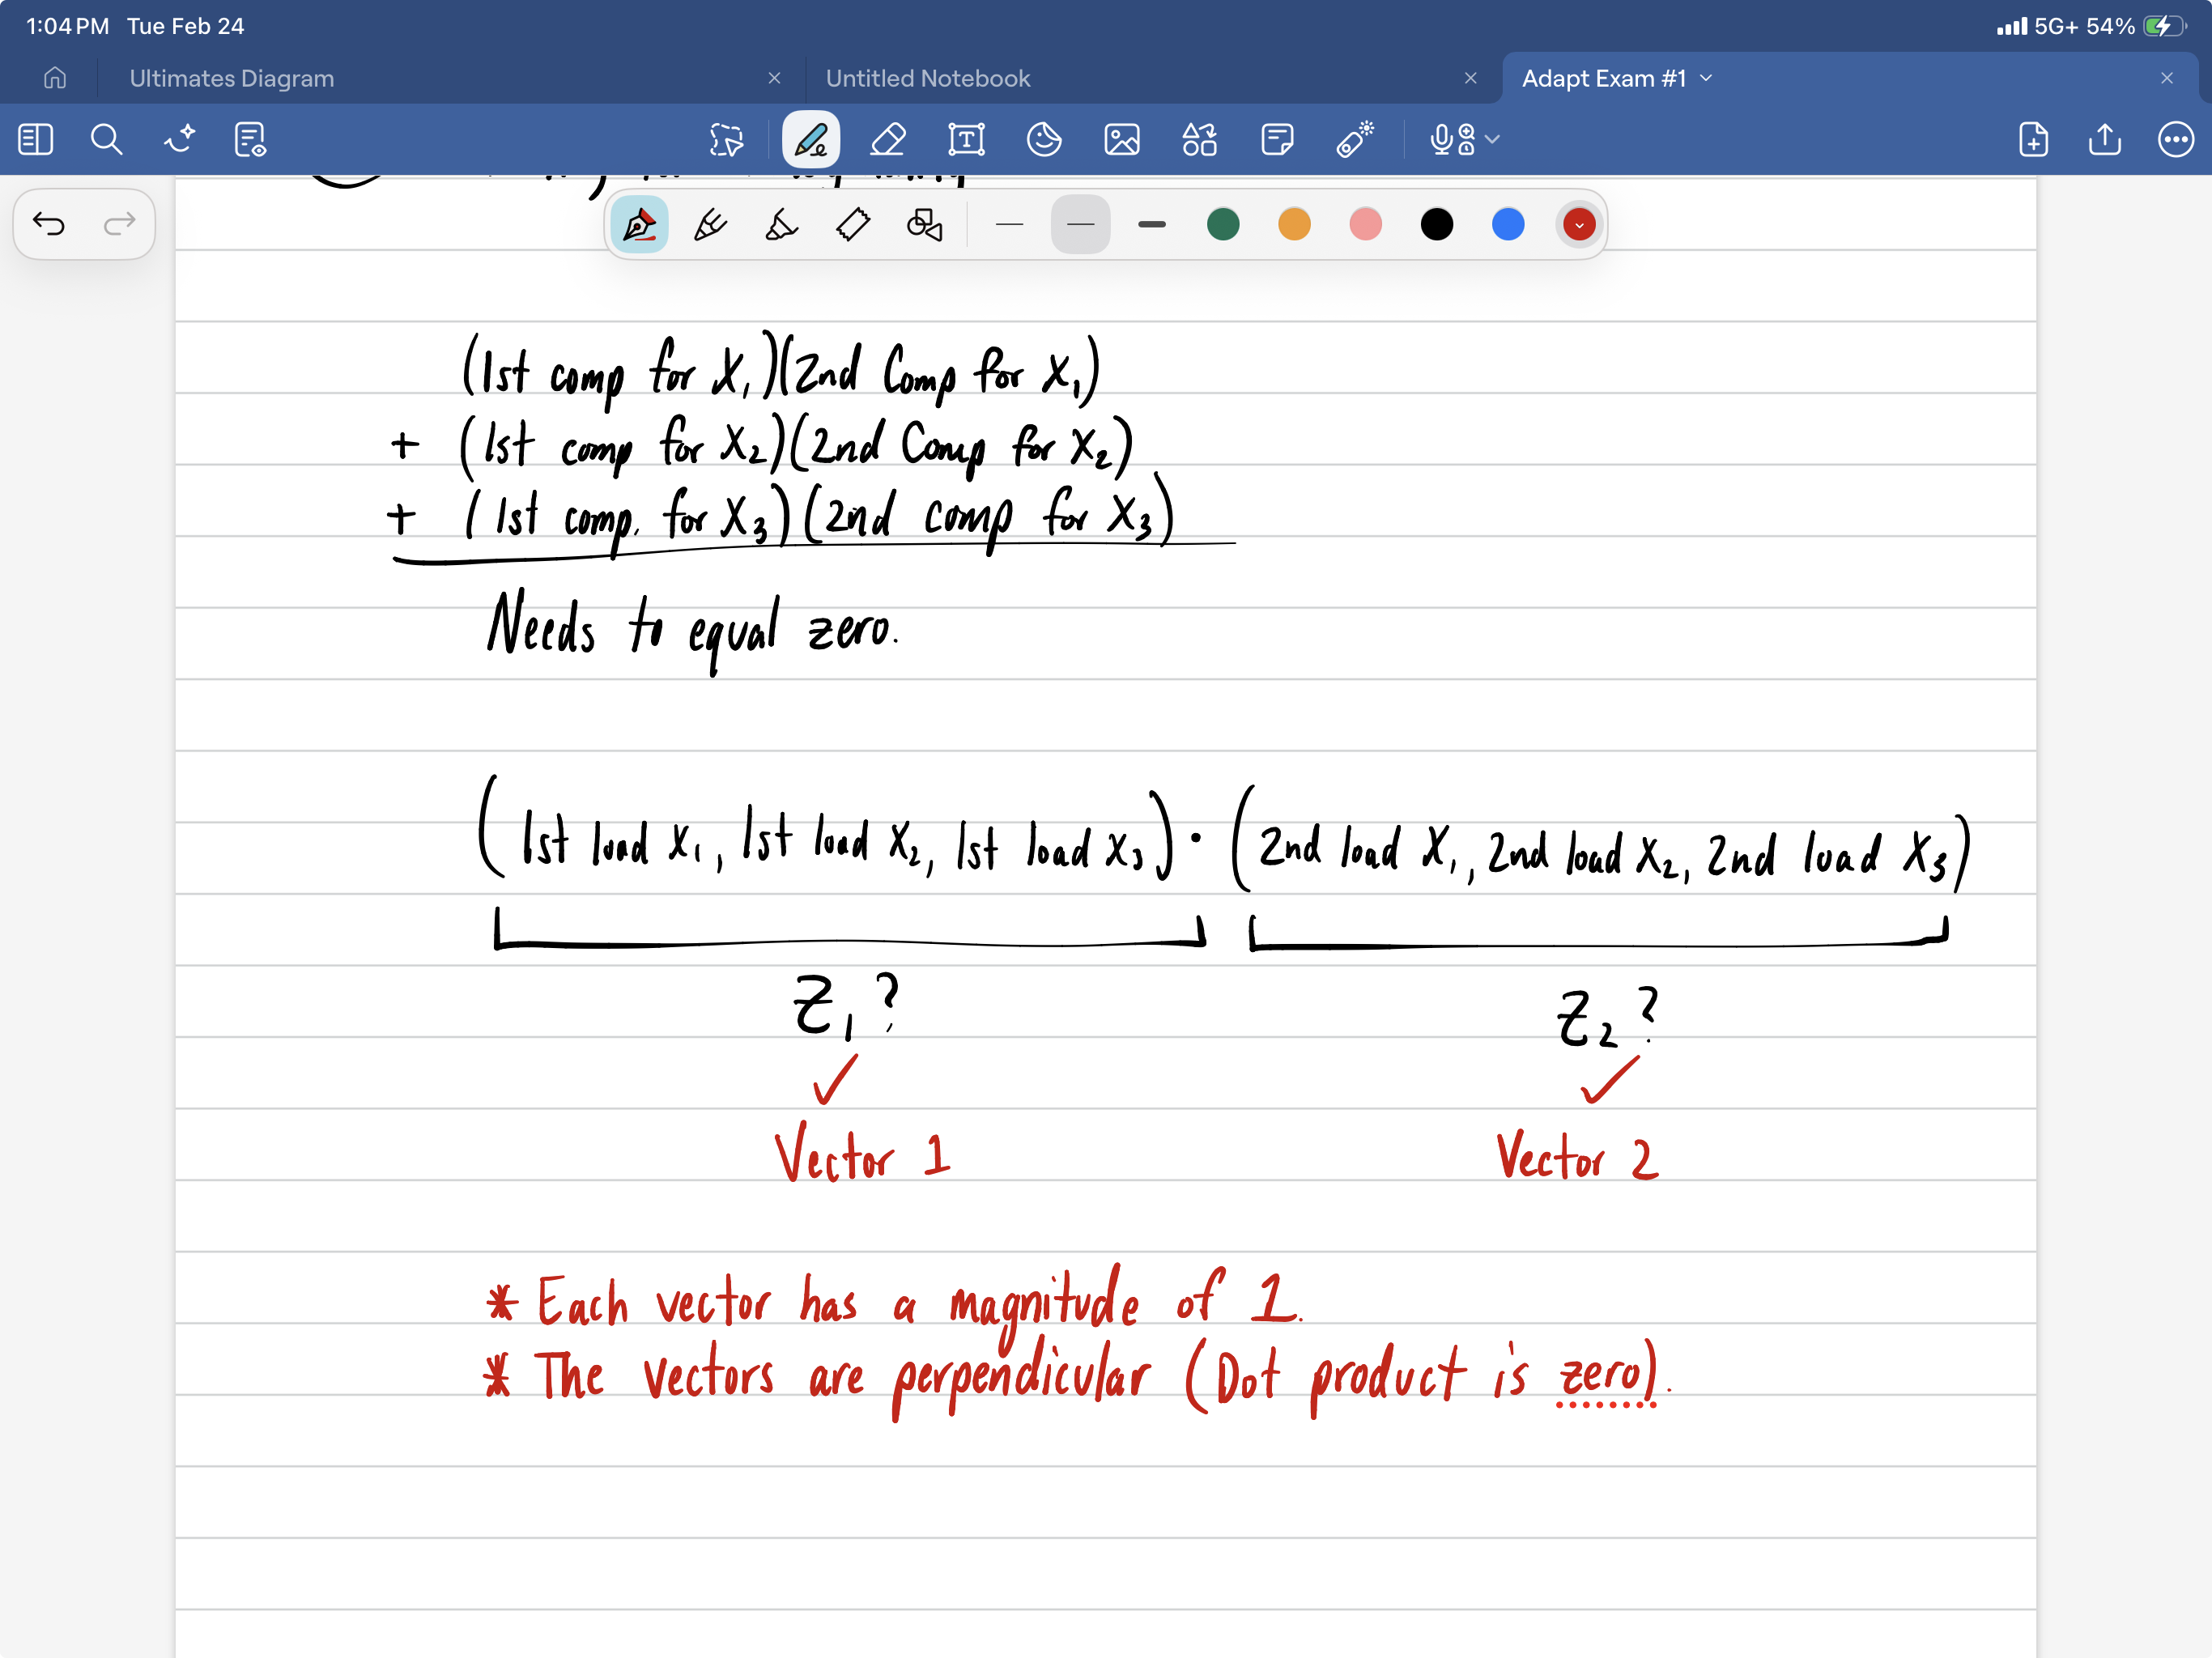
For any single principal component, it is required that ______________. This ensures the new component _______________
For any single principal component, it is required that the sum of its squares is one. This ensures the new component doesn’t artificially inflate the variance.
Principal components are designed to be unrelated to each other. This means the ___________ of the loadings for Z1 and Z2 must equal ______.
Principal components are designed to be unrelated to each other. This means the dot product of the loadings for Z1 and Z2 must equal zero
The deviance for normal distributions is proportional to the _______________. Explain what this means.
The deviance for normal distributions is proportional to the residual sum of squares. Think of deviance as the GLM version of, “Residual Sum of Squares”.
While residual sum of squares measures the physical distance between points and a line, Deviance measures the "distance" in terms of _____________. Specifically, Deviance is the _______ or "lack of ________" compared to a __________.
While residual sum of squares measures the physical distance between points and a line, Deviance measures the "distance" in terms of likelihood. Specifically, Deviance is the error or "lack of fit" compared to a saturated model.
Deviance communicates how much ________ we are losing by using our ________ instead of the perfect ____________.
Deviance communicates how much "likelihood" we are losing by using our simplified model instead of the perfect Saturated Model.
Formula for scaled deviance in a normal distribution:
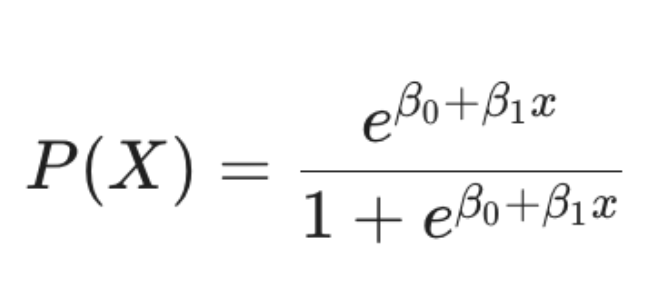
To map any real number to the (0,1) range, we use the ________ function. State this function as a function of Beta0 and Beta1
To map any real number to the (0,1) range, we use the logistic function:
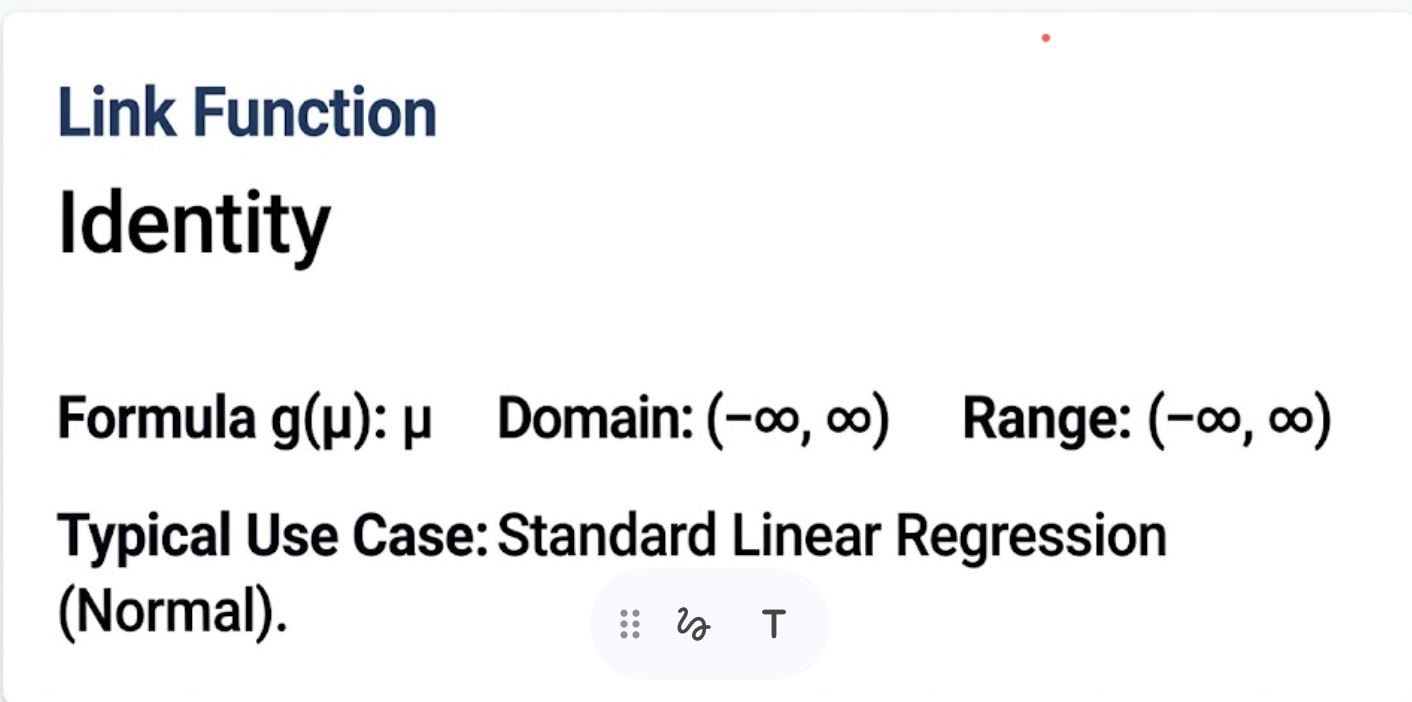
State the formula for the identity link function, its domain, its range, and typical use case.
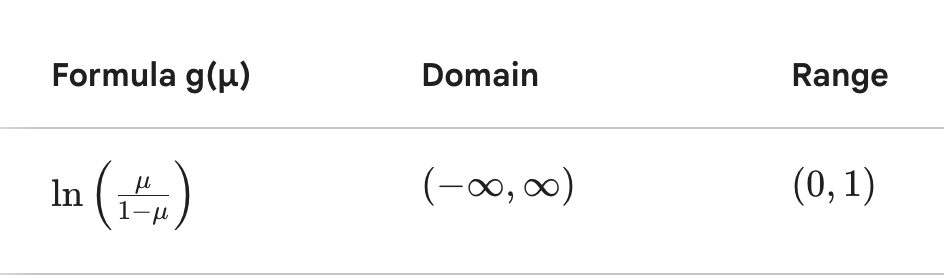
State the formula for the logit link function, its domain, its range, and typical use case.
Use: Binary classification - claim occurrence.
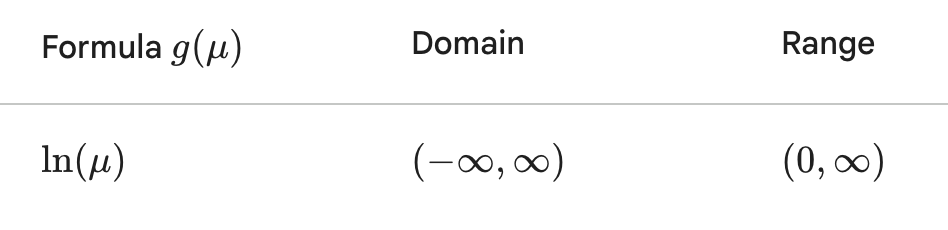
State the formula for the log link function, its domain, its range, and typical use case.
Use: Freq/Sev. Claim counts or costs.
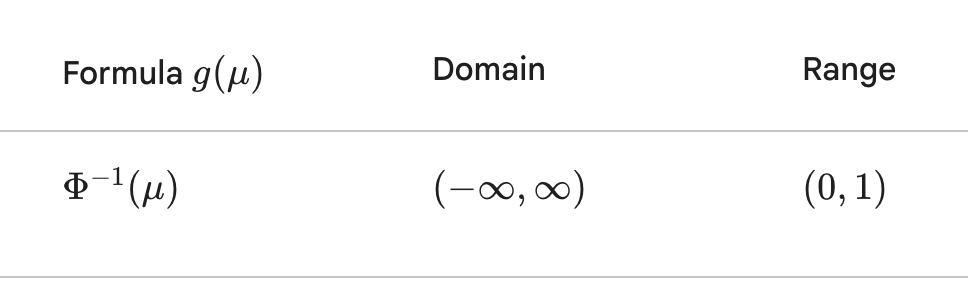
State the formula for the probit link function, its domain, its range, and typical use case.
Use: Inverse CDF of Normal distribution.
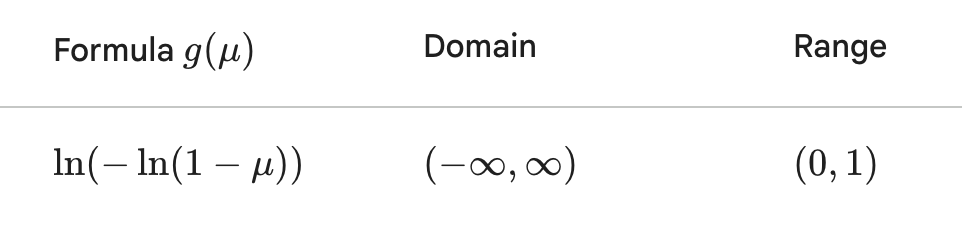
State the formula for the complementary log-log link function, its domain, its range, and typical use case.
Asymmetric. Rare "Yes" events.
State the formula for the inverse link function, its domain, its range, and typical use case.
Use: Gamma. Claim severity/settlement.
Which link functions have domains of all reals but ranges of 0 to 1? What do we tend to use these link functions for?
Logit, Probit, or Cloglog Link. Use for binary classification where the output is a probability.
Which link functions have domains of all reals but ranges of only positive values? What do we tend to use these link functions for?
Log or Inverse Link. Use for strictly positive data like claim frequency or severity.
Which link function is best able to handle scenarios where “success” is very rare?
Complementary log-log link.
What is the canonical link function for a normal distribution?
Identity
What is the canonical link function for a Poisson distribution?
Log
What is the canonical link function for a Bernoulli/Binomial distribution?
Logit
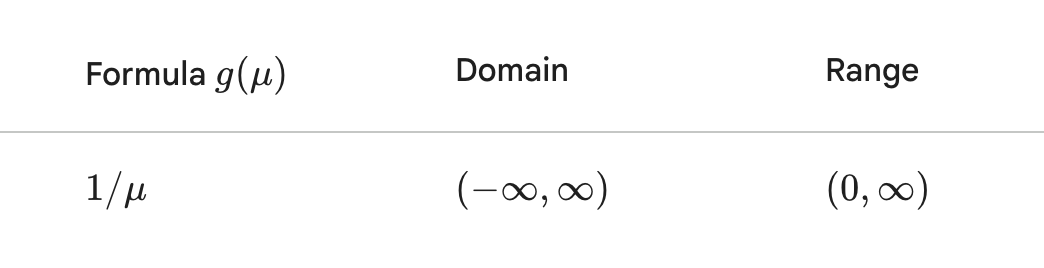
What is the canonical link function for a Gamma distribution?
Inverse (1/u) (Log is also practical since it guarantees positive means)
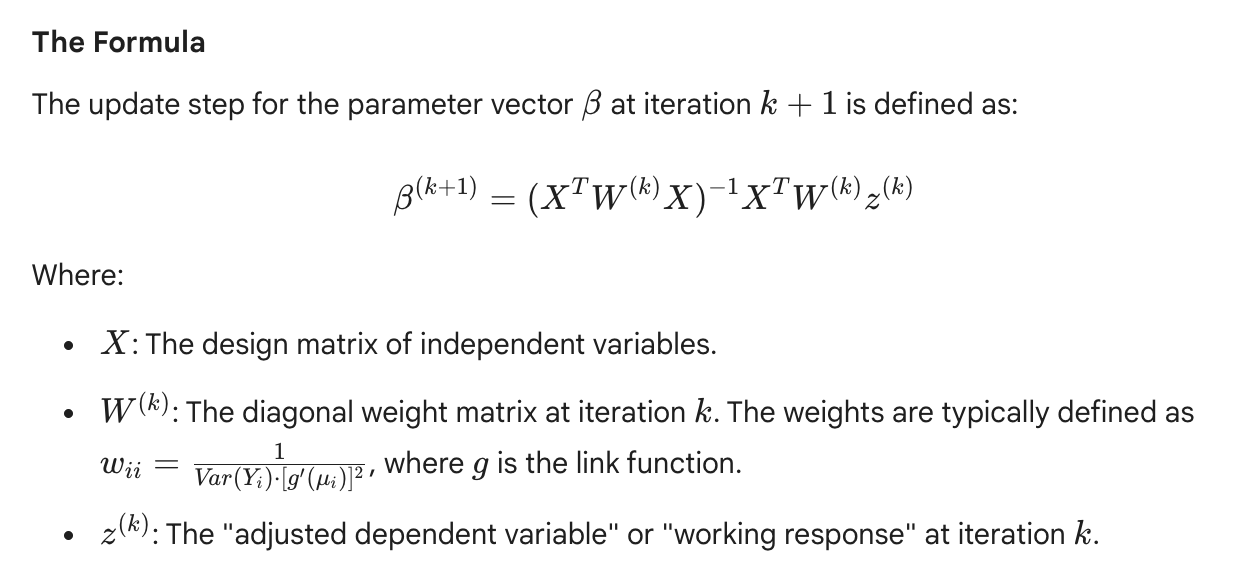
What is the Iterative Weighted Least Squares Formula?
Why does the number of knots need to be considered if using a regression spline but not if using a local regression?
When you use a regression spline, you are defining a basis function that exists across the entire range of your data. The Knots define the flexibility. You have to be intentional about how many knots you use because that number directly determines the degrees of freedom in your model. Local regression doesn't use knots because it doesn't divide the x-axis into fixed segments. Instead, it uses a bandwidth.
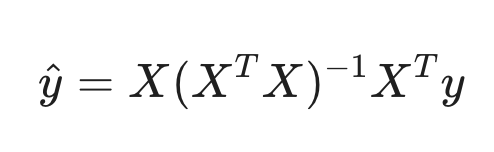
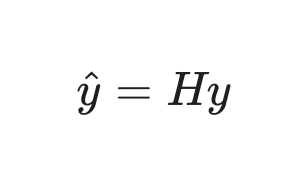
Matrix formula for y hat:
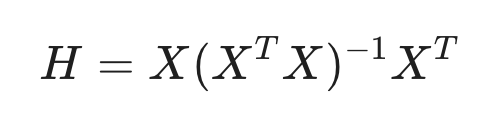
Formula for the Hat Matrix
Formula involving y, y hat, and the Hat Matrix.
What are two unsupervised types of learning?
Principal Component Analysis and Clustering
In a QQ plot, ______ goes on the x-axis and _____ goes on the y-axis.
In a QQ plot, theoretical quantiles goes on the x-axis and sample quantiles goes on the y-axis.
If a QQ plot shows heavy tails, standard errors might be ______(over/under)-estimated and your "t-tests" for coefficient significance might be ________.
If a QQ plot shows heavy tails, standard errors might be underestimated and your "t-tests" for coefficient significance might be unreliable
If your raw data looks curved on a Q-Q plot but looks like a straight line after a log transformation, you’ve likely found that your data is ________ —a very common occurrence in insurance claim amounts.
If your raw data looks curved on a Q-Q plot but looks like a straight line after a log transformation, you’ve likely found that your data is Log-Normal—a very common occurrence in insurance claim amounts.

In Ridge/Lass regression, who shrinks some to zero, and who shrinks all toward zero, but never hits zero?
Lasso: Shrinks all the zero
Ridge: Shrinks all toward zero, but never hits zero
Who offers more flexibility: ridge or lasso?
Lasso as it produces a simple list of predictors but ridge keeps all variables in the model
What are the best use cases for Ridge and Lasso regression?
Lasso is best when you suspect only a few variables are “real”
Ridge is best when you think many variables have small effects.
Problems with a quantitative response are called _____ while problems with a qualitative response are called ______ problems
Problems with a quantitative response are called regression while problems with a qualitative response are called classification problems
Bias refers to the _______ that is introduced by approximating a real-life problem (which may be extremely complicated) by a much ________ model.
Bias refers to the error that is introduced by approximating a real-life problem (which may be extremely complicated) by a much simpler model.
T or F: The irreducible error can be minimized by choosing a statistical learning method with lower variance and bias.
False!
Summarize the rules for Principal Component Analysis (PCA)
Relationship between residual standard error and MSE

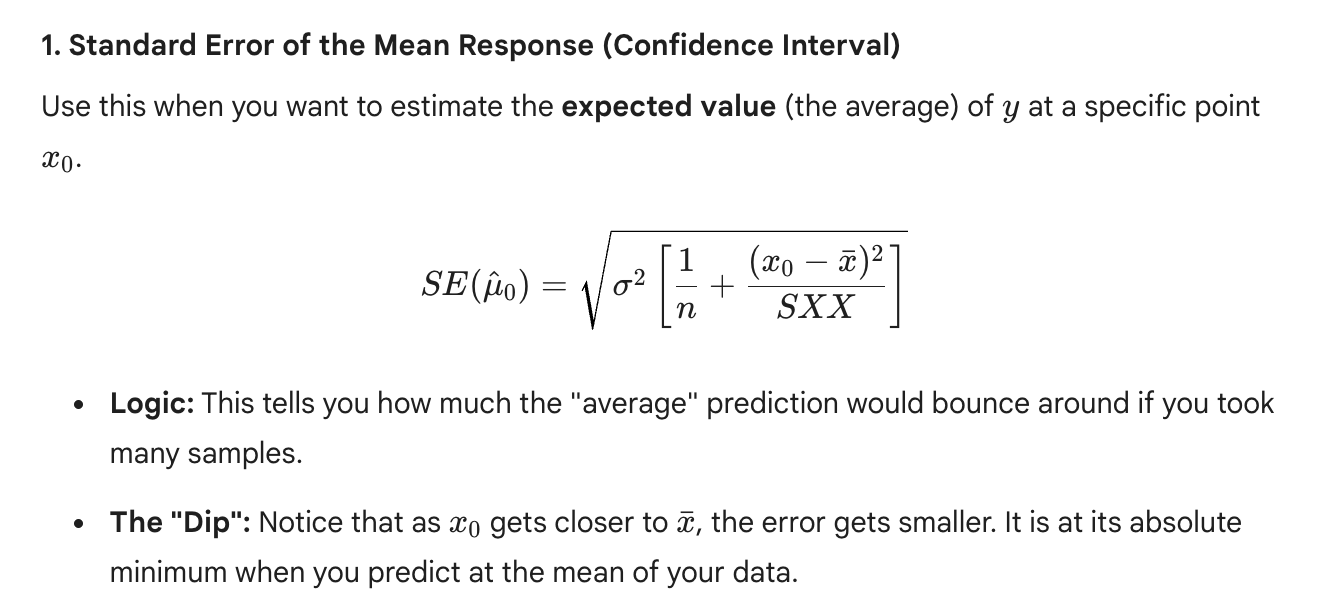
Formula for the standard error of the mean response is:
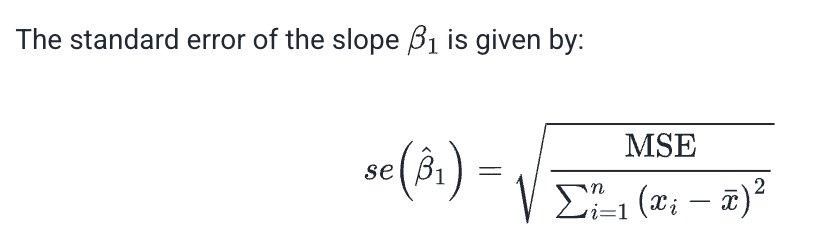
The standard error of the slope (Beta1) is:
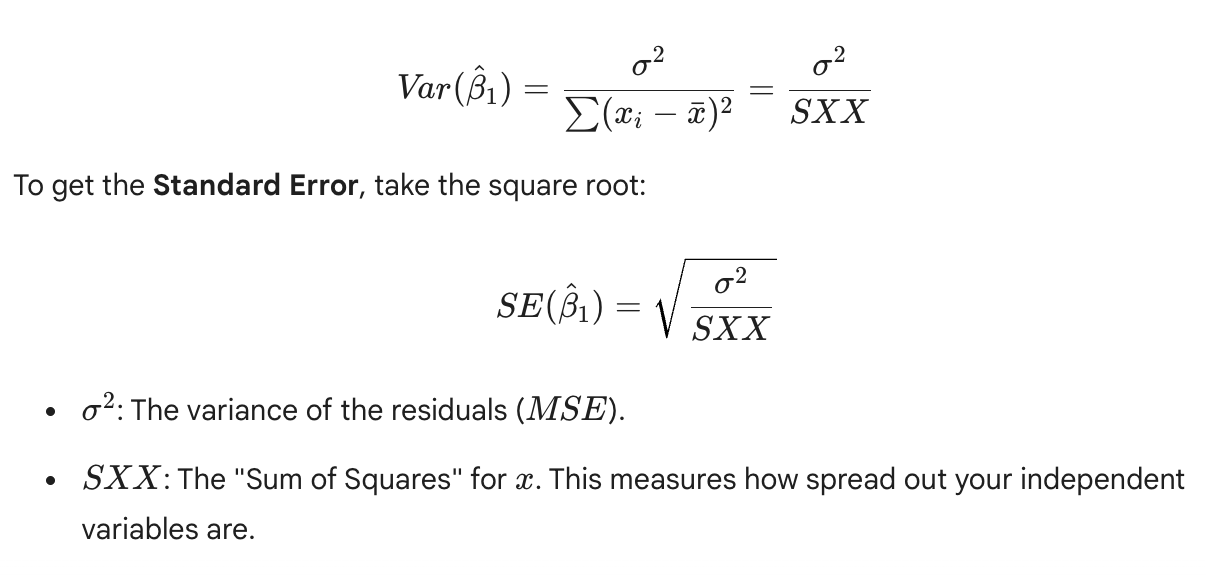
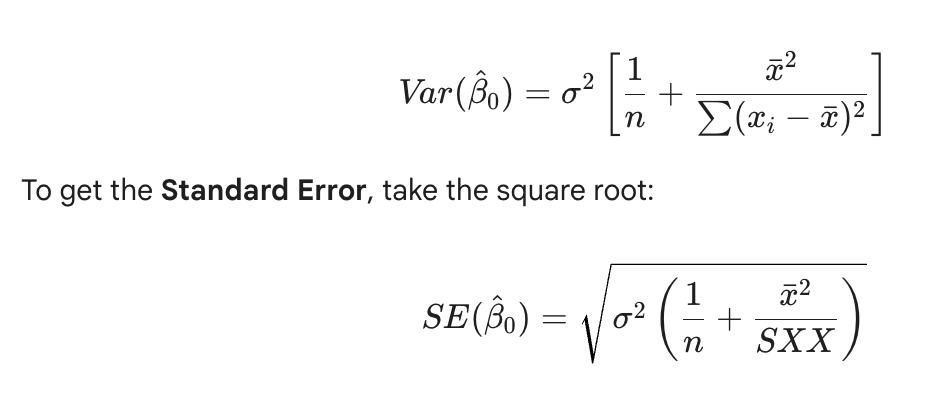
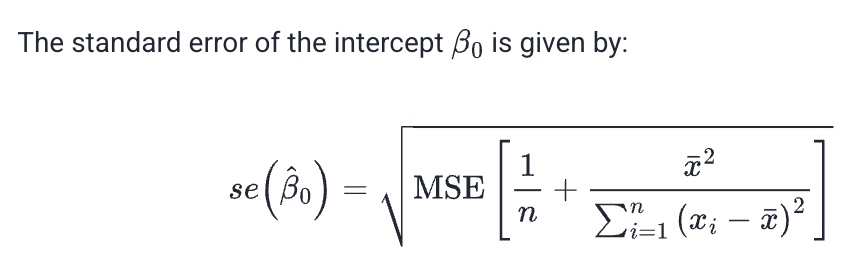
The standard error of the intercept (Beta0) is:
Since y hat necessarily goes through __________, the equation for y hat is:
Since y hat necessarily goes through (x bar,y bar), the equation for y hat is: y hat - y bar = slope (x hat - x bar)
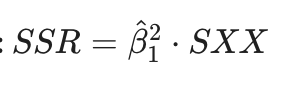
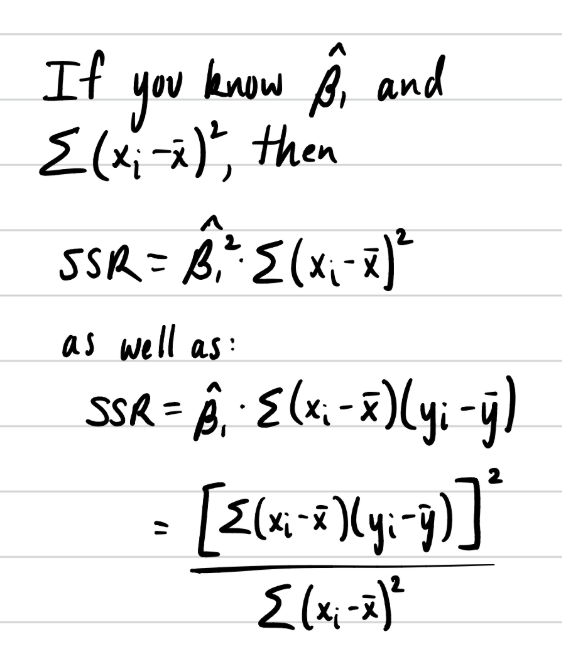
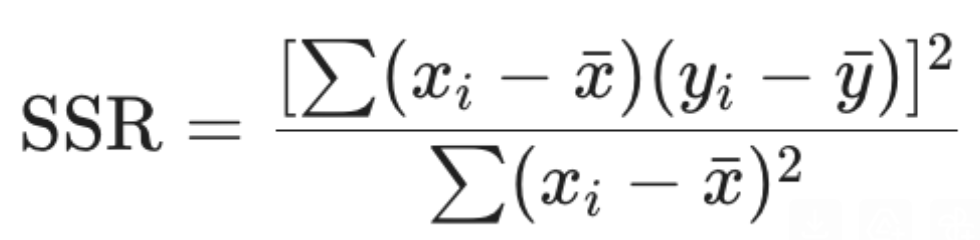
Equation involving SSR, x bar, y bar, xi, yi
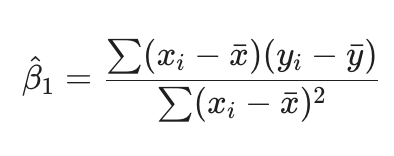
Equation involving B1, x bar, y bar, xi, yi
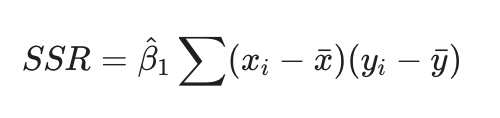
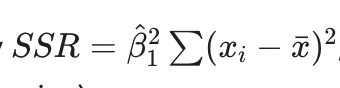
Equation involving SSR, B1, x bar, xi
In a standard Poisson GLM, we assume Var[Y] = E[Y]. When Var[Y] > E[Y], the data is _________, making the standard Poisson model's standard errors too _______ (and p-values too __________).
In a standard Poisson GLM, we assume Var[Y] = E[Y]. When Var[Y] > E[Y], the data is overdispersed, making the standard Poisson model's standard errors too small (and p-values too "significant").
The Quasi-Poisson model introduces a __________ to relax the variance constraint.
The Quasi-Poisson model introduces a dispersion parameter (phi) to relax the variance constraint.
What impacts do Quasi-Poisson processes have on statistical inference?
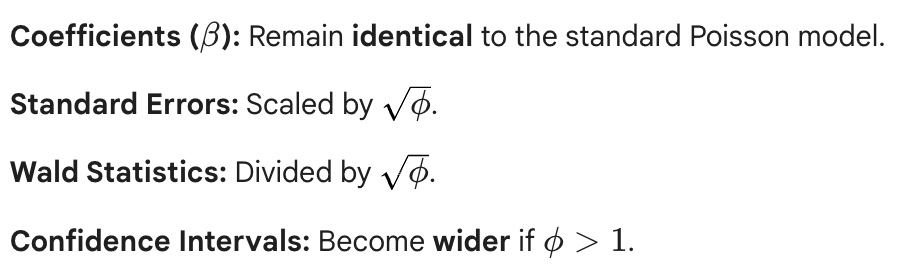
When dealing with a Quasi-Poisson process, a variable that looked "highly significant" (p < 0.01) under a standard Poisson might become _________ (p > 0.05) under Quasi-Poisson. It forces you to only ________ variables in your model that have __________ relative to the extra noise.
When dealing with a Quasi-Poisson process, a variable that looked "highly significant" (p < 0.01) under a standard Poisson might become not significant (p > 0.05) under Quasi-Poisson. It forces you to only keep variables in your model that have a very strong signal relative to the extra noise.
Equation relating Beta1, SSR, SXX.
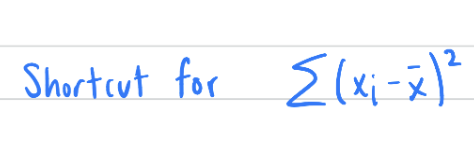
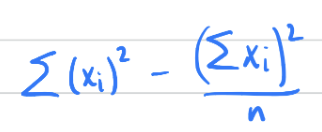
What is SXX?
Sum of squares for X.
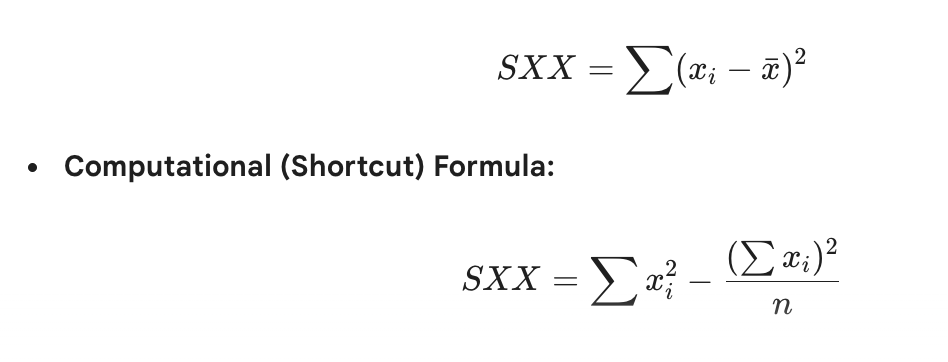
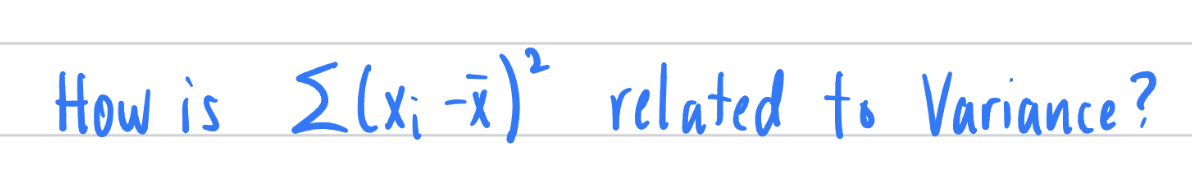
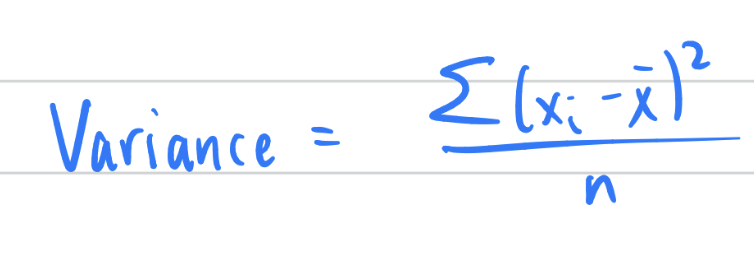
Relationship between SXX and sample variance
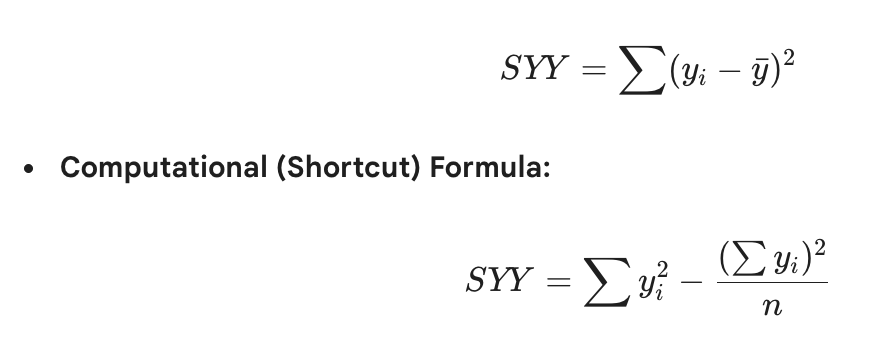
SYY
Sum of Squares for Y. (SST)
Residual = ? - ?
Actual minus expected
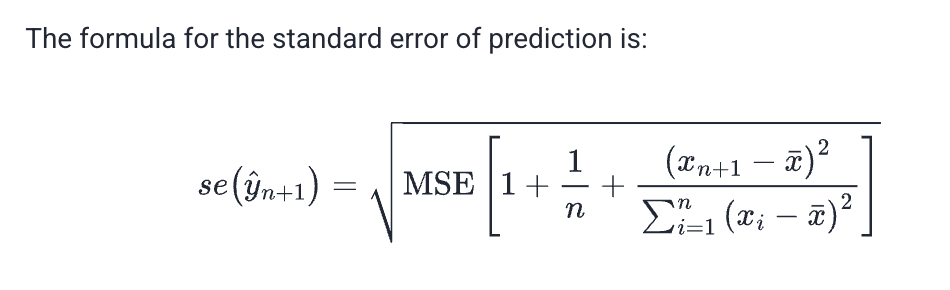
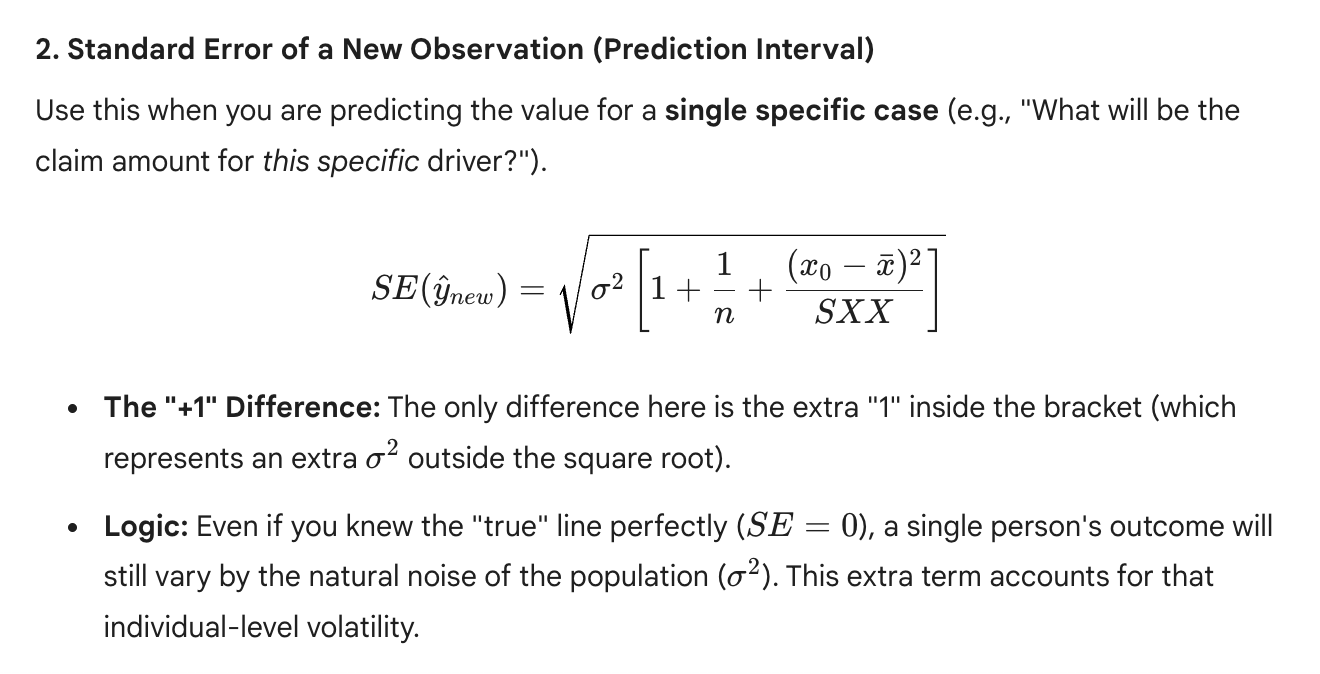
Formula for the standard error of a new observation is:
What is the difference between Standard Deviation and Standard Error?
Standard Deviation: Describes the spread of individual data points in a single sample or population.
Standard Error: Describes the spread (uncertainty) of an estimate if you were to repeat the experiment many times.
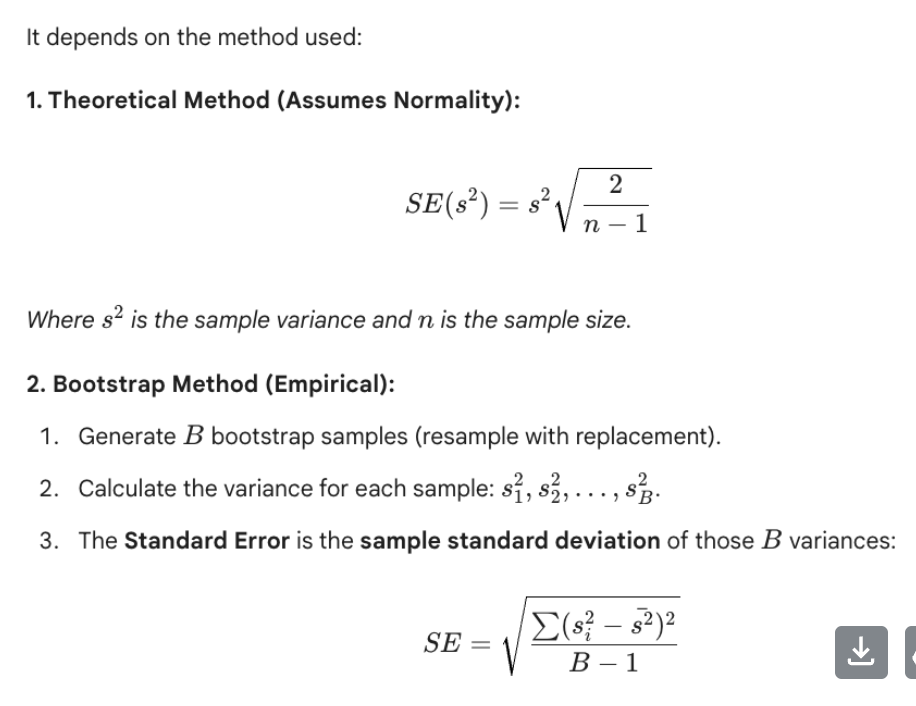
How do you find the standard error of an estimate of the population variance?
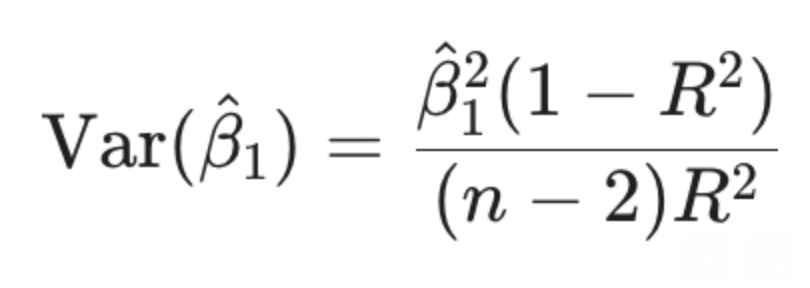
How is Beta1 hat related to R2?
Are Ordinary Least Squares estimates biased or unbiased?
Unbiased
Formula for correlation coefficient, r:
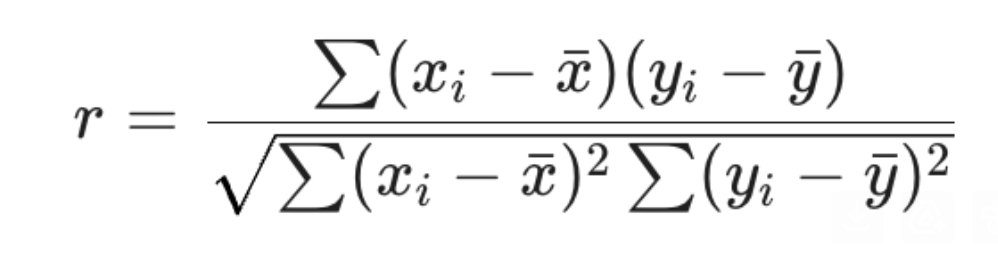
Formula involving SSR, xi, x bar, yi, y bar
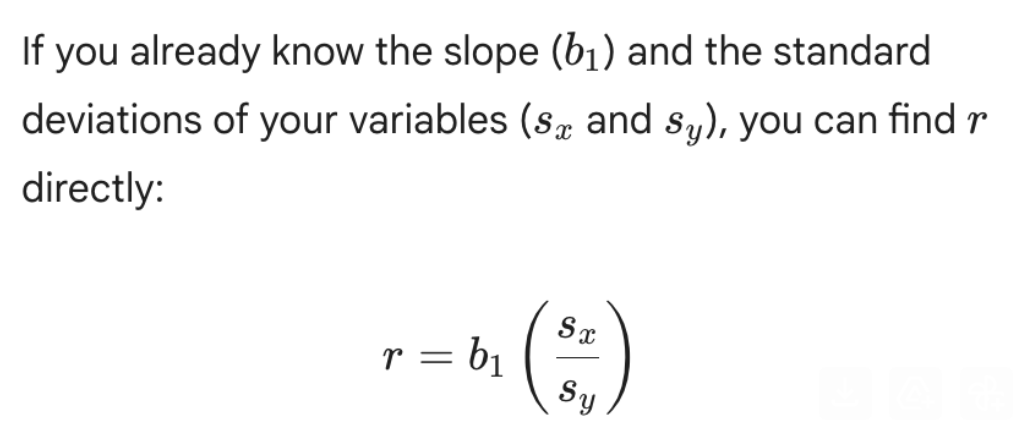
Relationship between r, beta1, sx, sy
Relationship between r, SSR, SST

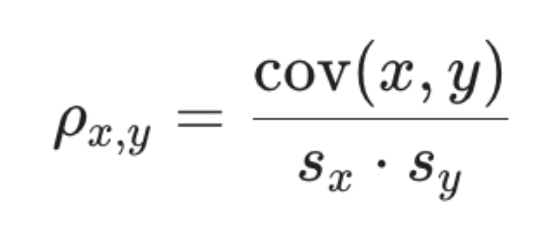
Relationship between correlation, covariance, sx,sy
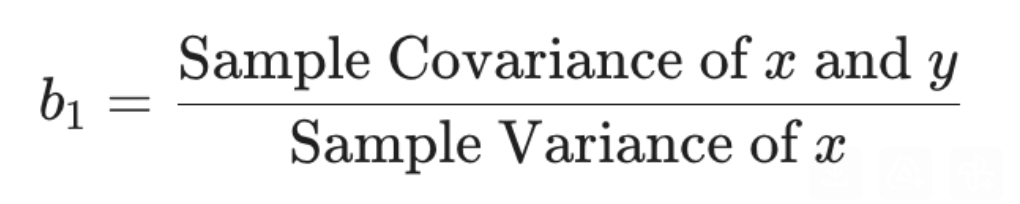
How are sample variances, covariances related to Beta_1, the slope of the regression line?
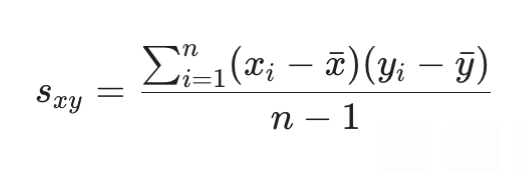
Formula for sample covariance
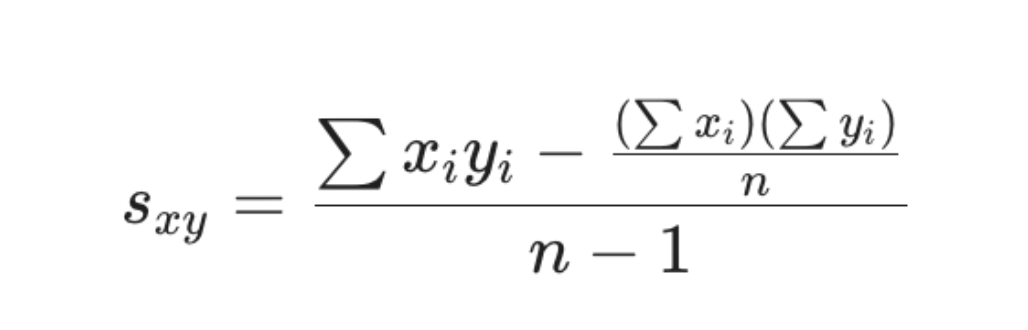
Shortcut for calculating sample covariance
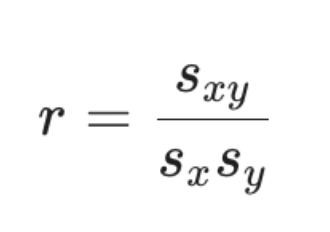
Relationship between correlation coefficient, sample covariance, sample standard devations
Shortcut for variance of Beta1 hat using R2 and n