OM Week 11
1/73
There's no tags or description
Looks like no tags are added yet.
Name | Mastery | Learn | Test | Matching | Spaced | Call with Kai |
|---|
No analytics yet
Send a link to your students to track their progress
74 Terms
What does every operations decision start with?
A forecast
What happens in OM if we get the forecast wrong?
Everything downstream becomes “wrong” too
What are the three main pairings that get forecasted in OM?
Demand and Sales
Unit sales by product, by region, by channel
Used for production planning, inventory, and staffing
Prices and Costs
Raw material prices, energy costs
Affects procurement and budgeting
Supply and Lead Times
Supplier delivery reliability
Affects safety stock and reorder points
Right Censoring
If you sell out, sales undercount true demand
You only observe a demand up to available supply
Four Properties of Forecasts
Forecasts are always wrong
Never report just a point estimate
Always include an error measure
Short term > Long term
Next week’s forecast is more accurate than next year’s
Uncertainty compounds over time
Aggregate > disaggregate
Total company sales easier to forecast than one SKU
Individual errors cancel out when aggregated
Upstream direction
Forecast error amplify as you move up the supply chain
Small retail fluctuation → lrge manufacturer swing
Bullwhip effect
A forecast without an error estimate is
Just a guess
What happens when we over forecast (4 points)?
Excess inventory sitting in warehouses
Spoilage and waste (especially perishables)
Holding costs eat into margins
Markdowns to clear unsold stock
What happens when we under forecast?
Lost sales and empty shelves
Customers switch to competitors
Expediting costs to rush orders
Backorder management overhead
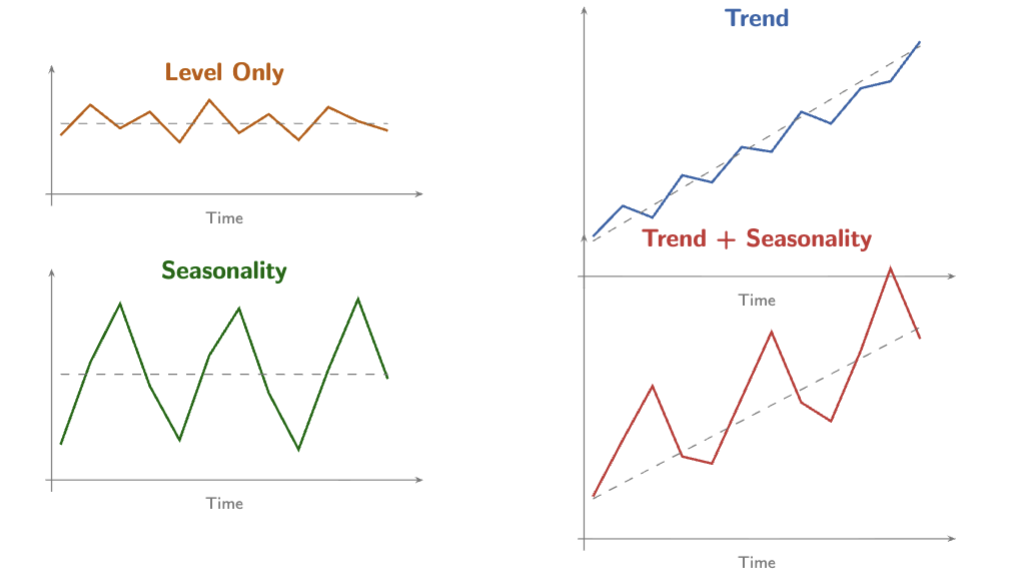
Random Variation Demand Fluctuation
Unpredictable, short term fluctuations
Cannot be forecasted → only measured
Trend Demand Fluctuation
Sustained upward or downward movement
Driven by market growth, technology shifts
Seasonality
Predictable, repeating pattern within a fixed cycle
Weekly, monthly quarterly, annually
Business Cycles Demand Fluctuations
Long term economic expansions and contractions
Hard to predict timing, easier to recognize
What is the forecaster’s job within OM?
Separate what is systematic (trend, seasonality) from what is random (noise)
Forecast the systematic part, measure the random part
Four Demand Patterns
What are the two components of an observation?
Systematic Component (What we can forecast)
Noise
What are the three elements of the Systematic Component?
Level (L): the baseline demand
Trend (T): the rate of change per period
Seasonal Factor (St): periodic multiplier
Multiplicative Model Formula
Ft = (L + T x t) x St
Multiplicative Model
Level and trend set the baseline; seasonality scales it up or down
Most common
Additive Model Formula
Ft = L + T x t + St
Additive Model
Use when seasonal swings are constant regardless of level
What is the rule of thumb for using the multiplicative model?
If seasonal peaks grow as demand grows
What is the rule of thumb for using the additive model?
If peaks stay the same size
Simple Moving Average Formula
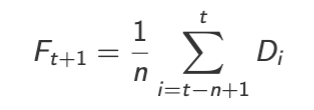
Simple Moving Average (SMA)
Forecast next period’s demand as the average of the last n observations
Each of the last n periods gets equal weight
Periods before that get zero weight
The “window” slides forward each period
What are the implications of choosing a small n for SMA (4 points)?
Reacts quickly to changes
Picks up real shifts faster
But also amplifies noise
Forecast is volatile
What are the implications of choosing a large n for SMA (4 points)?
Smooths out noise effectively
Stable, less jumpy forecasts
But slow to detect real shifts
Forecast is sluggish
A Small n for SMA is [BLANK1] while a Large n is [BLANK2]
Responsive/Stable
Responsive/Stable
Responsive
Stable
Exponential Soothing Formula
a E (0,1) is the smoothing constant
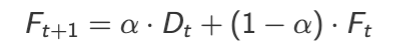
What are the two equivalent interpretations of Exponential Smoothing?
Weighted blend:
New forecast = blend of latest observation and previous forecast
a controls how much weight goes to new data
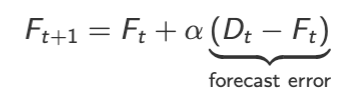
Error correction:
Start with previous forecast
Adjust by a fraction a of the error
If you under forecast, nudge up
If you over forecast, nudge down
Error Correction Formula
What is the advantage of ES over SMA?
Each step back in time multiplies the weight by (1-a)
The forecast is a weighted sum where recent data gets the most weight
Weights decay
Exponentially
What are the implications of choosing a Small a for ES?
Heavy weight on history
Very smooth, stable forecast
Slow to react to real changes
Like a large-n moving average
What are the implications of choosing a Large a for ES?
Heavy weight on recent data
Responsive, catches shifts quickly
But amplifies noise
Like a small-n moving average
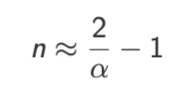
An ES with smoothing constant a behaves roughly like an SMA with:
What level of a should you first try for stable demand?
a = 0.1-0.3
What level of a should you first try for volatile/level-shifting demand?
a = 0.3-0.5
Attributes of SMA pertaining to the following factors:
Weights
Data storage
Tuning parameter
Drops old data
Responds to shifts
Best for
Equal weight on last n periods
Must store n past observations
n (window size)
Completely, after n periods
After n periods, fully
Stable demand, no trend
Attributes of ES pertaining to the following factors:
Weights
Data storage
Tuning parameter
Drops old data
Responds to shifts
Best for
Exponentially decaying weights
Only last forecast + last demand
a (smoothing constant)
Gradually, never fully
Immediately (partially)
Stable demand, no trend
What is a limitation of both SMA and ES?
Neither handle trend or seasonality
Both will systematically under forecast trending demand and miss seasonal patterns
Static Decomposition Approach

What is the goal of the Static Decomposition Approach?
To separate demand into Level, Trend, and Seasonality, then recombine to forecast
Step-by-step Method for the Static Decomposition Approach
Remove seasonality to reveal the trend
Fit a line through the trend
Measure how each season deviates from the trend
Put it back together: trend x seasonal factor
A p-period moving average includes every season exactly once, so
Seasonal highs and lows cancel out
To deseasonalize we average over
One full cycle (p periods)
Where does an Odd average land after deseasonalizing ?
The middle one
Where does an Even average land after deseasonalizing ?
Falls between periods
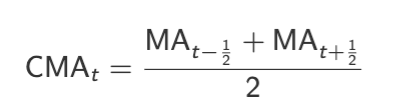
Average two consecutive MAs to “center” at an actual period
Even Average Formula
Averages two offset windows to land on period t
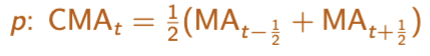
Centering the Moving Average Formula
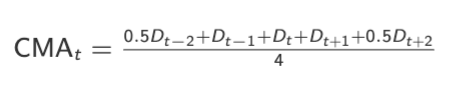
Shortcut formula for computing CMA
Step-by-step CMA Calculation
Compute the CMA
Find the trend
Use the CMA values from Step 1 to estimate a trend line via linear regression
=SLOPE(CMA, periods) and = INTERCEPT(CMA, periods)
What is a seasonal factor? What are the specific seasonal factors?
For each period, divide actual demand by the trend value [PICTURE]
Average the seasonal factors
Put it all together
![<ol><li><p>Compute the CMA</p></li><li><p>Find the trend</p></li></ol><ul><li><p>Use the CMA values from Step 1 to estimate a trend line via linear regression</p></li><li><p>=SLOPE(CMA, periods) and = INTERCEPT(CMA, periods)</p></li></ul><ol><li><p>What is a seasonal factor? What are the specific seasonal factors?</p></li></ol><ul><li><p>For each period, divide actual demand by the trend value [PICTURE]</p></li></ul><ol start="4"><li><p>Average the seasonal factors</p></li><li><p>Put it all together</p></li></ol><p></p><p></p>](https://assets.knowt.com/user-attachments/68e2f6ba-7a4c-4bcc-8e01-cf5de161a8f5.png)
When S>1
Demand is above trend (peak)
When S<1
Demand is below trend
Seasonal factor
Ratio of actual demand to trend
What are the four error metrics you needs and what do they tell you?
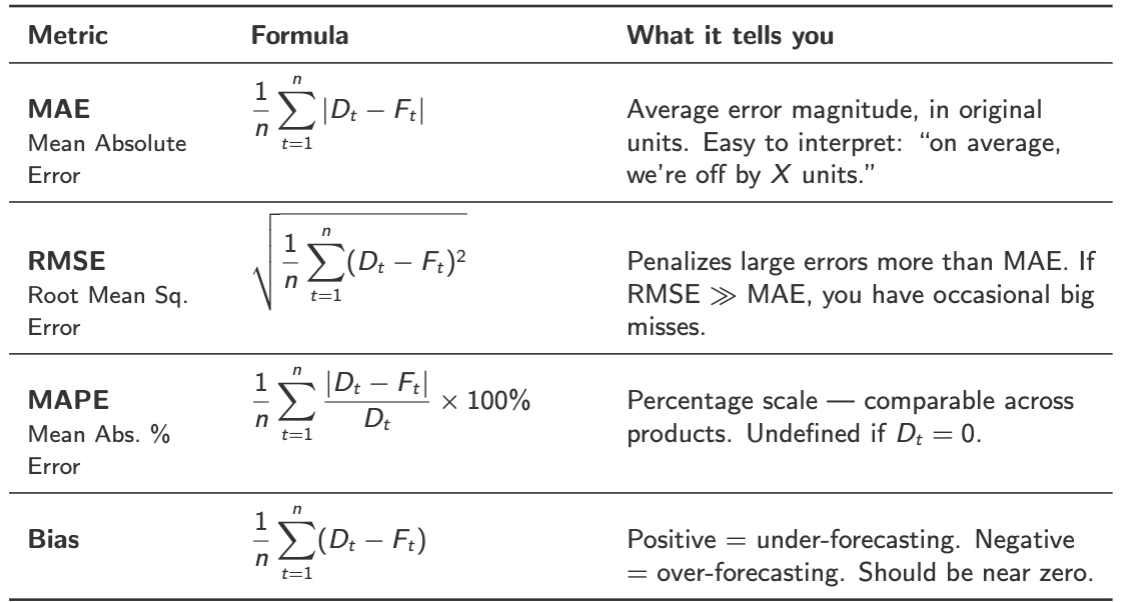
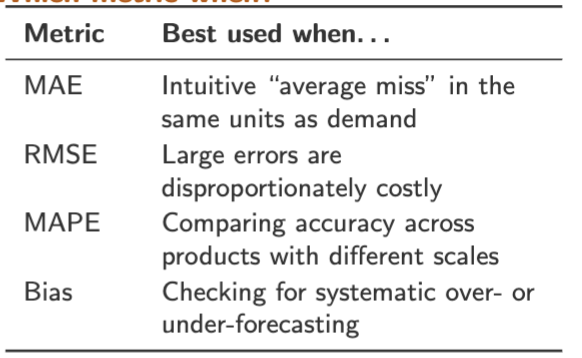
What are the four error metrics and when is each best put to use?
RMSE >= MAE always (True/False)
True
The bigger the gap, the more your errors are “spiky” rather than uniform
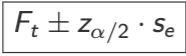
Forecast Interval
Gives a plausible range for demand
Forecast Interval Formula
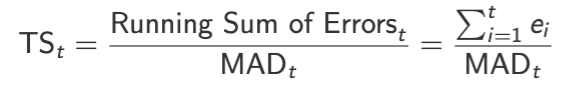
Tracking Signal
Monitors whether errors are becoming systematically biased
Tracking Signal Formula
What does it mean if the TS ~= 0?
Errors show little cumulative signed bias
What does it mean if the TS > 0 and increasing?
Systematically under forecasting
What does it mean if the TS > 0 and decreasing?
Systematically overforecasting
If |TSt| exceeds a threshold (typically +- 6)
The forecast method needs attention
The tracking signal is a control chart for
Your forecast
It triggers an alarm when something systematic goes wrong
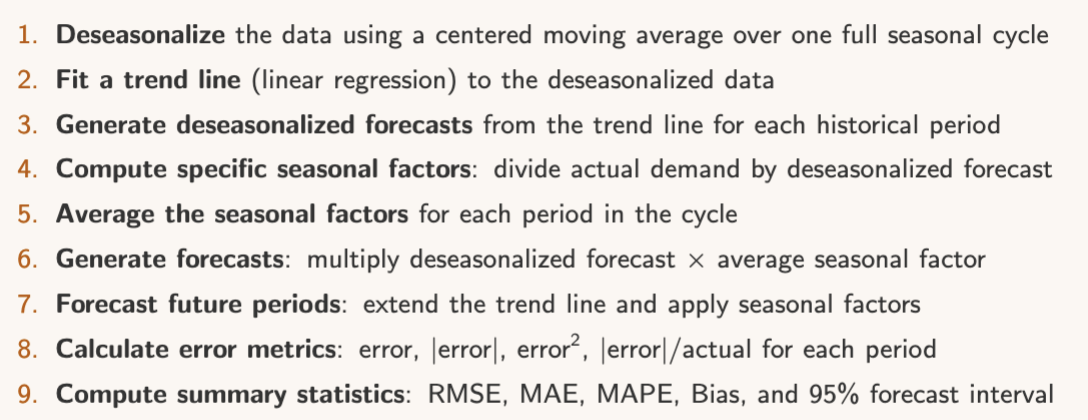
9 Step Process of Static Decomposition
Steps 1-7 build the forecast
Steps 8-9 tell you how much to trust it
Never skip steps 8-9
What are the 3 limitations of Static Decomposition?
Parameters are estimated once from all data
Doesn’t adapt as new data arrives
If the trend shifts or seasonal pattern changes, the forecast becomes stale
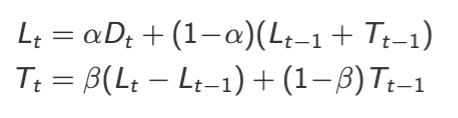
Holt’s Method Formula
Holt’s Winters Formula
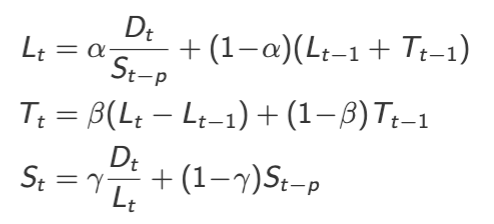
Under Holt’s Method, each component
Updates every period
Forecasts are always wrong (True/False)
True