Univariate Count Data
1/26
There's no tags or description
Looks like no tags are added yet.
Name | Mastery | Learn | Test | Matching | Spaced | Call with Kai |
|---|
No analytics yet
Send a link to your students to track their progress
27 Terms
What type of data is count data used for?
Categorical
What are categorical examples of the independent variable?
- Control vs Treatment
- Control vs Treatment A vs Treatment B
What are categorical examples of the dependent variable?
- success of treatment (versus failure)
- Adherence to policy (versus non-adherence)
What are the two assumptions for count data?
- Mutual Exclusivity
- Exhaustiveness
What is mutual exclusivity?
Observations cannot be in more than one category
What is exhaustiveness?
- Categories represent all options seen within your data
- Non-observations are left uncategorized
What are binomial experiments?
- Research design that is used to compare proportions
- dichotomous data: to and only two categories
What are the 4 essential characteristics of binomial experiments?
• have a set number of identical trials
• have only two possible outcomes for each trial
• have mutually exclusive and exhaustive outcomes for each trial
• have equal probabilities for each trial
What is p?
is the probability of your "outcome of interest
p + q =
1
What is q?
This is the proportion associated with the other outcomes
q = 1 - p
What is the difference between a binomial experiment and Bernoulli trials?
• binomial experiment - set number (k) of identical trials
- What is the probability thata student will guess 5 or more questions correctly?
• Bernoulli trial - 1 trial (i.e., k = 1)
- What is the probability that a student will guess a particular question correctly
What is the mean and SD for the Bernoulli distribution?
Mean: p
SD: √pq
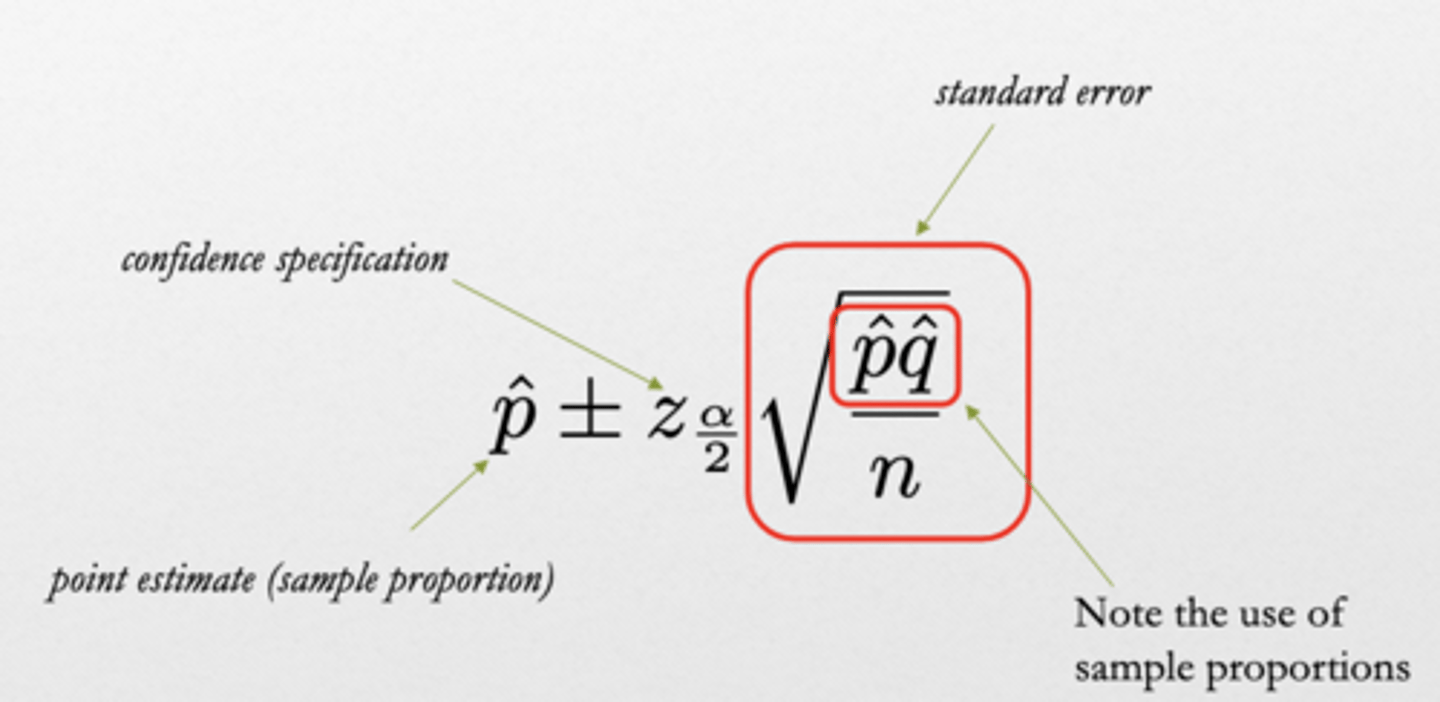
sample proportions are denoted with
"hat"
• centre of the distribution of sample proportions is: 𝑝̂
• SD of the distribution of sample proportions is: √𝑝̂q̂
When is variability maximized?
when 𝑝̂ = 0.50
What are the components of the confidence interval for proportions?
How do we establish the rejection region/ critical value for proportions?
alpha subtract 0.5
What can proportional statistics also be presented as?
as frequency counts
The advantage to presenting proportional data as frequencies is?
• it reminds the researcher to present the total n-size (without which, proportional data is useless)
• it allows for the comparison of more than two proportion
For binomial data, what is equal?
z2 =χ2
What is chi- square?
is a test of model fit...and it can be employed for any number of categories
What happens when you increase the number of comparisons for chi - square?
You inflate the type I error by carrying out multiple comparisons for the same research questions
What determining your rejection region for chi - squre what do you use?
χ2crit always determined using a non-split alpha level
What are the degrees of freedom from χ2
• df = k - 1
• k is the number of categories
Since chi-square is an omnibus test what does it tell us?
• tells us that at least one of the probabilities differs from our expectation, but it doesn't tell us which one
What can we use to see which cells contributed to the chi-square?
we can use the standardized residual (a value that may be interpreted as a z-score)
How do we interpret standardized residuals?
by using a "greater than 2" rule (i.e., if the absolute value of a
residual is greater than 2, then the cell contributed some meaningful information to the chi-square)