Combined deck
1/317
There's no tags or description
Looks like no tags are added yet.
Name | Mastery | Learn | Test | Matching | Spaced | Call with Kai |
|---|
No analytics yet
Send a link to your students to track their progress
318 Terms
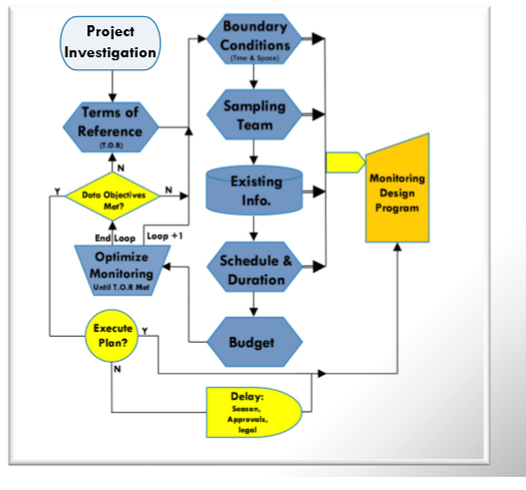
Components of a monitoring program
Objective of monitoring
Quantifying xyz (e.g., accidental spills, long-term temporal conditions), better understand processes, fate of contaminants in environment, economics & governance.
Includes feedback (did we accomplish goal of project, is project succeeding, etc)
Terms of reference (after project investigation)
The details of the project: what is being investigated & why, what’s the sampling program, limitations/boundaries to the study, measurements needed, duration, sample frequency etc
Study boundaries
Defining boundaries of a body to be investigated to develop a monitoring program.
Body conditions internal vs external for a column experiment
Internal: diameters, length, open/closed ends to atmosphere, # + position + diameter of sampling ports, construction materials
External: temp, humidity, barometric pressure, vibration, light, radiation, sound, etc
Most environmental investigations can be defined by 3 principle boundary conditions. What are they?
Static state, assumed to be independent parameter (Type 1 or Dirichlet Boundary Condition)
Constant rate which specifies the 1st derivative of the dependent variable (Type 2 or Neumann Boundary Condition)
Variable rate or state which specifies a function of the dependent variable and its 1st variable (Type 3 or Cauchy Boundary Condition)
Sampling team consists of?
Project manager, subject experts, lab experts, data analysis & QA/QC, stakeholders
Project manager
Must understand requirements, have the knowledge of all particular disciplines, liaison across all actors, budget oversight.
Likely the greatest impairement that any investigation or monitoring program has is what?
Expectation for immediate answers in the absence of (or limited) info.
Desktop study
Objective is to collect & collate as much background info about a site as possible in time and space. Field work is expensive and takes years.
This data is usually available in GIS formats, previous reports, and speaking with people.
Aerial photography
Current & historical aerial photographic coverage provides valuable info on the consistency and/or change in land use. In many areas, aerial coverage has been captured over the past 80 years.
Identification of types of land use (+ buildings or ground operations such as airports) can provide insightful info (in inferences) regarding chemicals that may be used at a location, change in infiltration (from compaction), change in runoff (storm sewers), changes in water quality, etc.
Land use coverage mapping
In ON, 99 different land use types are delineated, from urban to farmland, swamps, lakes, water ways, etc. Can infer things like agro-chem use, transportation related contamination, water usage, evapotranspiration, infiltration, etc
Soil surveys
Used to estimate infiltration rates (related to hydraulic conductivity), soil chem, terrestrial species (& thus evapotranspiration), farming practices, tile drainage, and overland flow characteristics
Meterological data
Systematic measurements of precip, temp, wind speed & direction, barometric pressure, and solar radiation data are made across the country, which are available through Environment Canada. Monitoring data is also available through private monitoring systems like cities & municipalities.
Surface water flow data
Systematic measurements of river stage which are related to river discharge are made across Canada on a continuous basis at over 2500 locations. Data made available through Environment Canada (Water Survey of Canada).
Data include: peak annual discharge, mean daily, monthly & annual discharge observations and continuous readings.
Geology data
Record of borehole logs & well records are available through MECC (MECP). Incl water table info, sub surface geology, geochem. Geology maps available through ON Geological Survey
Schedule & duration - there are potentially several timelines to any given investigation. Examples?
Proponent, situational, scientific (chem, physical, biological), statistical, lifecycle, financial, geologic, etc
What to consider in the budget?
desk top resources (e.g., aerial photos, GIS)
travel (accommodations, vehicles, etc)
sampling equipment
sampling & disposal vessels
sampling transport, platform, access
sample analysis (in field vs shipped vs out sourced vs type of analysis)
safety (PPE, extra people, training, etc)
access to site (is equipment/time needed)
jurisdictions (property owners, liability etc)
contingency
personnel (# of sampling events + people)
out of scope budget (ancillary budget to identify unexpected discoveries like chemicals that need to be cleaned up)
pre-study/gap study (better understand range & scope of projects)
Optimizing monitoring
Limits to the study, are all members & methods required, etc
Data objectives met - feedback loop
To verify all data objects are met to achieve terms of reference.
Often during the design of a monitoring project program, the scope and overall terms of reference of a project aren’t validated = data collected can’t answer questions being posed. We forget why we do it.
Troposphere
Majority of water vapour & atmospheric pollutants commonly associated with anthropogenic contributions to the atmosphere are largely limited to the atmospheric region between the troposphere & stratosphere (known as tropopause).
Atmospheric turbulence
Assume airflow passing over a relatively smooth surface can be idealized as quasi-parallel flowlines where velocities increase within increasing distance away from the ground surface to a given elevation where a relatively uniform velocity field is maintained.
Velocity at ground surface = 0, increase quickly vertically upward & is proportional to resisting shear stress. A turbulent boundary prevails near the ground surface (proportional to height of obstacles → ground effect)
Wind measurement devices
weather vane (±15 degrees), weather sock, wind anenometer & vane,
Weather sock
Wind direction (± 15 degrees) & speed (± 5 km/h up to approx. 30 km/h)
Wind anemometer and vane
Rotation of cups produce an AC sine wave voltage proportional to wind speed frequency of rotation. Rotation frequency is converted to wind speed via the manufacture’s calibration curve.
Wind anemometer and vane accuracy
Dependent on manufactures design. Usually ± 0.1km/h
Wind anemometer and vane limitations
Effective response to strong gusts is not achievable in many makes & models (a ceiling threshold above which a dampener regulates the rotation frequency to minimize damage to the sensor)
Precipitation measurement devices
standard daily rain gauge, tipping bucket rain gauge, geonor (or OTT pluvial) precipitation gauge
Standard daily rain gauge
Used to observe daily precipitation across the world. Historically associated with agricultural practices, the daily rain gauge is accurate to within ±0.5mm (depending upon make and model).
Many of historical records provided by responsible agencies are based upon daily ritual of a person (commonly a farmer) systematically observing & recording precipitation data that has been on (mailed) to responsible agency.
Tipping bucket rain gauge
Rainfall enters into the gauge through the orifice at the top with flows into a small oscillating bucket. When the buck is filled with water, it “tips” and triggers a relay switch, which is recorded by the associated data logger. The volume of each filled buck “tip” is then converted into a per area precipitation rate. Frequency upon which buckets “tip” is employed to calculate the intensity of the precipitation event (rainfall volume over observation time).
Tipping bucket rain gauge - how do you deal with snowfall?
External power source can be used in combination with a heating ring at the top of the orifice to intercept & melt incoming snowfall and convert it to water equivalent (SWE). Works well for “light” snow but decreases in accuracy with increasing` intensity.
Tipping bucket rain gauge limitations
During intense rainstorm events, rain droplets can fall directly through the orifice into the tipping bucket, triggering a false reading = overrepresenting intensity of precipitation events. Diffusers to the orifice can be added to minimize this, but the potential for precipitation to deflect beyond the limits of the orifice (off of the diffusers) = underrepresentation
Geonor (or OTT pluvial) precipitation gauge
Precipitation falls through an orifice into a large collection reservoir. Precipitation that falls into the reservoir is measured via a load cell (programmed recording time intervals — commonly every 15 min-1h) and converted to a per area precipitation rate based upon the orifice area at the top of the precipitation vessel.
Geonor (or OTT pluvial) precipitation gauge accuracy
Depending on make/model but commonly within ±0.1mm
Geonor (or OTT pluvial) precipitation gauge - what is added to prevent water from evaporating?
Thin layer of motor oil on top. Thin layer of glycol added to the bottom to melt receiving snow & frozen forms of precipitation to liquid form.
Wind & precipitation measurement devices - doppler radar
Continuously emit and receive microwave frequencies across a semi-spherical domain. From the relative time lag between a frequency being emitted & received (+ receiving intensity) at radar station (coordinate location), info us sed to calculate intensity & location of precipitation relative to Doppler station.
Solar radiation measurement
short-wave, silicon photocell pyranometers, thermopile pyranometers,
Solar radiation measurement - short-wave solar radiation
Net solar radiation (or solar irradiance) is the transmission of energy from the sun in the form of electromagnetic waves or subatomic particles (W/m²).
Solar irradiance is measured at the Earth’s surface after all atmospheric adsorption & scattering has been accounted for.
Solar radiation measurement - silicon photocell pyranometers
Produce a μA output current similar to how a solar panel converts the sun’s energy into electricity. When current passes through a shunt resistor, it’s converted to a voltage signal (sensitivity in range of μV/W/m²). A plastic diffuser cover is used to provide a uniform cosine response at varying sun angles.
Solar radiation measurement - silicon photocell pyranometers limitations
Only sample a portion of the short-wave radiation & performs well for clear sunny sky weather conditions, but measurement errors are high during cloudy days. The uniformity of daylight spectrum under most sky conditions limits error typically less than ±3% with max errors of ±10%. Error is usually positive under cloud conditions.
Solar radiation measurement - thermopile pyranometers
Using a series of thermoelectric junctions (multiple junctions of 2 dissimilar metals - thermocouple principle) to provide a series of several μV/W/m² proportional to the temp difference between a black absorbing surface & a reference material/colour (may be white reflective surface or internal portion of sensor base). Thermopile pyranometer’s black surface uniformly absorbs solar radiation across the solar spectrum.
Solar radiation measurement - thermopile pyranometer’s black surface uniformly absorbs solar radiation across short-wave solar spectrum from 0.285-2.8μm. The uniform spectral response allows thermopile pyranometers to measure…?
Reflected solar radiation, radiation within canopies or greenhouses, albedo (reflected:incident) when 2 are deployed as an up-facing/down-facing pair.
Common short-wave radiation occurrences & why
Observed outgoing solar radiation at weather station tend to exhibit a damped measured radiation relative to incoming shortwave radiation on some days and others a response that follows the same radiation trends of the incoming radiation.
Days where outgoing radiation exhibits a similar response to incoming radiation are consistent with conditions where snow cover occurs = greater proportion of net radiation is reflected (higher surface albedo). Vice versa
For calibrating watershed models, RADAR data is used to do what?
Specify the spatial distribution (& intensity) of precipitation landing upon a watershed area. Data is then used to aid in calibration of a water balance.
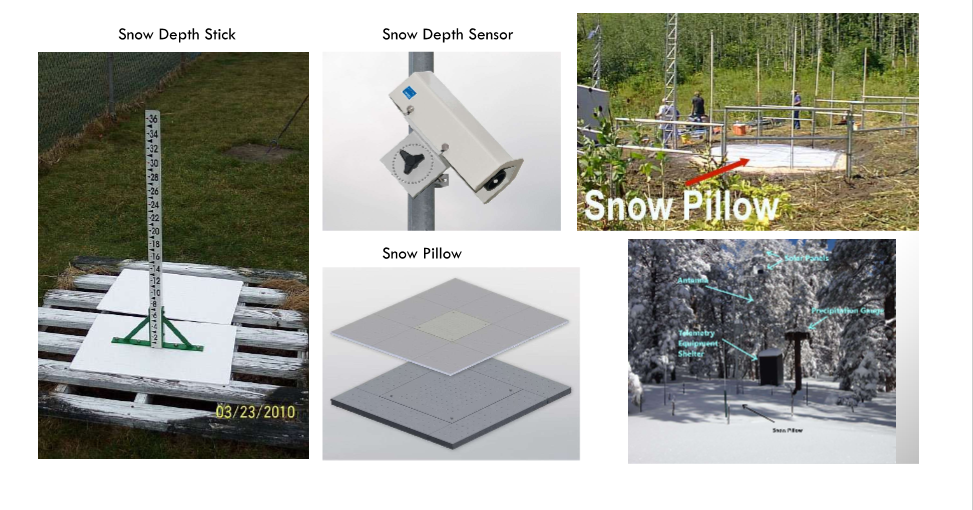
Snow measurement devices
What do we do with data desserts? (i.e. data gaps in spatial coverage)
approx. data
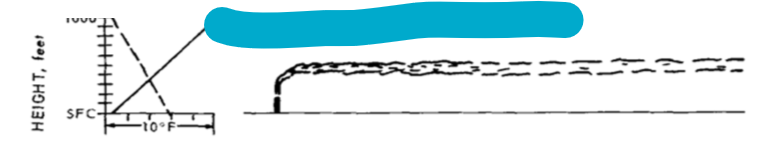
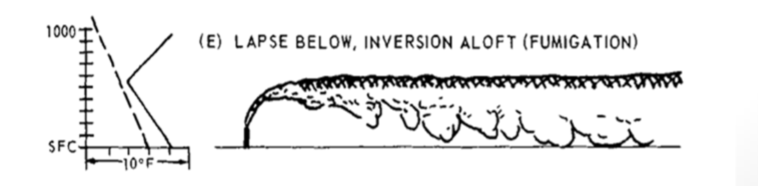
Lapse rate
Rate of change in temp (or other parameter) as a function of elevation above the ground surface (altitude)
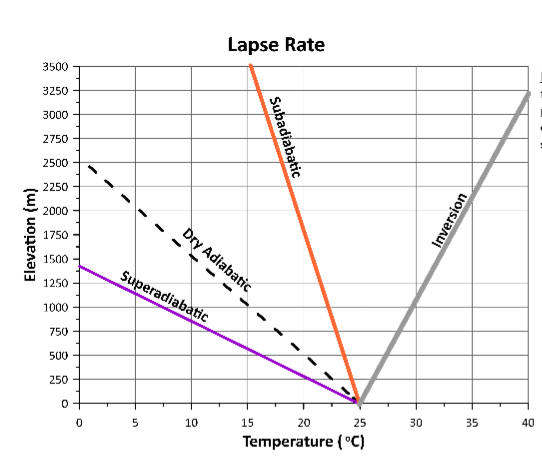
Subsidence inversion
Caused by a large mass of warm air subsiding over a region
dashed line = adiabatic rate
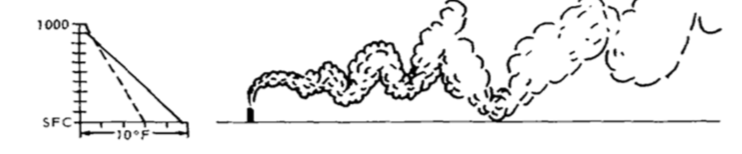
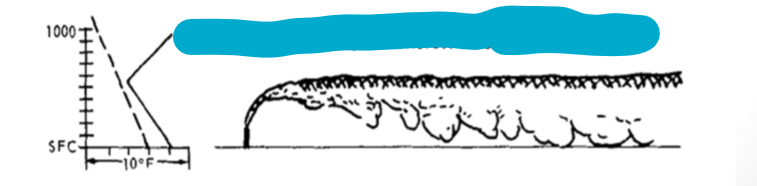
strong lapse condition (looping)
dashed line = adiabatic rate
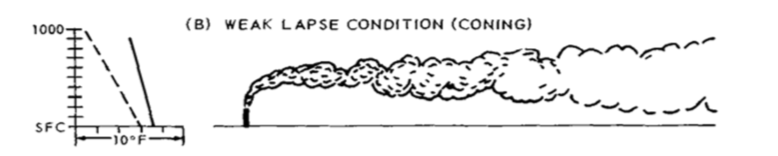
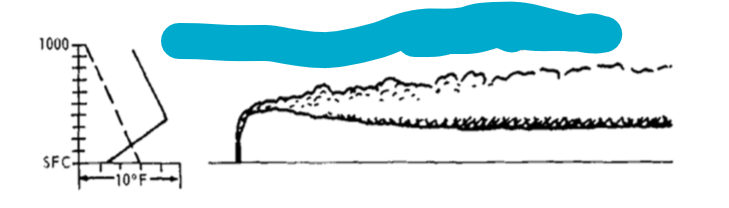
weak lapse condition (conning)
dashed line = adiabatic rate
inversion condition (fanning)
dashed line = adiabatic rate
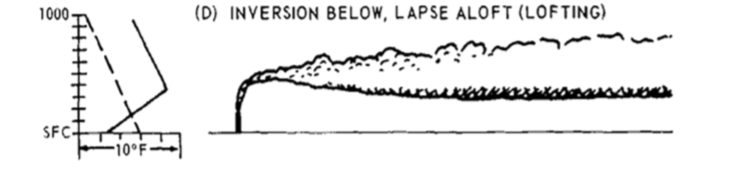
dashed line = adiabatic rate
Air quality monitoring equipment for gaseous sampling
detector tubes, tedlar bag, canister sampling (summa canister), sorbent tubes
Air quality monitoring equipment for airborne particulate matter sampling
gravimetric (weighting method), tapered element oscillating microbalance (TEOM), optical methods
Detector tubes
Rapid method of acquiring “snap-shot” measurement of gases around sites where air quality is of concern (e.g., chemical spills, fires, gas leaks). Compound (of interest) specific tubes are required for each contaminant of interest, which are drawn via a vacuum pump through the detector tube.
Can also measure for adequate levels of oxygen.
Detector tubes for air quality measuring are considered to be an ____ sample.
instantaneous
Tedlar bags
Air sampling bags are containers used to collect whole air samples for landfill gas, soil gas, and stationary source applications. Can be constructed from various materials, which differ in terms of stability characteristics & cleanliness.
Flow rate must be recorded.
In general, air sampling bags are best suited for what projects?
Involving analysis of compounds in ppmv range. They can be used to collect sulfur compounds, but only if fittings are non0metallic.
Instantaneous or pseudo-instantaneous sample
Canister sampling (summa canister)
2 common methods of canister sampling: grab (instantaneous) or integrated (time-averaged). Canister vacuum is used to draw sample into the canister. Commonly referred to as passive canister sampling.
Canister sampling (summa canister) - grab sample
Taken over a short interval (i.e., 1-5 min) to provide a point-in-time sample concentration.
Canister sampling (summa canister) - integrated sample
Taken over a specified duration or utilizing a specified flow rate.
Sorbent tubes
Based upon a series of target specific parameters (user chosen parameters to measure). Usually contain charcoal as absorption medium. As air is drawn into the tube, organic chemical vapours adsorb onto the surface of the charcoal while major inorganic constituents pass through. After sampling, organic vapours are extracted in the lab and determined by GC using mass spectrometer.
Fine particles are commonly generated through what methods and what are they rich in?
Combustion or by secondary gas to particle reactions. Rich in carbon, nitrates, suphates, and ammonium ions.
Gravimetric (weighting) method
Air is drawn through pre-weighted, layered filters, and articles collect on filter. Filter is removed & re-weighed. Like sieve analysis.
Filer choice is important for gravimetric (weighting) method because of…? What material has been found to be the most stable type of filter?
Substrates are sensitive to environmental factors (e.g., relative humidity), PTFE-bonded glass fiber
Gravimetric (weighting) method is most widely adopted by regulatory bodies, but it’s not the most pragmatic method for PM10 because…? What is it useful for then?
Not real time, provides only overage data for period the filter was deployed (i.e., time integrated sample). Useful in providing a quick snapshot of PM10 at a site to determine locations for more intensive monitoring.
Tapered element oscillation microbalance (TEOM)
Uses a filter which is mounted on the end of a hollow tapered tube made of quartz. Particles collect on filter and cause oscillation frequency of the quartz tube to vary. Pseudo instantaneous b/c PM10 measurements can be logged in near real time.
Optical methods for airborne PM sampling
Suite of instruments which measure light scattering, absorption or extinction caused by PM. Real time (instanteous) sampling
Most common optical method for airborne PM sampling is?
Optical particle counter (OPC). Uses a light source, normally a laser diode, to illuminate particles & a photodetector to emasure light scattered by those particles.
Pros and cons of OPC - where are they used (or not used) as a result?
Lower purchase & operating costs than gravimetric meters, but lower precision & sensitivity = not considered appropriate for compliance monitoring.
Suitable for PM research b/c real-time monitoring & low cost
Representativeness (of data)
A qualitative data quality indicator which interprets the degree to which an obtained sample accurately & precisely represents in the in-situ conditions of a pop. from the perspectives of: a sampling point, a process, a condition.
After representativeness, monitoring design can then be classified by….
Ultimate representativeness
sampling point
subsampling techniques
Ultimate Representativeness
measure of how “true” the overall procedure from acquisiton to analysis reflects the in-situ condition
Representativeness - sampling point
How representative each particular location & time is in representing the “true” condition
Representativeness - subsampling techniques
Preparation, analysis, and analytical techniques representing the “true” condition
Air quality sampling representativeness
Temporal turbulence generated in airflow field, orders of magnitude in observed & measured conditions can occur at the same sampling positions
4 general conditions are commonly being quantified for air samples
Source, background, typical, worst case
Placement of sampling devices for atmospheric parameters - what issues exist?
turbulence, eddies, dispersion generated by obstacle. Orographic lift, climatic regions, water bodies effects, side effects (e.g., fence)
Impact of imparting turbulence of placement of sampling device
Airflow must depart from assumed parallel flowlines and diverge and re-converge after the body = turbulence. Scalable from small body, field scale, mountain scale.
Orographic lift
Movement of an air mass passing from an ocean or lake region (containing greater amounts of water vapour) landward which then must be vertically displaced over a body (e.g., mountain). Adiabatic cooling (linear decrease in temp with increasing elevation). Follow Bernoulli’s.
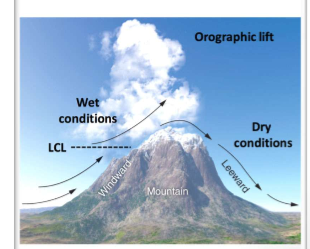
Orographic lift effects on regional precipitation
Spatial location of a monitoring station (relative to position of body) affects distribution and the amount of precipitation acquired (relative to background conditions). In a similar fashion, wind magnitude also varies from presence of body.
How do climatic regions (in NA) impact atmospheric parameters and sampling areas?
Different climatic regions = different conditions (moisture, elevation, topography, wind, etc) = different precipitation (type, intensity, and distribution of storm events). Need appropriate widget for appropriate type.
Convective summer thunderstorms in central & eastern Canada are created by? What is the issue with gauge stations here?
Steep vertical temp gradients with rapid vertical updrafts, often leading to intense & very localized (or pockets) rainstorm events vs large sub-continental region events. These can be intense over a small area, so if gauges are too far apart, the storm may pass through 2 stations and no event would be recorded.
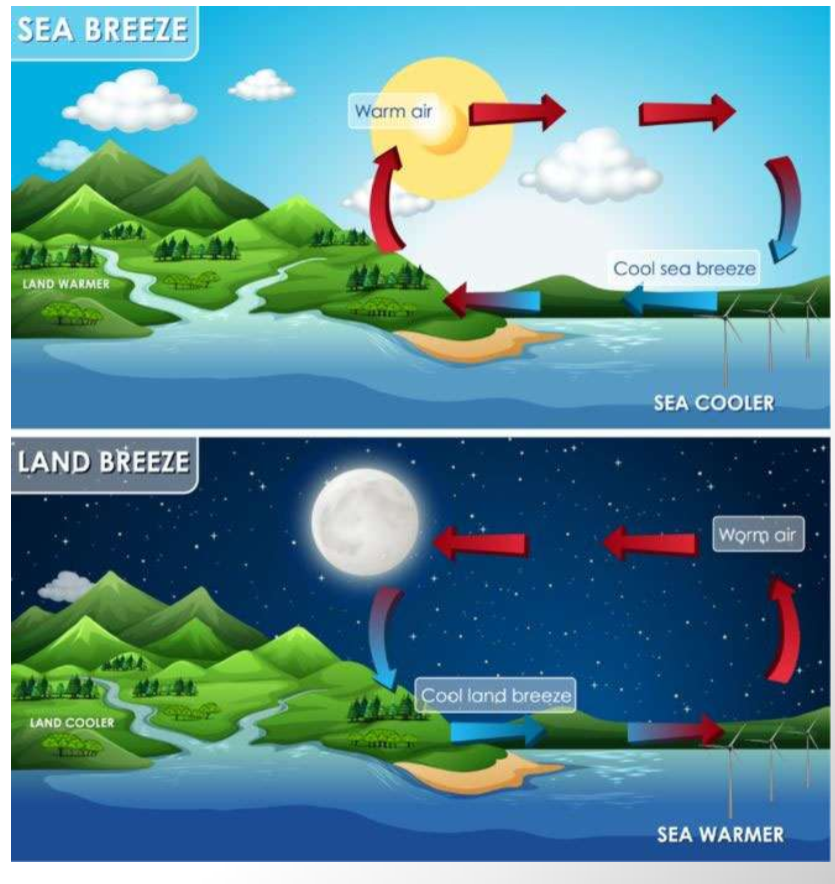
Effects from water bodies on atmospheric parameters
Convective cells & albedo - daily wind shift patterns. Local circulation patterns right at the lake.
Given the temporal turbulence generated in the airflow field, orders of magnitude in observed & measured conditions can occur at the same sampling position. 4 general conditions are commonly quantified. What are they?
background, typical, worst case, variability
Lapse rate
Rate of change in temp (or other parameter) as a function of elevation above the ground (altitude)
Subsidence inversion
Caused by a large mass of warm air subsiding over a region
Radiation inversion
Caused by radiation of heat from earth during the nighttime. As earth’s surface cools over the nighttime period, escaping of warm air is trapped by a region of warm air above.
Union Carbide India Limited (UCIL) - Bhopal, India. They produced carbaryl pesticide, containing methylisocyanate (MIC). What happened?
MIC leaked. Many people died + continuing birth defects. MIC is dense, highly flammable, reactive compound.