Lecture 3: Lithosphere and climate models
1/23
There's no tags or description
Looks like no tags are added yet.
Name | Mastery | Learn | Test | Matching | Spaced | Call with Kai |
|---|
No analytics yet
Send a link to your students to track their progress
24 Terms
Truncated earth science
Earth is 4.54 ± 0.05 billion years old
Early Earth’s atmosphere had no oxygen and was mostly nitrogen and CO2
Earliest life
3.85 billion years ago – organic carbon found in rocks
bacteria found 3.46 billion years ago in Western Australia.
Precambrian lasted from 4.5 billion to 540 million years ago when complex life started during the Cambrian
Made up of lots of small proto continents
Tectonic and volcanic activity has reshaped the landmasses and the atmosphere, ocean and cryosphere many times during the Earth’s history
Plate tectonics
The Earth’s plates are constantly changing through time
There have been a few supercontinents
Pangaea 250Ma
Gondwana 200 Ma
But also times when the continents are more spread out (like today)
The distribution of the continents (and oceans) impacts the climate
Milankovitch cycles (external solar radiation)
The orbit and tilt of the Earth changes overtime
Determines how close the Earth is to the Sun, affecting the amount of solar radiation travelling to Earth (driving interglacial cycles
Eccentricity
Highly elliptical orbit
Nearly circular orbit
Obliquity
Axial tilt
Ellipse orbit
Precession
Precession of orbit
Why are we interested in past climate?
Paleoclimate archives (e.g. ice cores, corals, marine and lake sediments, speleothems, tree rings, borehole temperatures, stalagmites, lake cores, soils) permit the reconstruction of climatic conditions before the instrumental era
Establishes long-term context for the climate change
beyond the past 150 years and the projected changes in the futureMethodical measurements of temperature on earth only started in ~1850
To understand natural climate variability and change through time we reconstruct past temperatures using proxies (which record a response to past temps or other climate variables (e.g. rainfall, winds))
Temperature and climate proxies
Can be physical, chemical or biological
Physical proxies
Colour, grain size, magnetism, texture
Chemical proxies
Could be the concentration of elements, or chemical characteristics of those elements
Biological proxies
Include the remains of living organisms and includes pollen, diatom and charcoal
CO2 feedback (warming)
External forcing (increase in insolation) → warmer oceanic temperatures (either direct or through ice sheet loss) → ocean CO2 solubility reduced → CO2 released from oceans into atmosphere → higher atmosphere CO2 concentrations drive greenhouse effect
CO2 feedback (cooling)
External forcing (decrease in insolation) → colder oceanic temperatures → ocean CO2 solubility increased → CO2 absorbed from atmosphere into oceans → lower atmosphere CO2 concentrations reduce greenhouse effect
Climate feedback loops
Positive feedbacks
albedo
warming oceans
methane from wetland/permafrost and the oceans (clathrates)
land use - deforestation
bushfires
Negative feedbacks
weathering
increased cloudiness
biological productivity
ocean solubility of CO2
Climate models need to take these feedbacks into account
Paleoclimate modelling intercomparison project (PMIP)
Same models as CMIP, but run using boundary conditions determined from paleoclimate archives
e.g. CO2 concentrations
Model past climates which are significantly different from modern climates to test the model’s abilities to model these very different climate conditions
Originally focused on mid-Holocene and Last Glacial Maximum, but extended to other time periods (Last Interglacial and Pliocene Warm Period)
Targeting periods of time that we have enough proxy data to compare w
May provide analogues for the future
What is a climate model?
A climate model is a computer program that model Earth or its climate system using a horizontal (latitude-longitude) or vertical grid (height or pressure or ocean depth)
The model can conclude a number of different processes (e.g. ocean-atmosphere)’
Climate model is made of:
governing equations (parameterisation)
forcing conditions
natural (solar, volcanoes)
human (greenhouse gas emissions, aerosol, land use change)
initial boundary conditions
Global circulation models (GCM) which is a supercomputer produced model output
Hierarchy of climate models (increasing complexity)
Simple
Energy Balance Models (EBM)
Intermediate
2D EBMs
simple Global Circulation Models (GCMs)
coupled Atmosphere-Ocean Global Circulation Models (AOGCM) (physical processes only)
fully coupled Earth Systems Models (ESM) (usually include biogeochemical processes and carbon cycle)
Complex
Coupled Model Inter-comparison Project (phase) 6 (CMIP6)
*All models have biases (different parametrisation of processes) so combine results of the models to produce an average (or model ensemble)
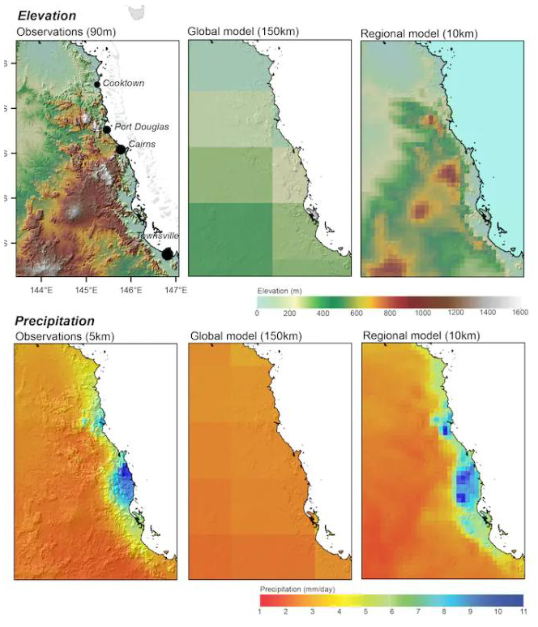
Regional climate models
Most global climate models (GCM) are relatively coarse resolution (~200 km)
To get higher resolution you need to use a regional coupled model (RCM)
e.g. <10 km – which is nested within a coarse GCM – provide the boundary conditions.
This is called downscaling.
Stretched grid models
Run for the entire globe, but have a higher resolution over the area of interest
e.g. Conformal Cubic Atmospheric Model (CCAM)
Why do we run regional models?
Regional models display:
Improved topography
Coastlines
Extremes in data
They may not improve on large scale features inherited from the driving global model
Coupled Model Intercompatison Project (CMIP)
computer-based models of the Earth's climate, where different parts (atmosphere, oceans, land, ice) are "coupled" together, and interact in simulations
a collaboration of different worldwide modelling groups who run Coupled Models and run historical model runs and then future SSP scenarios
by comparing model outputs, they can
look for agreement and disagreement (or combine the outputs to produce a Model Ensemble to cancel biases)
Evaluation of a CCAM model (example)
AGCD gridded dataset is compared to model
Compared the performance of the downscaled models and host models
Also examines:
Extremes
Seasonality
Wet/dry days
Paleo climate models
Can test models by comparing paleoclimate data
e.g. the last glacial maximum when it was colder
Help to determine the climate sensitivity
e.g. temperature increase for a doubling of CO2
Tests whether we understand all the
climate processes and feedbacks between the
different systems